This article was automatically generated by the NFC Market Live AI analysis system. (Updated: 2026-11-04 09:33 JST)
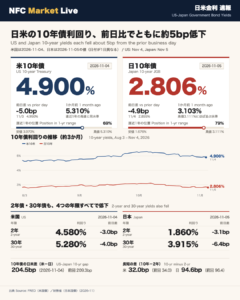
📊 US and Japan government bond yields, as of November 2, 2026.
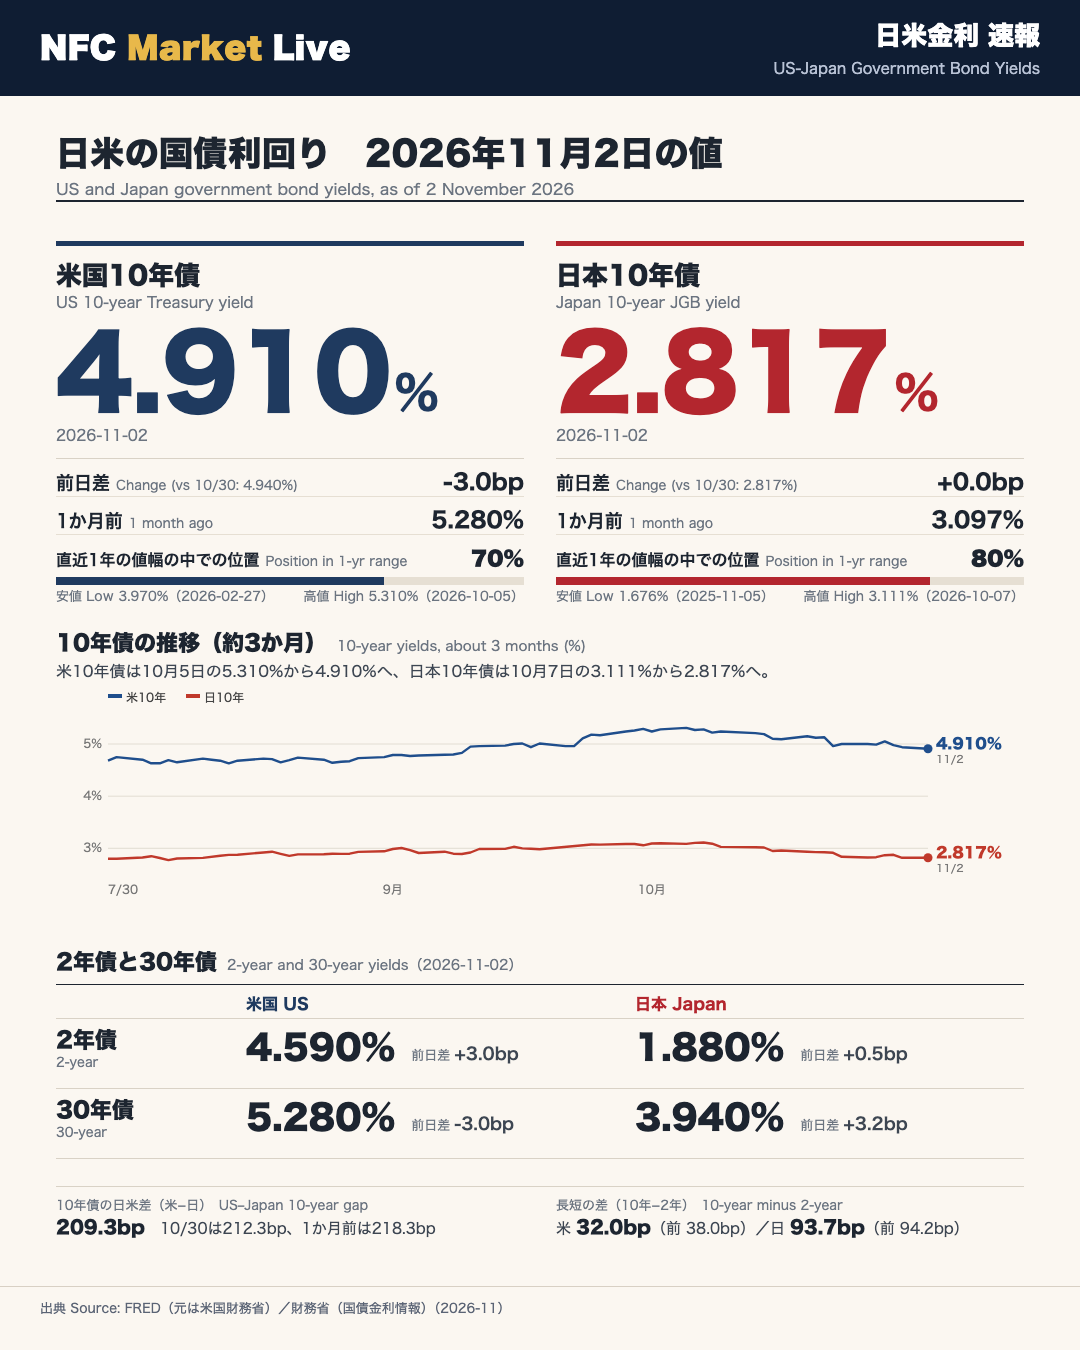
Headline 10-year yields: the US 10-year stands at 4.910% (4.940% on Oct 30; 5.280% a month earlier), sitting at 70% of its 1-year range (0% = low, 100% = high). The Japan 10-year stands at 2.817%, unchanged from Oct 30 (3.097% a month earlier), at 80% of its 1-year range.
2-year: US 4.590% (+3.0bp on the day, 79% of range); Japan 1.880% (+0.5bp, 90% of range).
30-year: US 5.280% (-3.0bp, 62% of range); Japan 3.940% (+3.2bp, 79% of range).
Side notes: the US-minus-Japan 10-year gap is 209.3bp (212.3bp on Oct 30). The 10-year minus 2-year spread is 32.0bp in the US (38.0bp previously) and 93.7bp in Japan (94.2bp previously).
Sources: US yields from FRED (originally US Treasury data); Japanese yields from the Ministry of Finance, Japan.
10年債の水準:米国4.910%・日本2.817%
10-Year Yields: US 4.910%, Japan 2.817% (as of Nov 2, 2026)
The headline numbers of this report are the 10-year government bond yields of the United States and Japan. All figures are for November 2, 2026; “previous business day” means October 30, 2026.
| US 10-year | Japan 10-year | |
|---|---|---|
| Level (2026-11-02) | 4.910% | 2.817% |
| Previous day (2026-10-30) | 4.940% | 2.817% |
| Daily change | -3.0bp | +0.0bp |
| One month earlier | 5.280% | 3.097% |
| 1-year high | 5.310% (2026-10-05) | 3.111% (2026-10-07) |
| 1-year low | 3.970% (2026-02-27) | 1.676% (2025-11-05) |
| Position in 1-year range | 70% | 80% |
How to read the table
- US 10-year: it moved from 4.940% to 4.910%, a daily change of -3.0bp. It is below the 5.280% recorded one month earlier.
- Japan 10-year: it was unchanged at 2.817%, so the daily change is +0.0bp. It is below the 3.097% recorded one month earlier.
- Position in range: 0% is the lowest yield of the past year and 100% is the highest. The US stands at 70% and Japan at 80%, so both sit in the upper part of their 1-year ranges.
- One basis point (bp) is 0.01 percentage point.
Recent path in the daily data
The US 10-year touched its 1-year high of 5.310% on October 5 and was at 4.940% on October 30. The Japan 10-year reached its 1-year high of 3.111% on October 7 and was at 2.817% on October 30.
Data sources
US yields come from FRED, the database run by the Federal Reserve Bank of St. Louis, which republishes figures originally released by the US Treasury. Japanese yields come from the Ministry of Finance’s JGB interest rate data.
2年債と30年債の水準と前日差
2-Year and 30-Year Yields (as of Nov 2, 2026)
Below the headline 10-year yields, here are the shorter (2-year) and longer (30-year) maturities. Daily changes compare with October 30, 2026.
2-year
| US 2-year | Japan 2-year | |
|---|---|---|
| Level (2026-11-02) | 4.590% | 1.880% |
| Previous day (2026-10-30) | 4.560% | 1.875% |
| Daily change | +3.0bp | +0.5bp |
| One month earlier | 4.830% | 1.919% |
| 1-year high | 4.920% (2026-09-28) | 1.981% (2026-09-28) |
| 1-year low | 3.380% (2026-02-27) | 0.928% (2025-11-18) |
| Position in 1-year range | 79% | 90% |
30-year
| US 30-year | Japan 30-year | |
|---|---|---|
| Level (2026-11-02) | 5.280% | 3.940% |
| Previous day (2026-10-30) | 5.310% | 3.908% |
| Daily change | -3.0bp | +3.2bp |
| One month earlier | 5.630% | 4.148% |
| 1-year high | 5.670% (2026-10-07) | 4.168% (2026-10-06) |
| 1-year low | 4.640% (2025-11-26) | 3.101% (2025-11-05) |
| Position in 1-year range | 62% | 79% |
Observations
- Daily moves: 2-year yields rose in both countries (US +3.0bp, Japan +0.5bp). At the 30-year point the direction differed: the US fell 3.0bp while Japan rose 3.2bp.
- Position in range: Japan’s 2-year is highest at 90% of its 1-year range; the US 30-year is lowest at 62%. A reading of 0% marks the 1-year low and 100% the 1-year high.
- Versus one month ago: at all three maturities, both countries’ yields are below their levels of a month earlier.
Sources: FRED (originally US Treasury data) for the US; Ministry of Finance, Japan for JGBs.
補足:10年債の日米差と長短の差
Side Notes: US-Japan 10-Year Gap and Curve Spreads
These are supporting figures for the levels shown earlier, not the main focus of this report.
10-year gap (US minus Japan, on days when both are available)
| Date | Gap |
|---|---|
| 2026-11-02 | 209.3bp |
| 2026-10-30 | 212.3bp (-3.0bp versus that day) |
| One month earlier | 218.3bp |
Curve spread (10-year minus 2-year)
| 2026-11-02 | Previous (2026-10-30) | |
|---|---|---|
| United States | 32.0bp | 38.0bp |
| Japan | 93.7bp | 94.2bp |
A note on dates
- In the source table, US and Japanese observations do not always fall on the same dates. For example, Japan has no values for September 21-23 while US values exist.
- The figures in this report compare November 2, 2026 with the previous business day, October 30, 2026, for both countries.
Sources
US 2-, 10- and 30-year yields are from FRED, the Federal Reserve Bank of St. Louis database that republishes US Treasury data. Japanese yields are from the Ministry of Finance’s JGB interest rate information.
Disclaimer: This article is for informational purposes only. All investment decisions are made solely at your own risk.