This article was automatically generated by the NFC Market Live AI analysis system. (Updated: 2026-11-11 09:38 JST)
A quick look at US and Japanese government bond yields. US Treasury yields come from FRED (St. Louis Fed, sourced from the US Treasury) as of Nov 9, 2026; Japanese government bond yields come from the Ministry of Finance as of Nov 10, 2026.
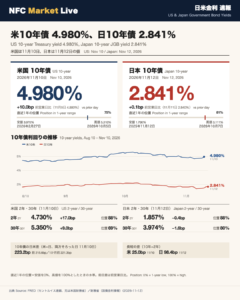
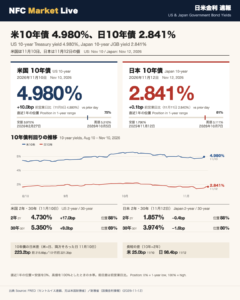
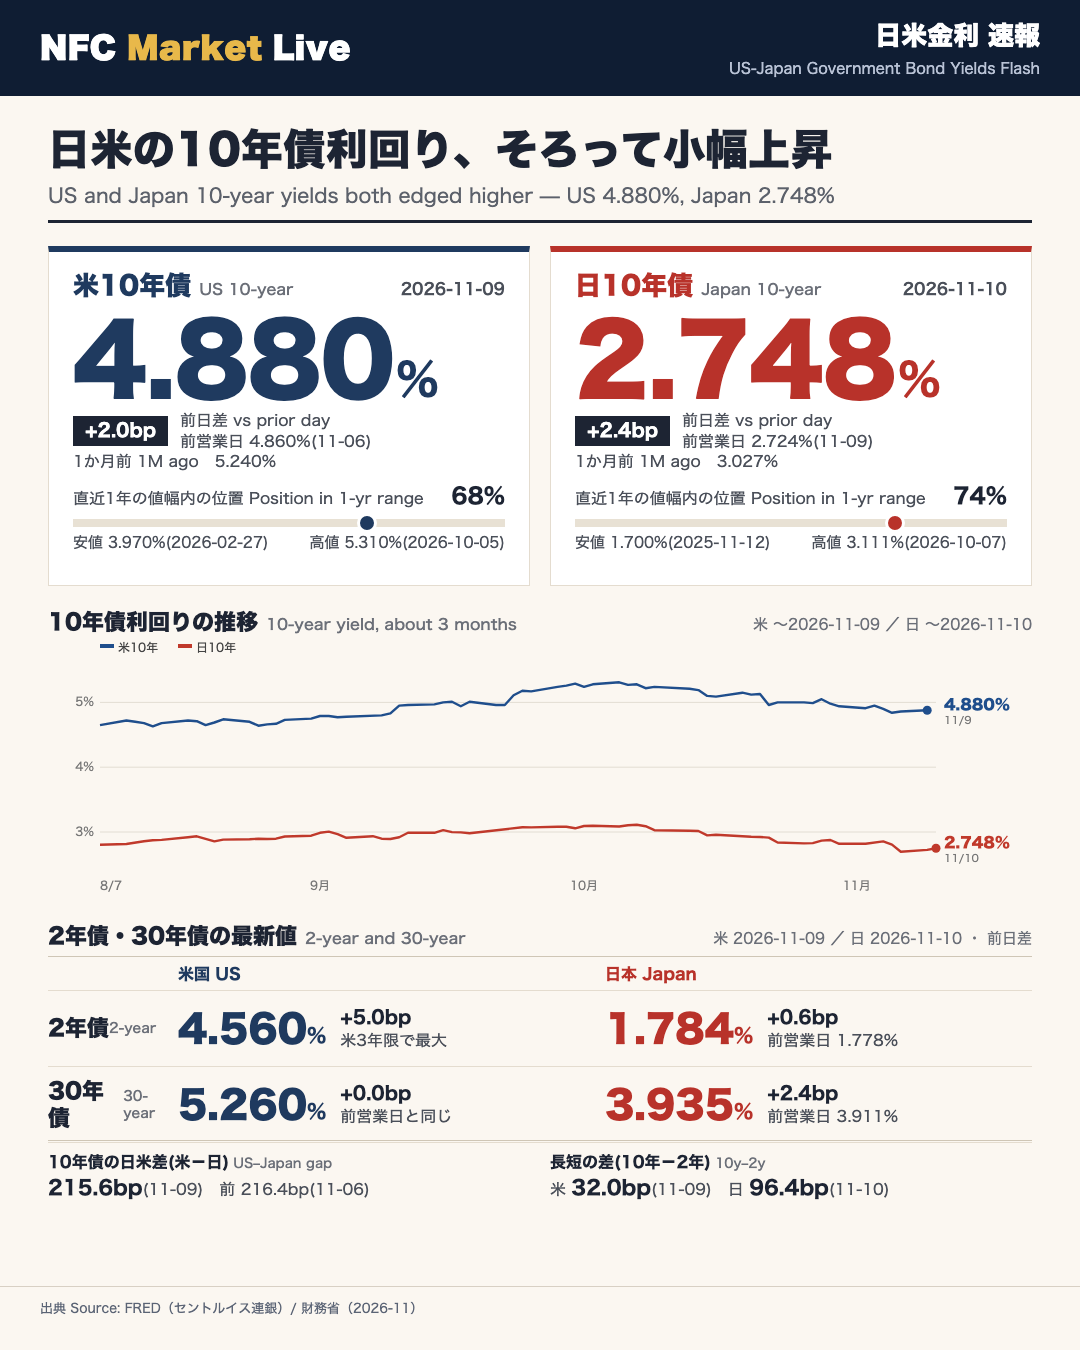
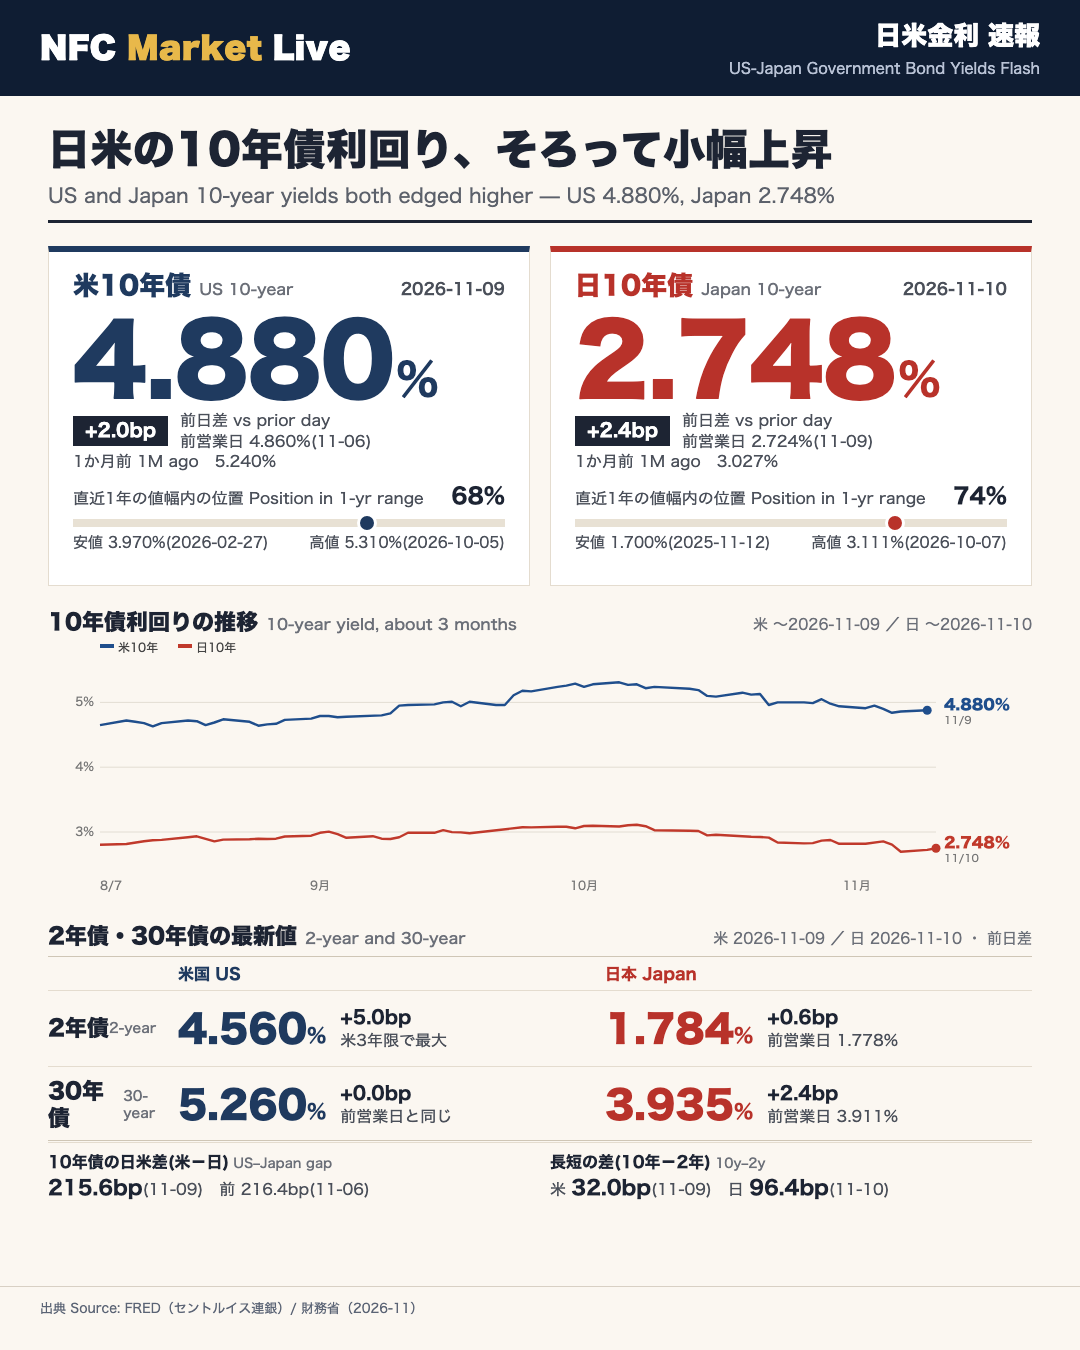
Ten-year yields (the main focus): the US 10-year stood at 4.880%, +2.0bp on the day (4.860% on Nov 6), at 68% of its one-year range. The Japan 10-year stood at 2.748%, +2.4bp (2.724% on Nov 9), at 74% of its one-year range.
Two- and 30-year: US 2-year 4.560% (+5.0bp, 77%) and US 30-year 5.260% (+0.0bp, 60%). Japan 2-year 1.784% (+0.6bp, 81%) and Japan 30-year 3.935% (+2.4bp, 77%).
Side notes: the US-minus-Japan 10-year gap was 215.6bp on Nov 9 (216.4bp previously). The 10-year minus 2-year spread was 32.0bp in the US (Nov 9) and 96.4bp in Japan (Nov 10). Range position: 0% is the one-year low, 100% the high.
10年債:日米それぞれの水準
US and Japan 10-Year Yields (Main Focus)
The latest US figure is for Nov 9, 2026, and the latest Japan figure is for Nov 10, 2026. US yields come from FRED (series DGS10, run by the St. Louis Fed), which republishes data from the US Treasury. Japanese yields come from the Ministry of Finance (MOF) Japan’s government bond yield data. Each number carries its own date because the two countries’ latest dates differ by one day.
| Item | US 10-yr | Japan 10-yr |
|---|---|---|
| As of | Nov 9 | Nov 10 |
| Level | 4.880% | 2.748% |
| Prior business day | 4.860% (Nov 6) | 2.724% (Nov 9) |
| Daily change | +2.0bp | +2.4bp |
| One month ago | 5.240% | 3.027% |
| 1-yr high | 5.310% (Oct 5, 2026) | 3.111% (Oct 7, 2026) |
| 1-yr low | 3.970% (Feb 27, 2026) | 1.700% (Nov 12, 2025) |
| Position in 1-yr range | 68% | 74% |
Key facts
- The US 10-year yield was 4.880%, up 2.0bp on the day.
- The Japan 10-year yield was 2.748%, up 2.4bp on the day.
- Range position puts the one-year low at 0% and the high at 100%: 68% for the US and 74% for Japan.
Recent daily readings
Japan: 2.855% (Nov 4), 2.806% (Nov 5), 2.696% (Nov 6), 2.724% (Nov 9), 2.748% (Nov 10). US: 4.90% (Nov 4), 4.84% (Nov 5), 4.86% (Nov 6), 4.88% (Nov 9).
2年債と30年債の水準
Two-Year and 30-Year Yields
These are the shorter (2-year) and longer (30-year) maturities that sit below the 10-year in the chart. The US date is Nov 9, 2026, and the Japan date is Nov 10, 2026.
2-year
| Item | US 2-yr | Japan 2-yr |
|---|---|---|
| As of | Nov 9 | Nov 10 |
| Level | 4.560% | 1.784% |
| Daily change | +5.0bp | +0.6bp |
| Prior business day | 4.510% (Nov 6) | 1.778% (Nov 9) |
| One month ago | 4.800% | 1.911% |
| 1-yr high | 4.920% (Sep 28, 2026) | 1.981% (Sep 28, 2026) |
| 1-yr low | 3.380% (Feb 27, 2026) | 0.928% (Nov 18, 2025) |
| Position in 1-yr range | 77% | 81% |
30-year
| Item | US 30-yr | Japan 30-yr |
|---|---|---|
| As of | Nov 9 | Nov 10 |
| Level | 5.260% | 3.935% |
| Daily change | +0.0bp | +2.4bp |
| Prior business day | 5.260% (Nov 6) | 3.911% (Nov 9) |
| One month ago | 5.600% | 4.085% |
| 1-yr high | 5.670% (Oct 7, 2026) | 4.168% (Oct 6, 2026) |
| 1-yr low | 4.640% (Nov 26, 2025) | 3.141% (Nov 10, 2025) |
| Position in 1-yr range | 60% | 77% |
Key facts
- The US 2-year showed the largest daily change of the three US maturities, +5.0bp.
- The US 30-year was unchanged at 5.260%.
- In Japan, the 2-year rose 0.6bp and the 30-year rose 2.4bp.
補足:10年債の日米差と長短の差
Side Note: US-Japan Gap and Term Spreads
This section is supplementary, not the main focus. All figures are taken from the pre-computed numbers in the source material.
10-year gap (US minus Japan)
This gap is measured on days when both countries’ values are available. It was 215.6bp on Nov 9, 2026, versus 216.4bp on Nov 6 (a change of -0.8bp). One month earlier it was 221.3bp. The US value for Nov 10 is not yet available, so no gap is shown for that day.
Term spread (10-year minus 2-year)
This is the 10-year yield minus the 2-year yield, a gauge of the gap between longer and shorter maturities.
| Item | US | Japan |
|---|---|---|
| As of | Nov 9 | Nov 10 |
| Term spread | 32.0bp | 96.4bp |
| Previous | 35.0bp | 94.6bp |
Recent daily readings (%)
| Date | US 2y | US 10y | US 30y | JP 2y | JP 10y | JP 30y |
|---|---|---|---|---|---|---|
| Nov 4 | 4.58 | 4.90 | 5.28 | 1.891 | 2.855 | 3.979 |
| Nov 5 | 4.46 | 4.84 | 5.25 | 1.860 | 2.806 | 3.915 |
| Nov 6 | 4.51 | 4.86 | 5.26 | 1.732 | 2.696 | 3.898 |
| Nov 9 | 4.56 | 4.88 | 5.26 | 1.778 | 2.724 | 3.911 |
| Nov 10 | – | – | – | 1.784 | 2.748 | 3.935 |
US values for Nov 10 are not included in the source data.
Disclaimer: This article is for informational purposes only. All investment decisions are made solely at your own risk.