📺 Watch the Full Video Analysis
This article was automatically generated by the NFC Market Live AI analysis system. (Updated: 2026-08-24 07:11 JST)
📊 This week’s global bond market shows a clear divergence: the US holds steady while Japan and Europe move sharply.
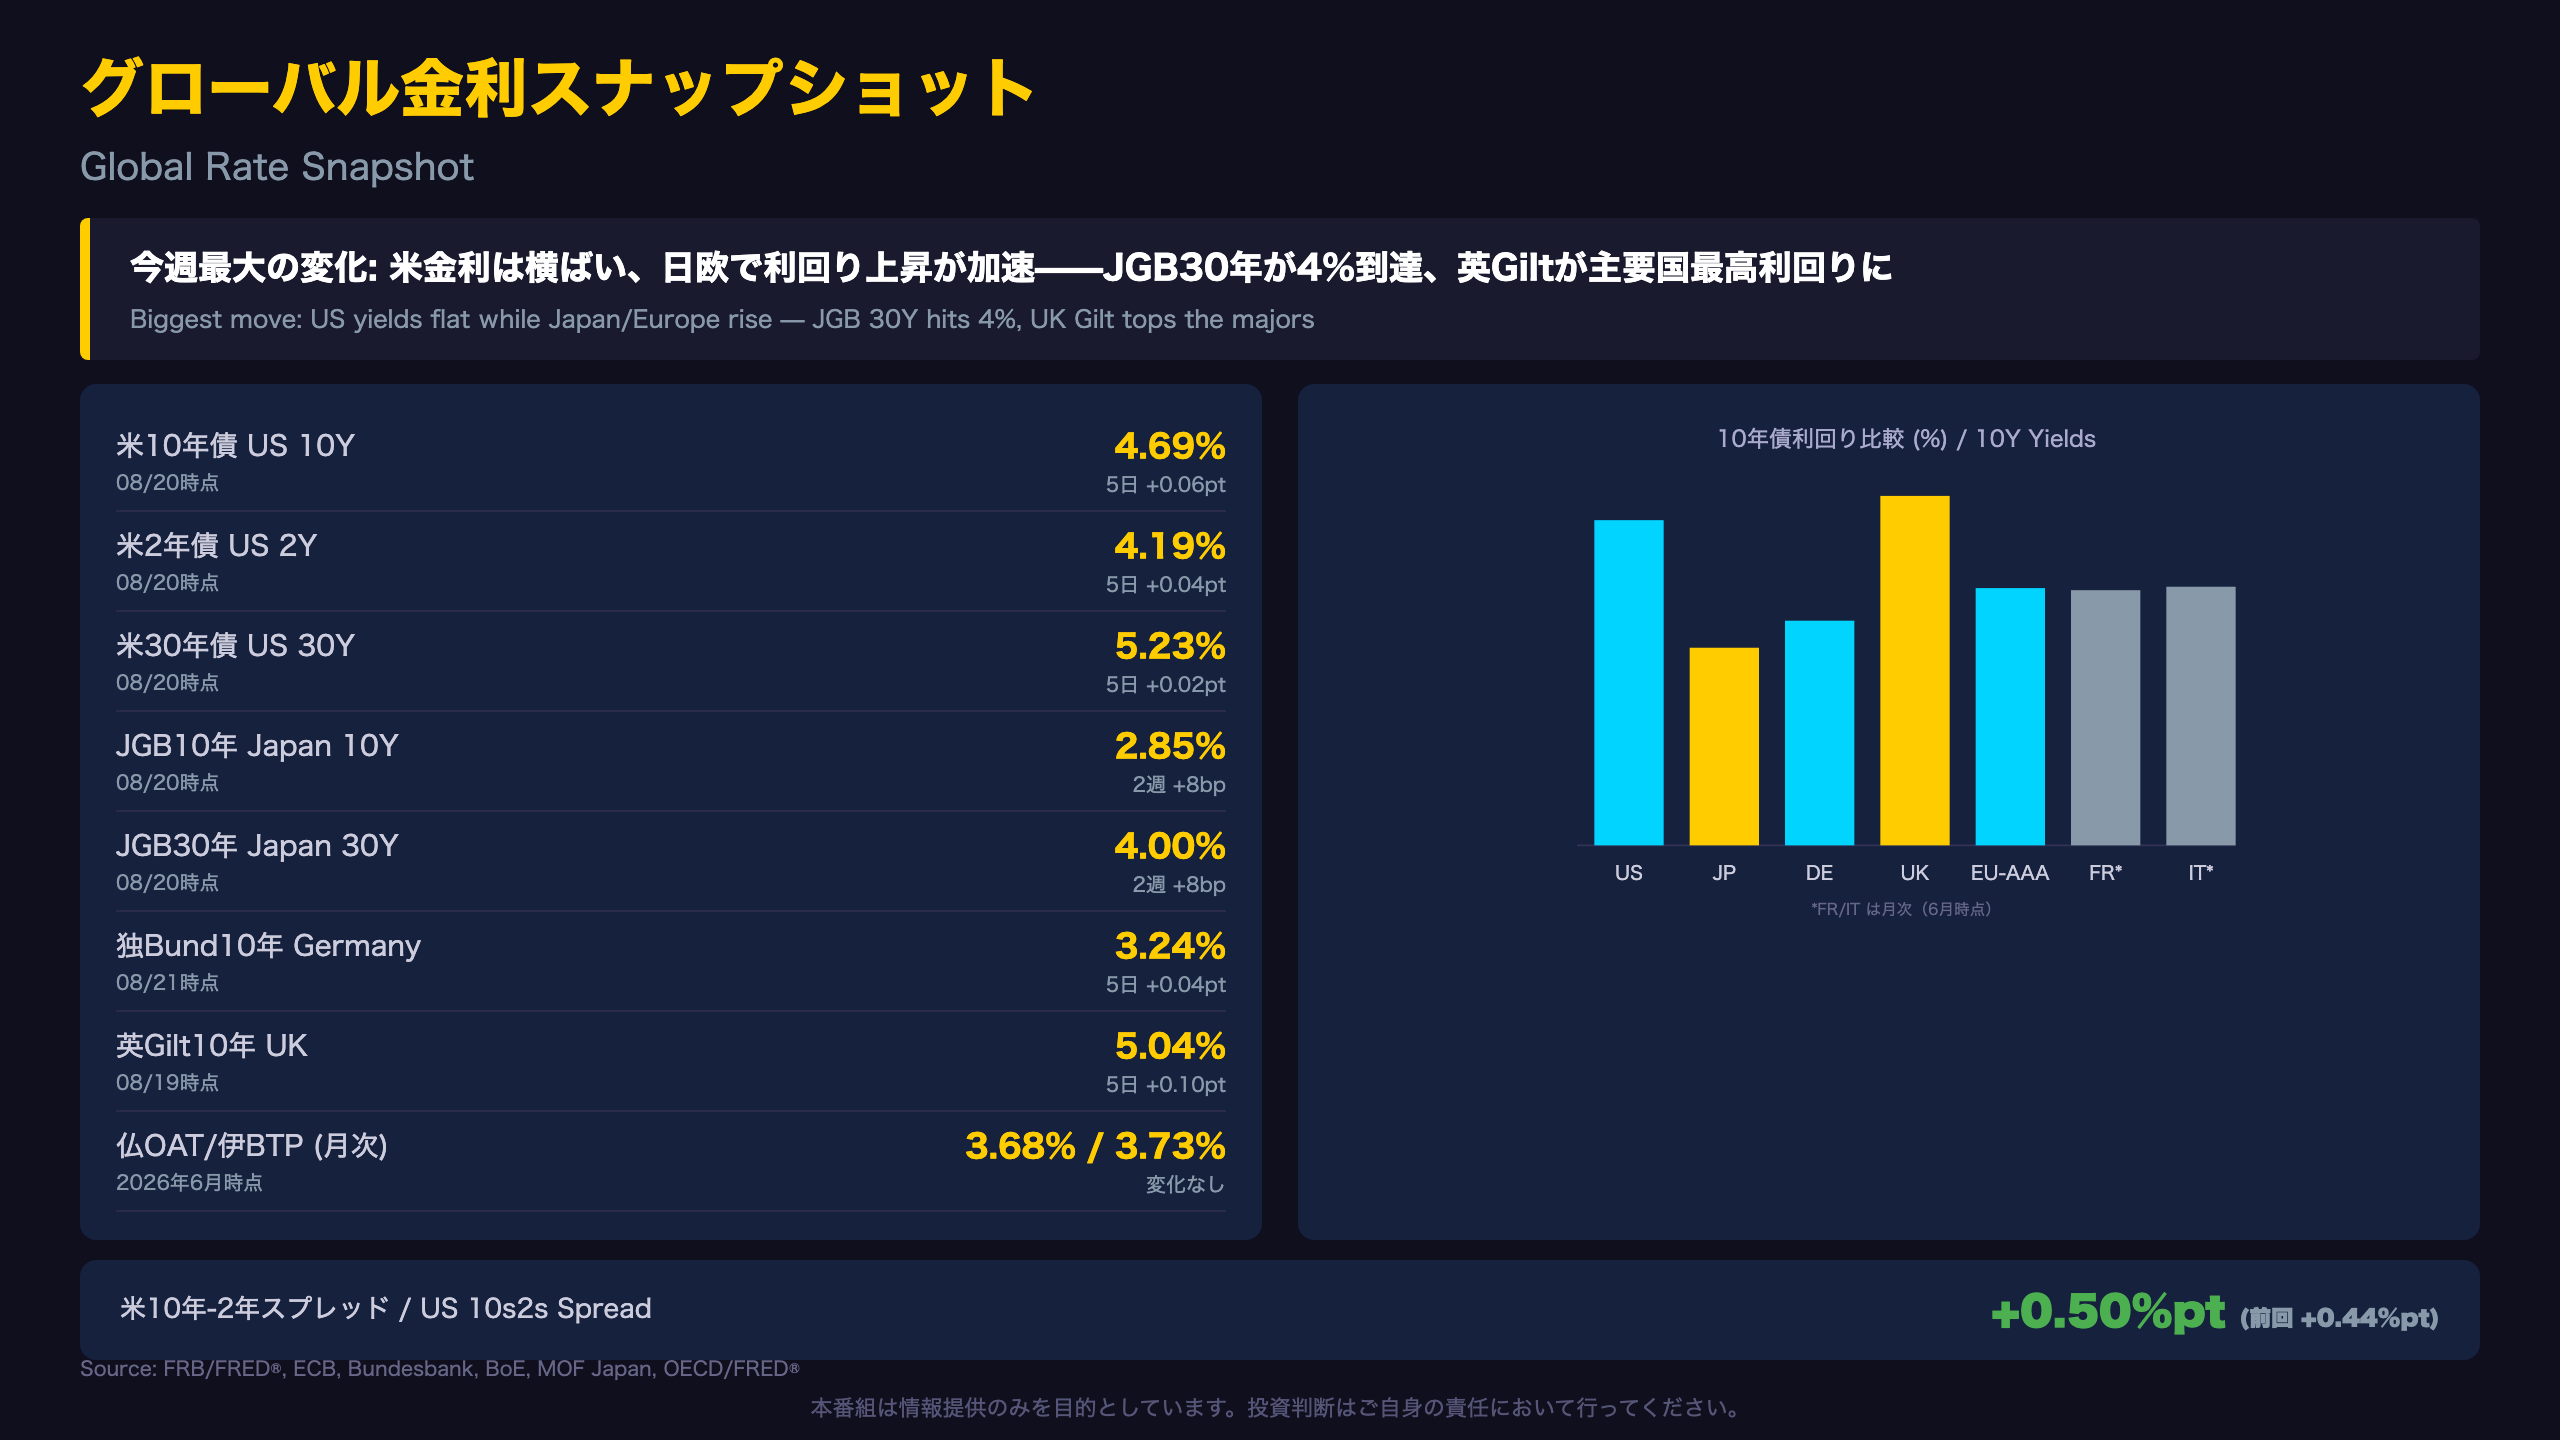
US 10Y yield is flat at 4.69%, but the 10s2s spread widened to +0.50pt on front-end steepening.
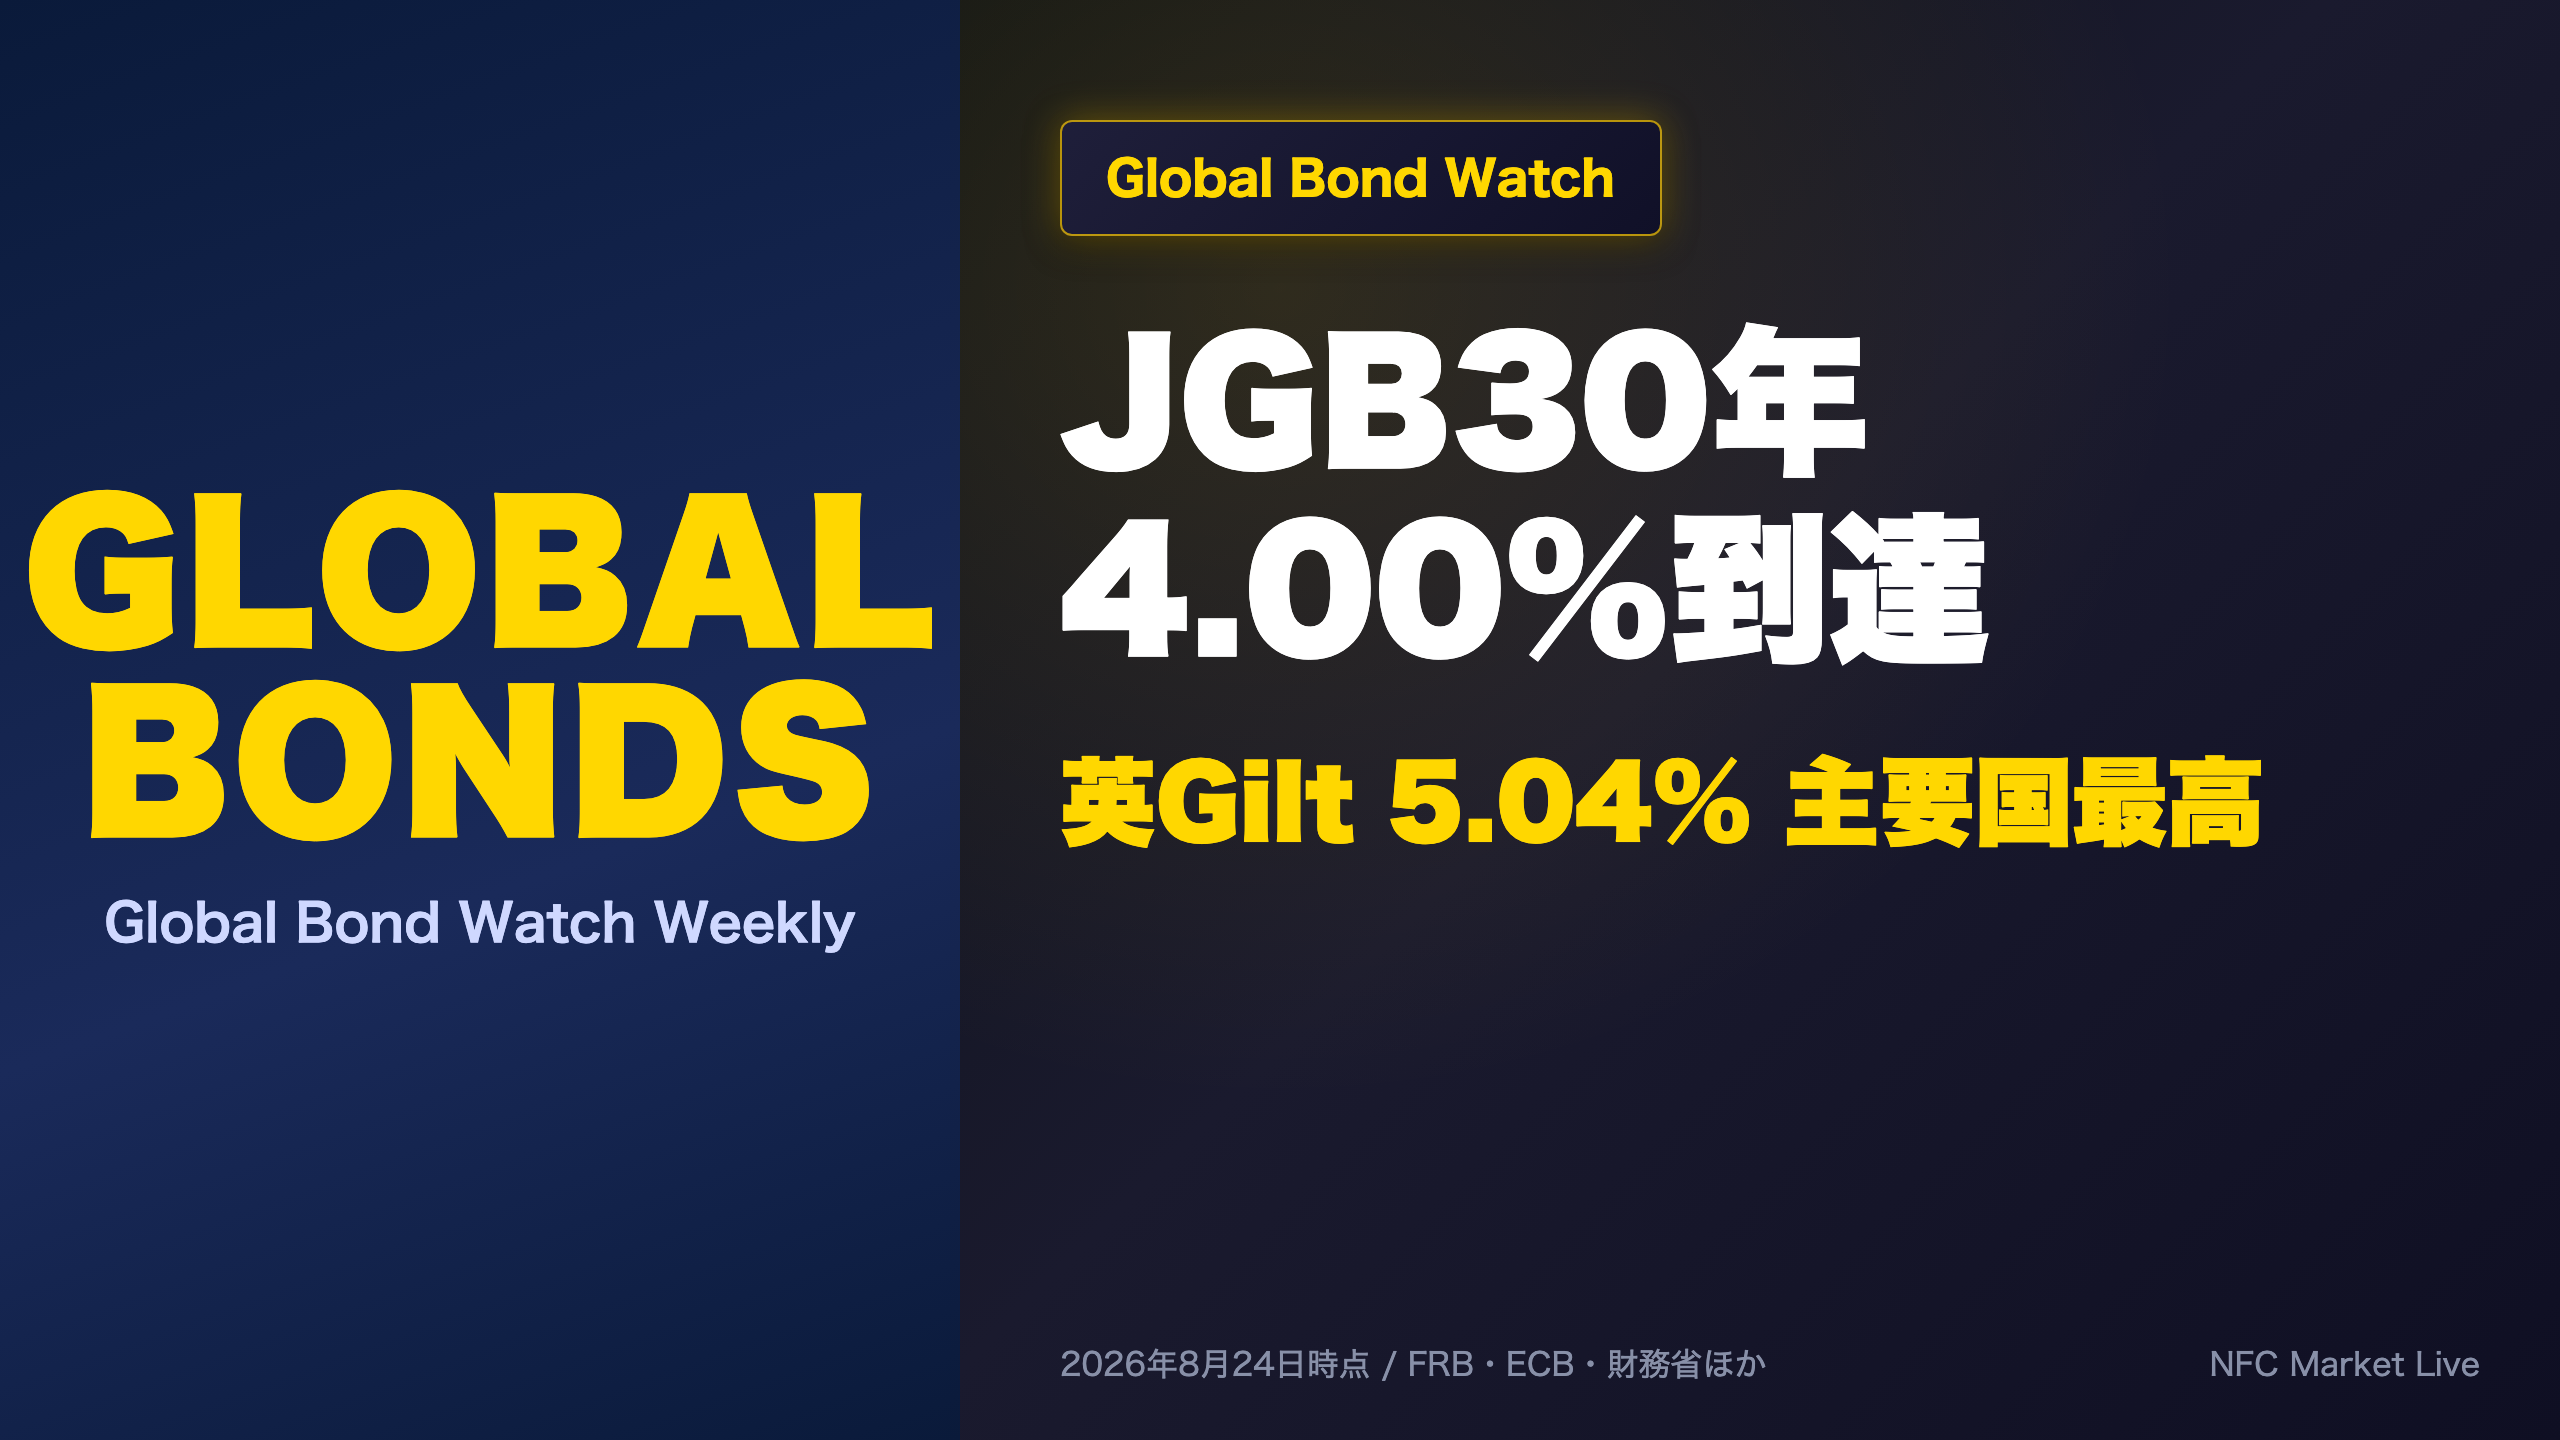
📈 Japan’s 30Y JGB crossed the key 4.00% level; UK 10Y Gilt jumped to 5.04%, the highest among major economies.
📉 JGB auctions show improving 5Y demand but softening 10Y demand with a wider tail.
💡 We break down what this means for USD/JPY and EUR/USD carry, cross-checked against NFC’s HMM regime models.
グローバル金利スナップショット / Global Rate Snapshot
The US Holds Steady While Japan and Europe Move
As of August 20, 2026, the US 10-year Treasury yield sat at 4.69%, essentially unchanged from the August 6 reading. But the 2-year yield fell from 4.25% to 4.19% over the same window, pushing the 10s2s term spread from +0.44 to +0.50 percentage points—a mild bull-steepening pattern typically associated with front-end rate-cut expectations outpacing long-end moves.
Japan and Europe tell a different story
- Japan (JGB) 30-year: 3.92% to 4.00% (+8bp), crossing a psychologically significant threshold.
- Germany (Bund) 10-year: 3.15% to 3.24% (+9bp), per Deutsche Bundesbank daily data.
- UK (Gilt) 10-year: 4.88% to 5.04% (+16bp), with +10bp coming in just the last five trading sessions—the sharpest move among all core sovereign markets tracked here.
For readers unfamiliar with Gilts: they are the UK’s sovereign bond equivalent of US Treasuries, and a yield above 5% places the UK meaningfully above the US and Germany in this snapshot.
Two readings
One interpretation is a broad global bond selloff. But since US yields are flat, a more precise reading is that country-specific drivers are doing the work in Japan and the UK, rather than a uniform global repricing. France and Italy data remain stuck at June levels (monthly OECD series), so whether they follow Germany higher is the key thing to watch next.
米国債入札 Deep Dive / US Treasury Auction
Bills Stay Rock-Solid, Long Bonds Slightly Softer
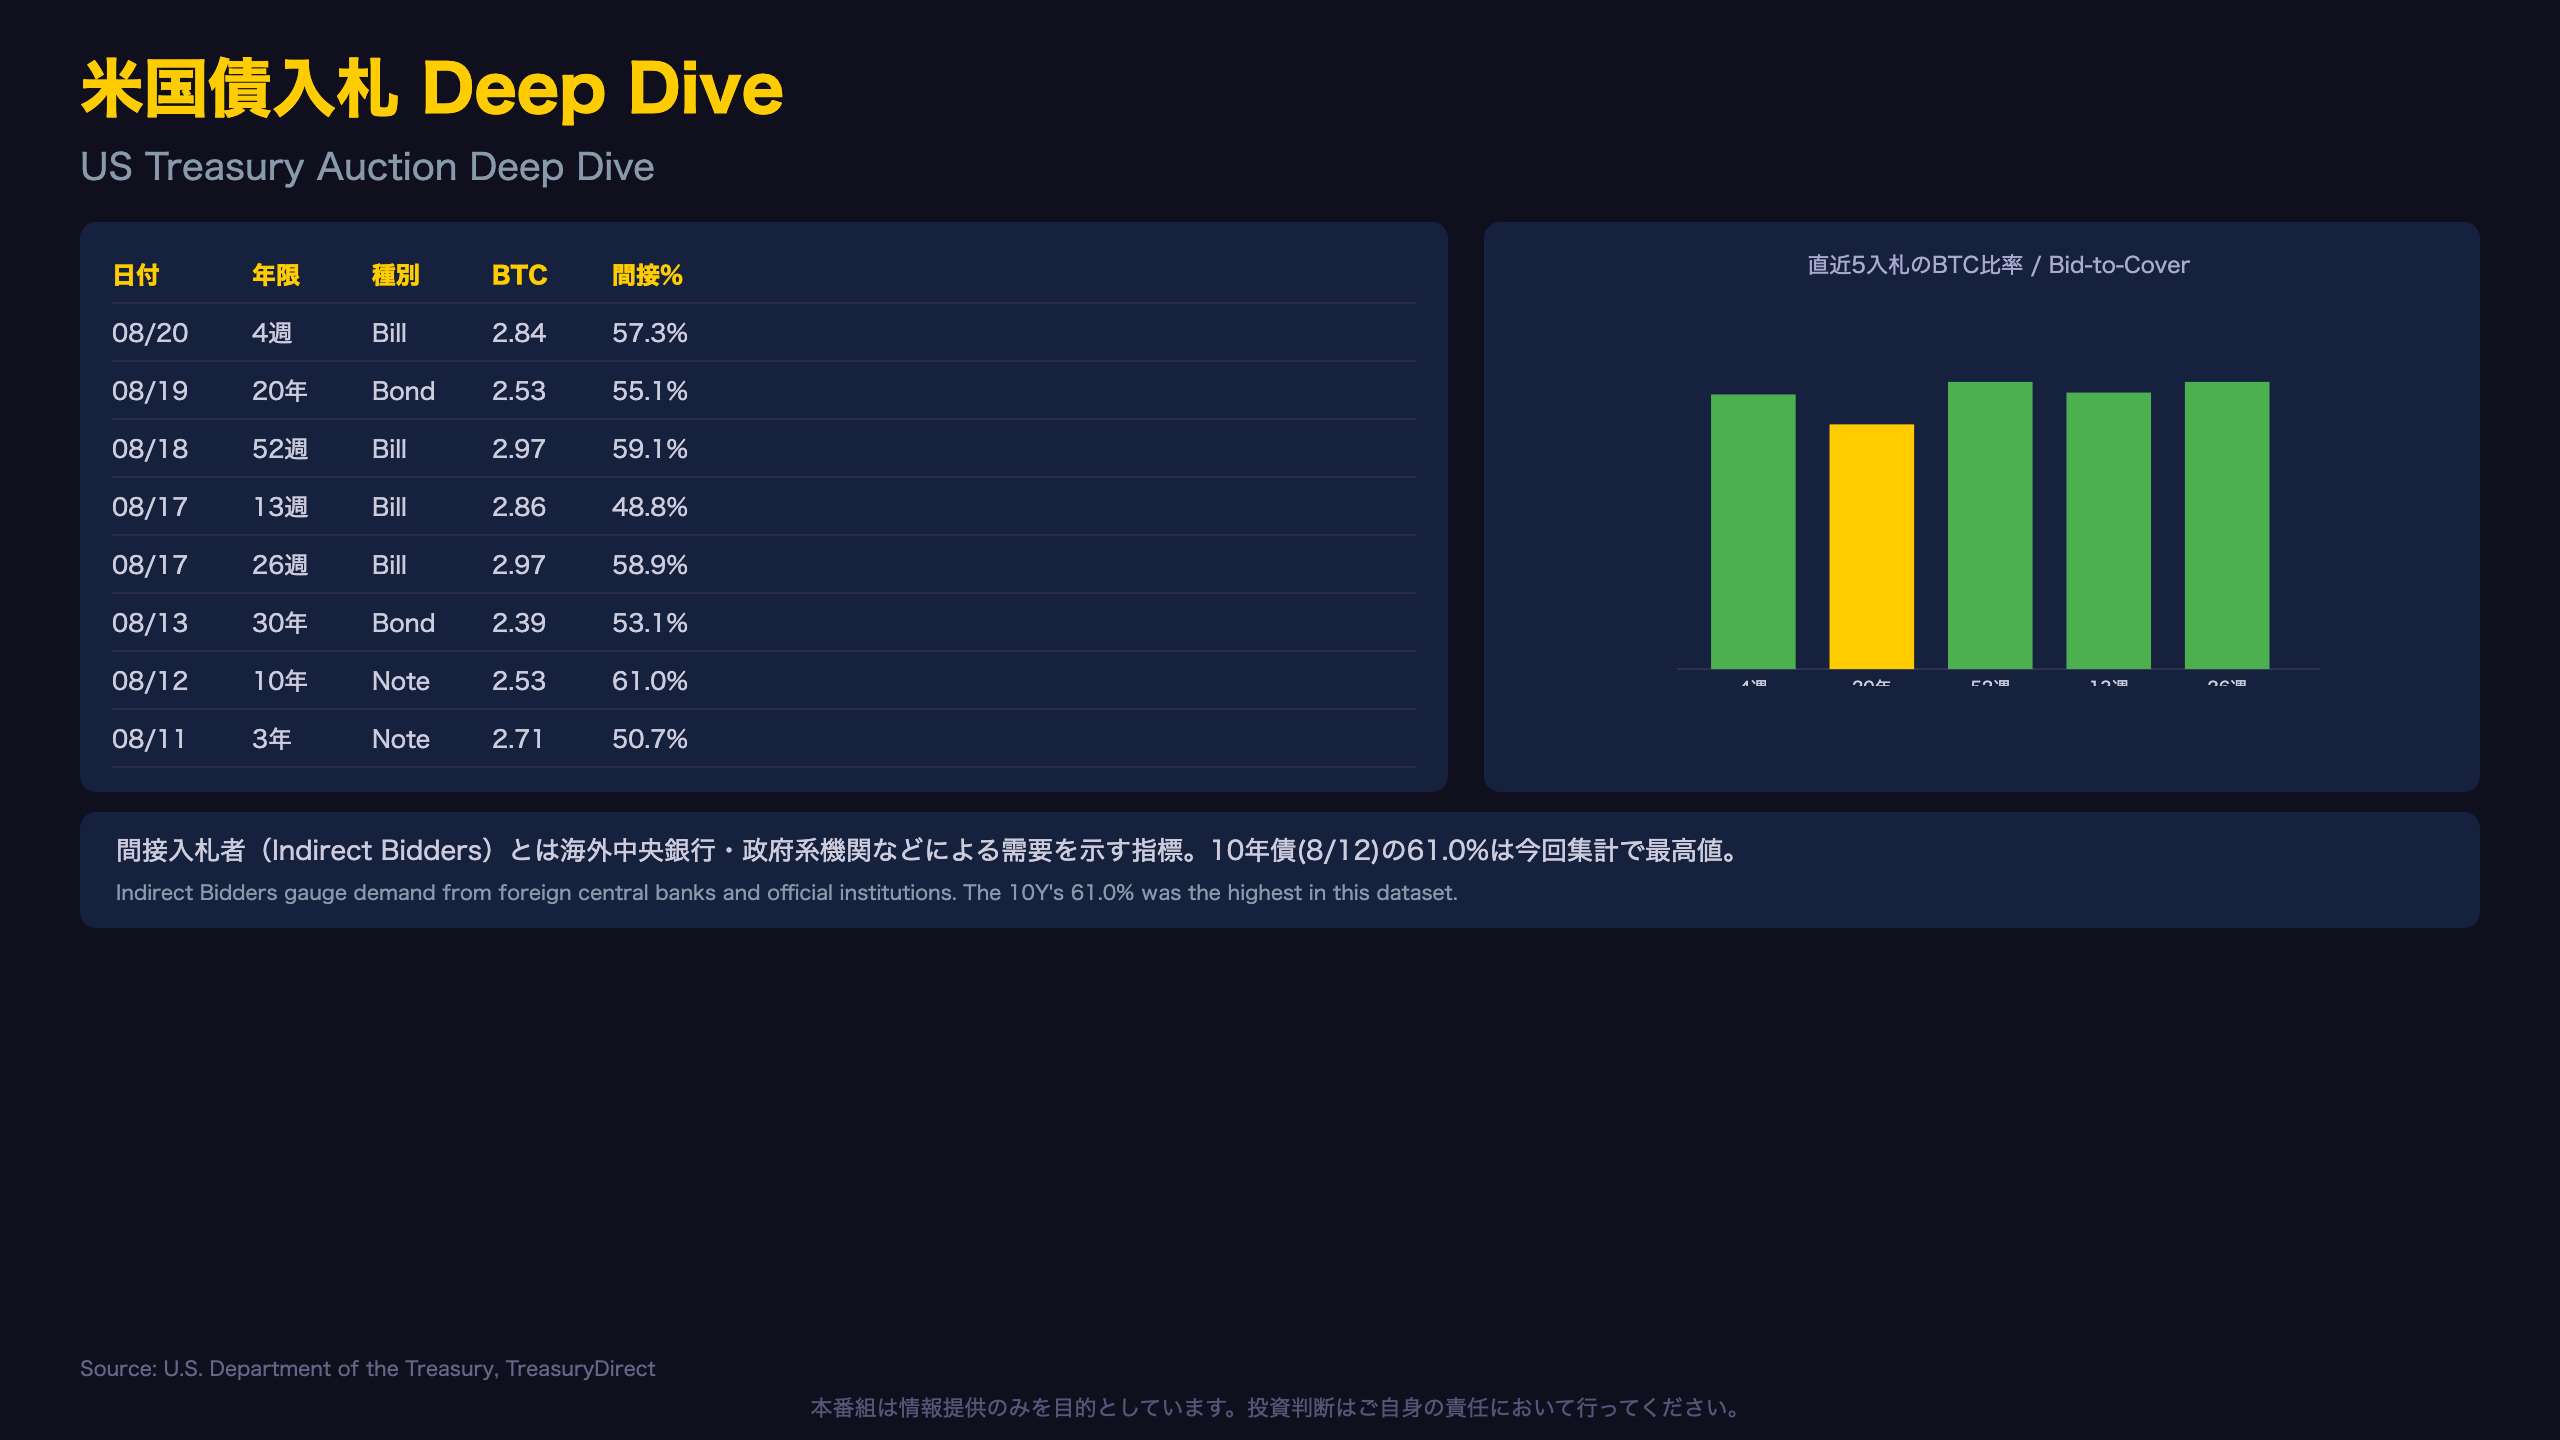
Across the 12 nominal auctions in the past three weeks, Treasury bills (4-week, 13-week, 26-week, 52-week) consistently posted bid-to-cover ratios in the 2.7-to-3.0x range—a sign that short-term demand remains structurally strong, likely reflecting the bills’ near-zero duration risk in a still-elevated rate environment.
Comparing long-duration demand
| Tenor | Auction Date | Bid-to-Cover | Indirect Bidders |
|---|---|---|---|
| 20-Year | Aug 19 | 2.53x | 55.1% |
| 30-Year | Aug 13 | 2.39x | 53.1% |
| 10-Year | Aug 12 | 2.53x | 61.0% |
| 3-Year | Aug 11 | 2.71x | 50.7% |
The 20-year auction showed a modest improvement over the prior 30-year sale in both metrics, though the two tenors aren’t perfectly comparable given differing duration profiles. Notably, the 10-year note drew 61.0% indirect bidder participation—the highest in this sample—suggesting foreign central banks and official institutions (a key gauge of overseas demand for Treasuries) remain engaged.
What this means for fiscal sustainability
Long bonds continuing to show lower cover ratios than bills isn’t new, but it remains a structural point of attention as US fiscal deficits keep issuance elevated. The next 10-year and 30-year auctions—and whether their tails widen or narrow—will be the next checkpoint for gauging investor appetite at the long end.
ヨーロッパ債券市場 / European Bond Markets
Rising Bunds Mechanically Narrow Peripheral Spreads
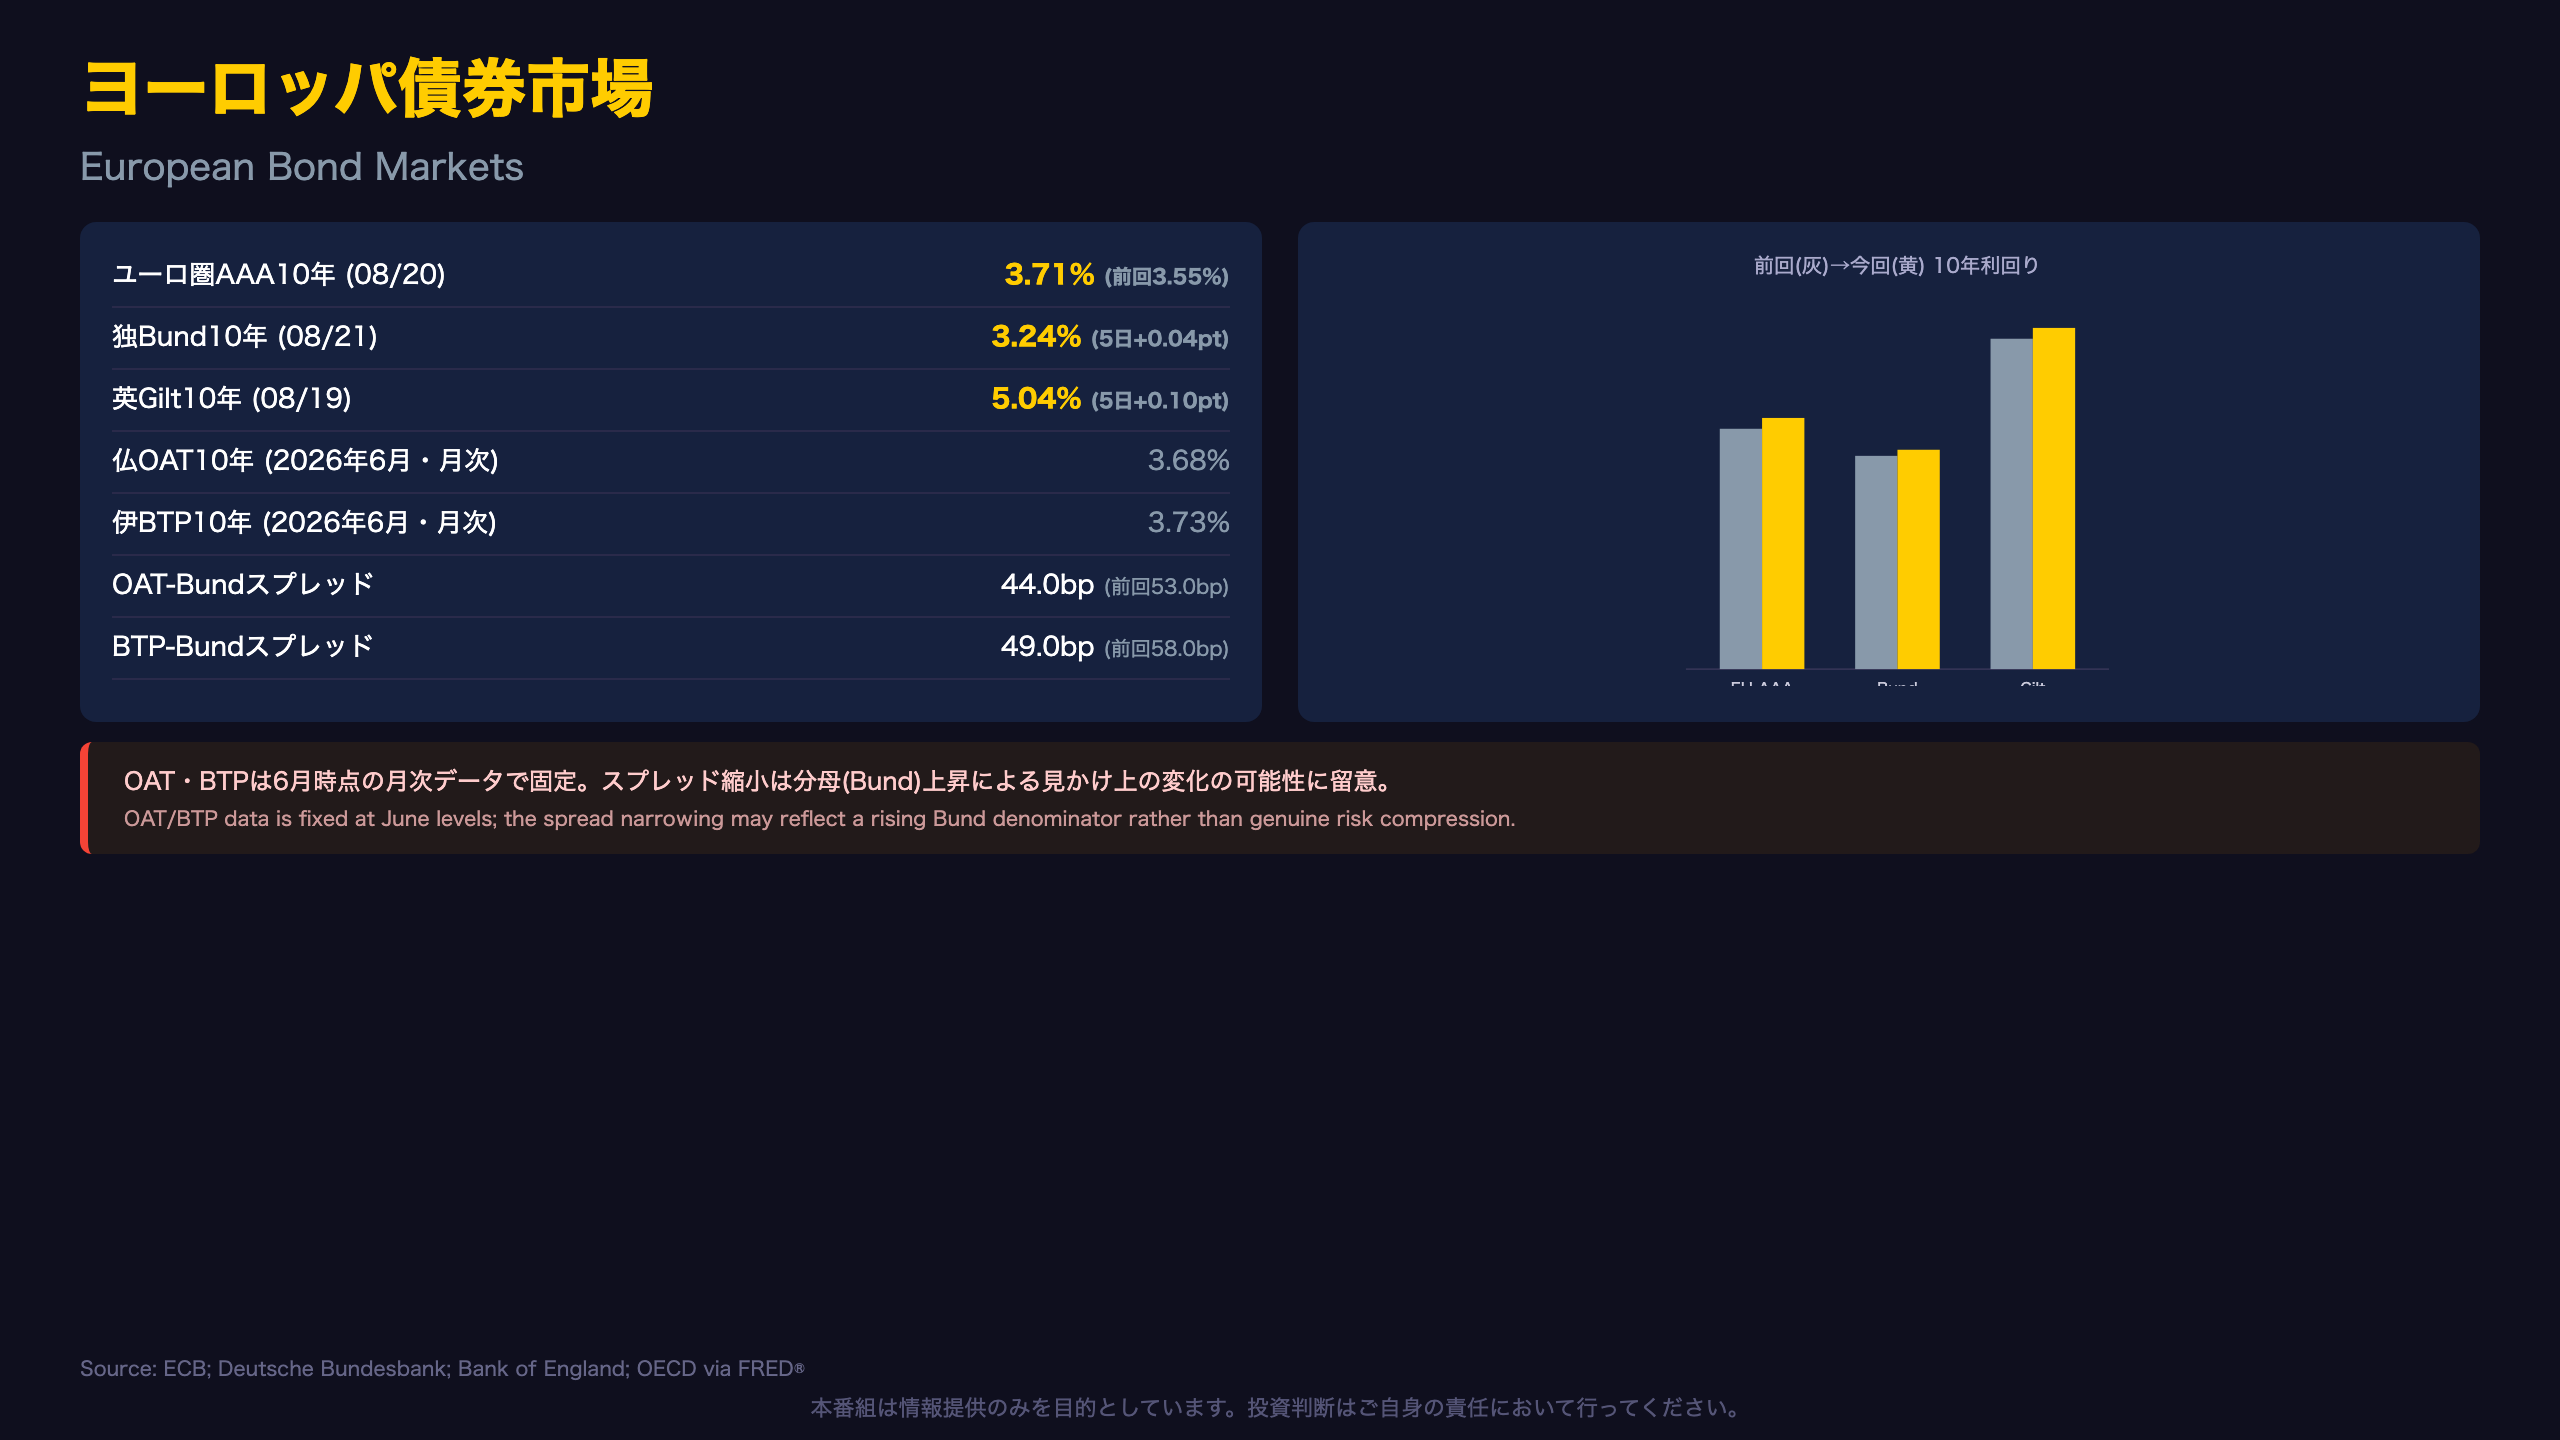
The clearest theme in this week’s European bond data is the rise in Germany’s 10-year Bund (3.15% to 3.24%, +9bp) and an even larger move in the UK’s 10-year Gilt (4.88% to 5.04%, +16bp), based on Bundesbank and Bank of England daily series respectively.
A caution on spread interpretation
The OAT-Bund spread narrowed from 53bp to 44bp, and the BTP-Bund spread from 58bp to 49bp—both down 9bp. At face value this looks like compressing risk premia for France and Italy. But France’s OAT and Italy’s BTP yields come from a monthly OECD series still dated June 2026, meaning only the denominator (Bund) actually moved. The apparent narrowing is therefore likely a data-lag artifact rather than a genuine repricing of French or Italian sovereign risk.
As the source data explicitly notes, OAT and BTP figures are “reference values” pending a monthly update—so the true current spread level for this period remains unconfirmed.
Two ways to read it
- Bullish read: No major political or fiscal shocks have been reported in France or Italy, so a modest spread move wouldn’t be surprising if it were confirmed.
- Cautious read: Whether OAT and BTP truly held steady while Bund rose 9bp can’t be verified until the next monthly release.
For US and international investors, the OAT-Bund and BTP-Bund spreads are the eurozone’s rough equivalent of high-yield credit spreads—watched closely as gauges of political and fiscal risk, and by extension, of ECB policy credibility. The next OECD update (likely reflecting July data) will be the real test of whether peripheral risk is easing or the current reading is simply stale.
日本国債・日銀政策金利 / JGB & BOJ
Strong at the Short End, Mixed at the Long End
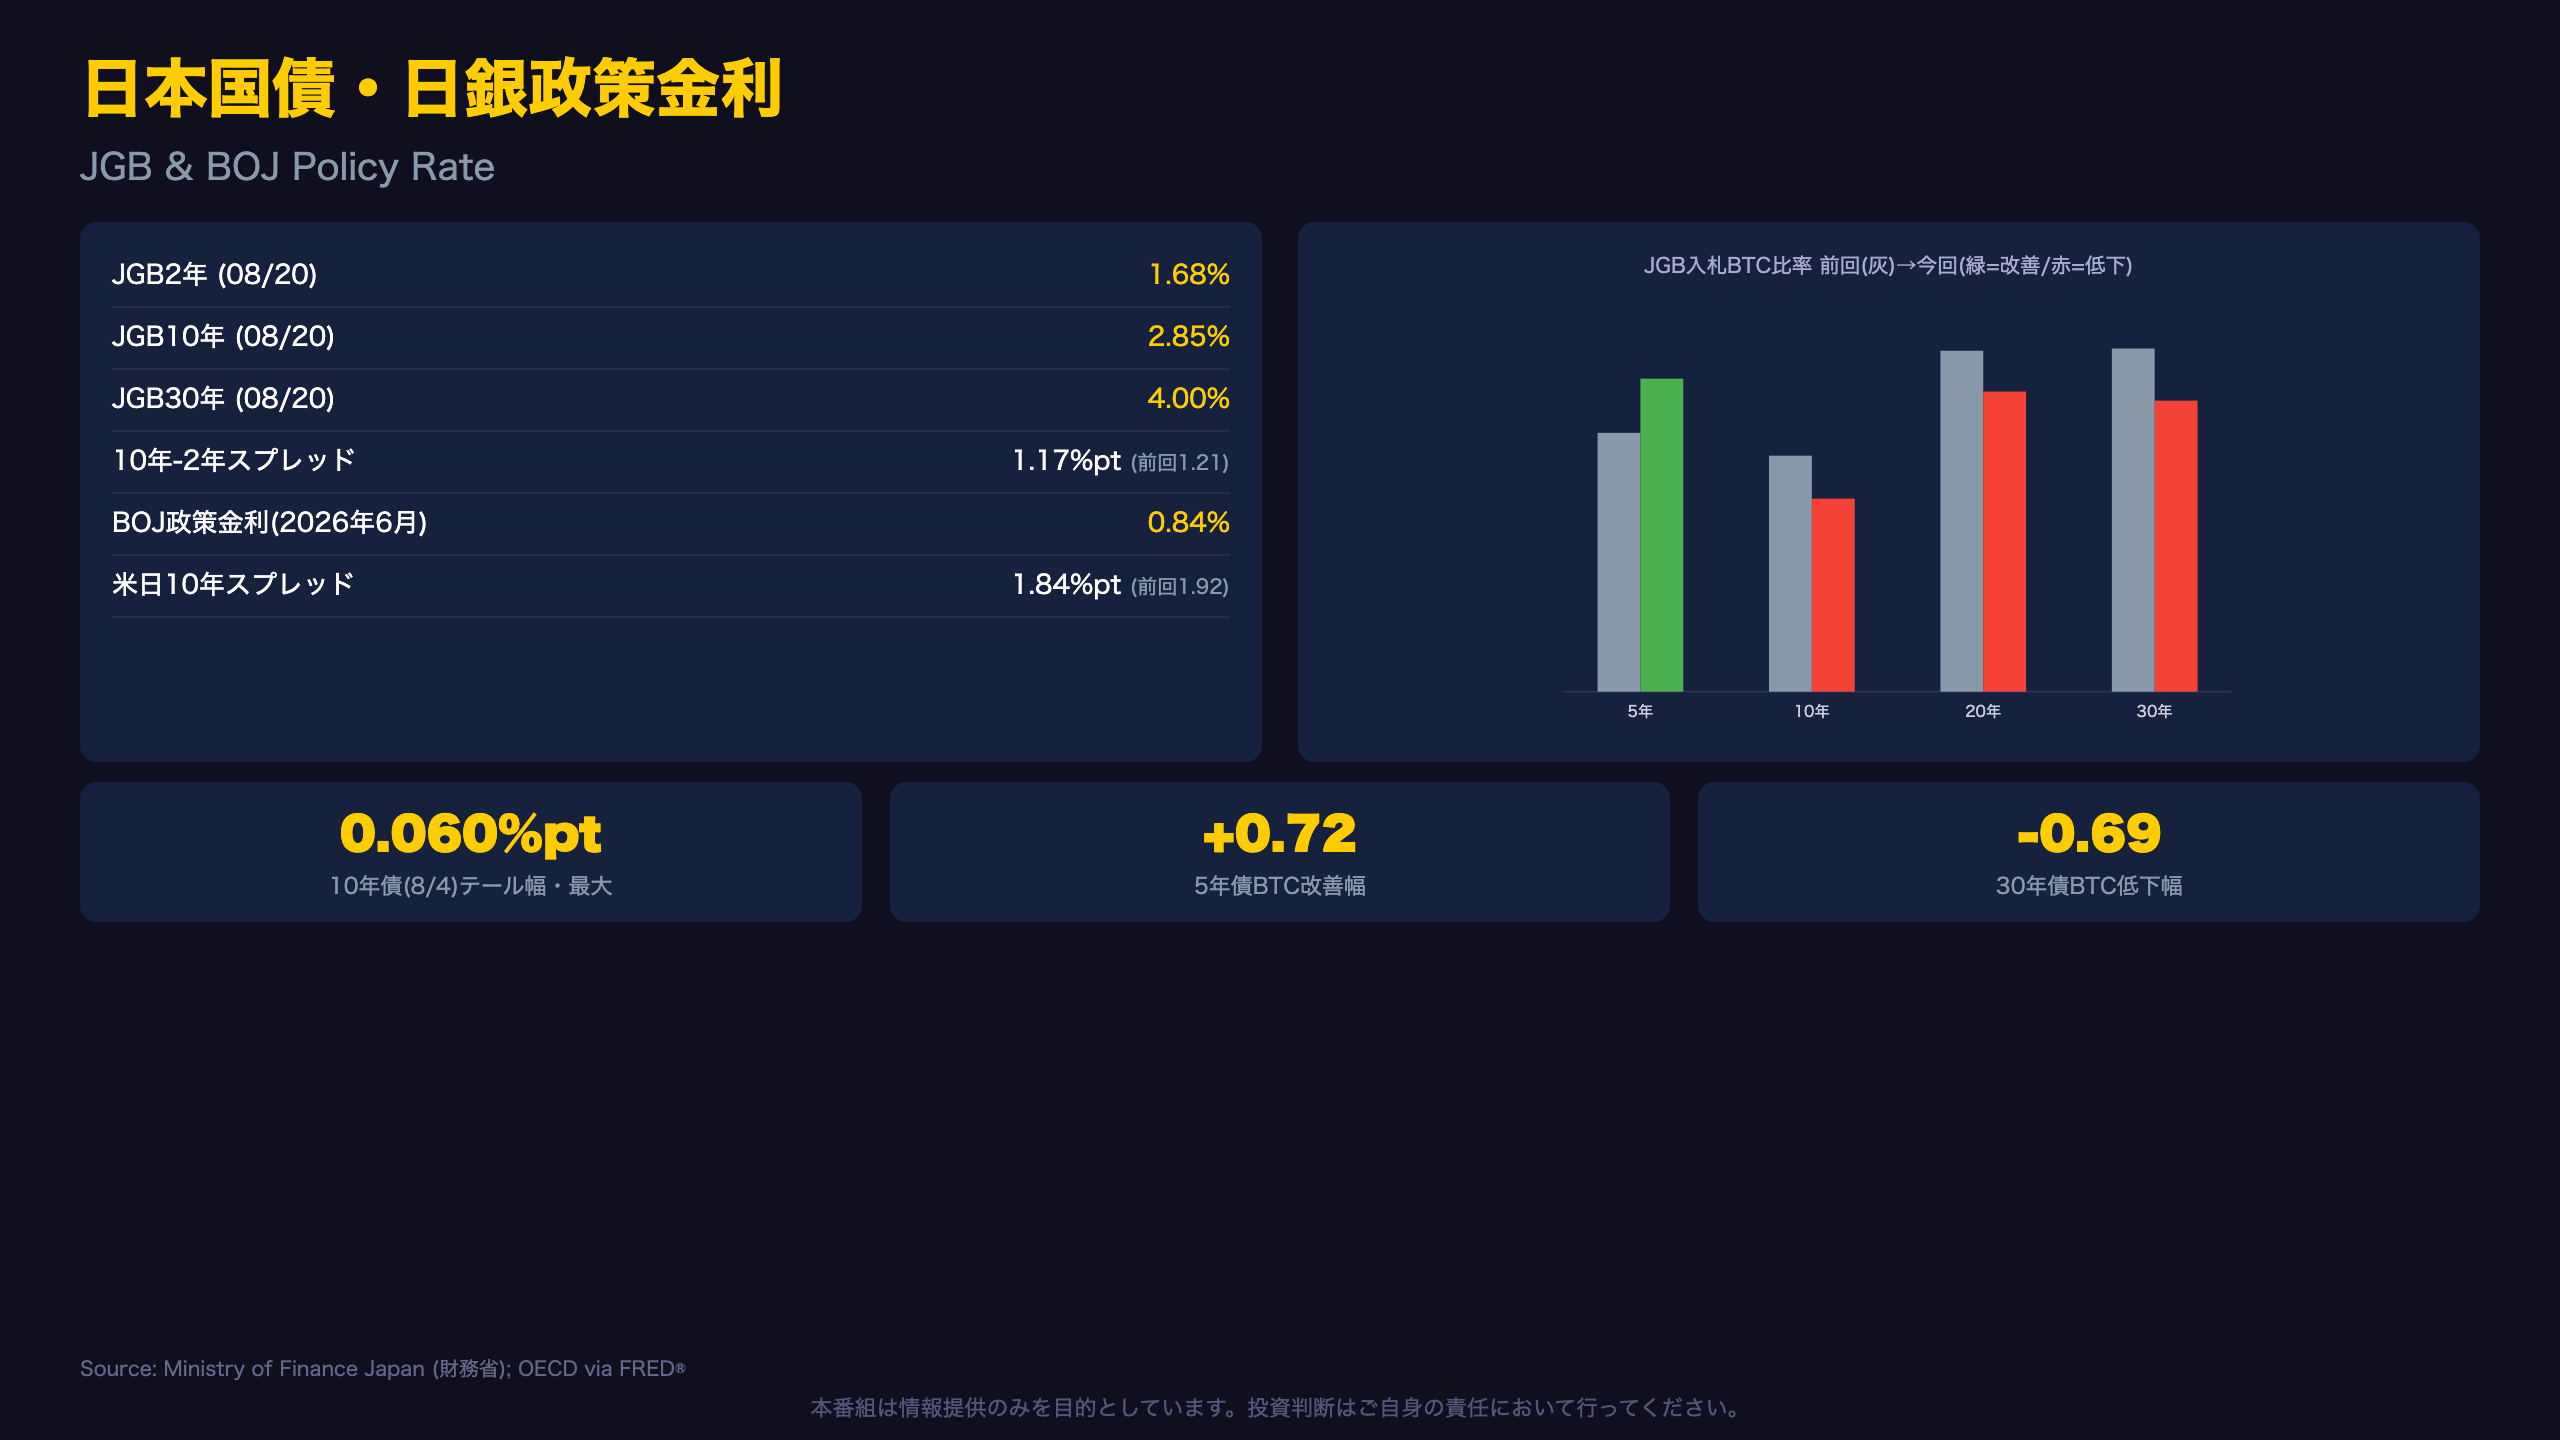
JGB yields rose across the curve over the two-week window, but the pace was front-loaded: 2-year +12bp, 10-year +8bp, 30-year +8bp. The 10s2s term spread—a key gauge markets use to assess the Bank of Japan’s rate-hike trajectory—narrowed slightly from 1.21 to 1.17 percentage points, consistent with the BOJ’s “Hawkish” regime classification persisting in NFC’s model.
Auction demand by tenor (bid-to-cover)
| Tenor | Latest | Prior | Direction |
|---|---|---|---|
| 5-Year (8/18 vs 7/9) | 4.15 | 3.43 | Improved |
| 10-Year (8/4 vs 7/2) | 2.56 | 3.13 | Declined |
| 20-Year (8/20 vs 7/14) | 3.98 | 4.52 | Declined |
| 30-Year (8/6 vs 7/7) | 3.86 | 4.55 | Declined |
The 5-year auction stood out with a sharp improvement in demand, while the 10-, 20-, and 30-year all cooled versus their prior instances. The August 4th 10-year auction was the softest print, with an average accepted yield of 2.840% against a stop-out (highest accepted) yield of 2.900%—a 6-basis-point tail, the widest of the period and a sign of some dispersion in bidder conviction.
Policy rate and the carry trade angle
The BOJ’s policy rate remains at 0.84% (per OECD data through June 2026, monthly). For readers unfamiliar with Japan’s Tankan-adjacent policy framework: the BOJ has been on a gradual normalization path after years of ultra-low rates. The US-Japan 10-year spread—the core input for USD/JPY carry trades—narrowed from 1.92 to 1.84 percentage points as JGB yields rose faster than Treasuries, marginally eroding the rate advantage that has long supported carry positioning. Whether this dispersion in JGB auction demand persists into the next 10-, 20-, and 30-year sales will be the next data point to watch.
FX・CFDへの含意 / Trade Implications
Cross-Checking HMM Regimes Against the Rate Data
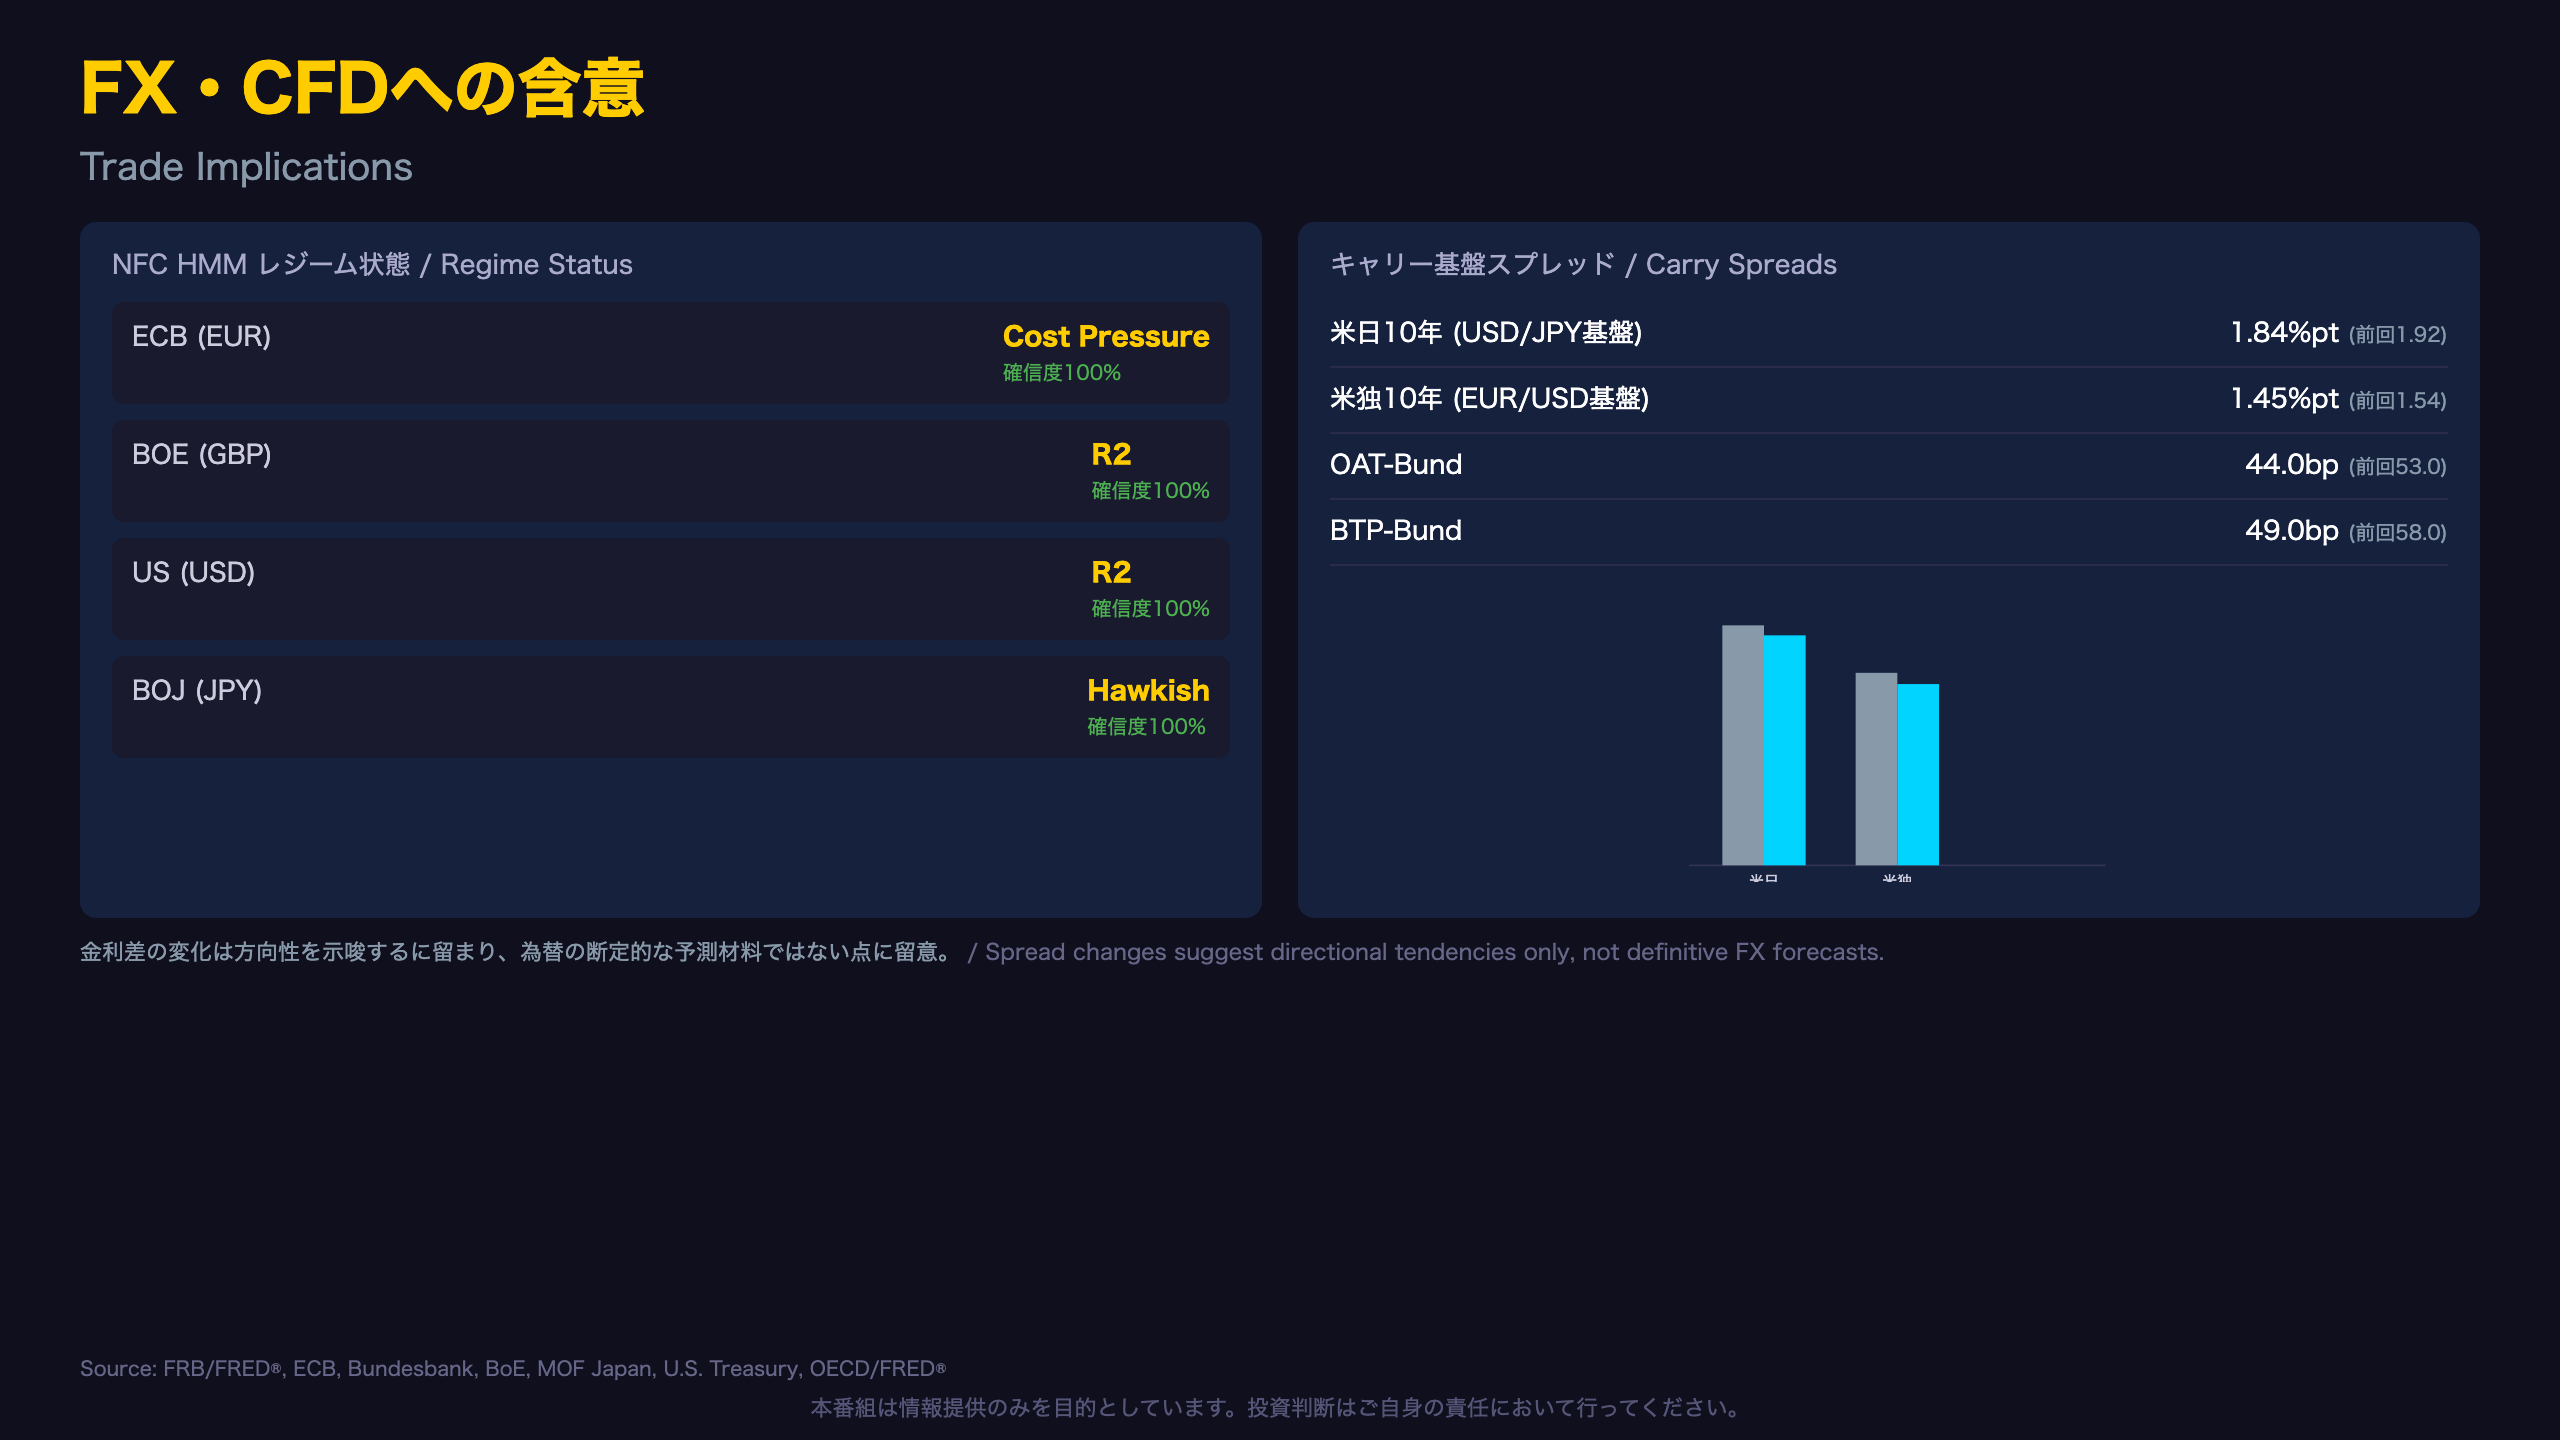
NFC’s HMM system currently shows the ECB in a “Cost Pressure” regime (ID 3), the BOE in “R2” (ID 2), the US also in “R2” (ID 2), and the BOJ in “Hawkish” (ID 2)—all at 100% confidence. In the prior report, the ECB carried the label “Mild Inflation” (same ID 3) and the BOE “Restrictive” (same ID 2). Since the underlying regime IDs haven’t changed, this isn’t a structural regime shift so much as a relabeling that leans more explicitly toward cost-side inflation dynamics.
How the regimes line up with the data
- ECB (Cost Pressure): Directionally consistent with the Bund (+9bp) and Eurozone AAA (+16bp) yield increases this period.
- BOJ (Hawkish): Consistent with the 2-year JGB’s +12bp move and the narrowing term spread (1.21 → 1.17), both pointing to front-end-led tightening expectations.
- US (R2): A flat 10-year and a declining 2-year are not inconsistent with a stable regime classification.
A caveat on coverage
As discussed earlier, the OAT-Bund and BTP-Bund spread narrowing likely reflects the staleness of the monthly French and Italian data rather than a genuine improvement in peripheral eurozone risk. The HMM regime signals for the ECB and BOJ shouldn’t be read as confirming a specific spread move—rather, they’re independent classifications that happen to move in a broadly consistent direction this period.
Changes in rate differentials only suggest directional tendencies for FX; they are not a basis for definitive forecasts.
For USD/JPY and EUR/USD watchers: the narrower US-Japan (1.84pt) and US-Germany (1.45pt) 10-year spreads point to a marginal erosion in the carry basis that has underpinned dollar strength against both currencies, though the magnitude here (single-digit basis points) is modest relative to historical swings. The next Global Bond Watch update will be published next week, with a focus on new US Treasury auction demand and whether UK Gilt yields continue their recent ascent.
Disclaimer: This article is for informational purposes only. All investment decisions are made solely at your own risk.