📺 Watch the Full Video Analysis
This article was automatically generated by the NFC Market Live AI analysis system. (Updated: 2026-08-16 11:44 JST)
📊 This week’s NFC Market Live programming review.
We published 3 new Shorts and 16 new long-form videos, totaling 2,034 views.
📈 A US CPI Short hit 672 views with a 116.3% watch rate, while our current account deep-dive topped long-form at 412 views.
📉 However, total views fell sharply from 13,612 the prior week, and engagement rate dropped from 0.592% to 0.098%.
⚠️ The effect of our Aug 12 policy shift (moving some long-form uploads to unlisted) remains unclear—more data needed next week.
💡 Weekly production cost was 5,233 yen across 35 shows, or 2.57 yen per view. We break down the cost-efficiency balance between low-cost flash reports and deep-dive content.
オープニング:今週のサマリー
This Week at a Glance
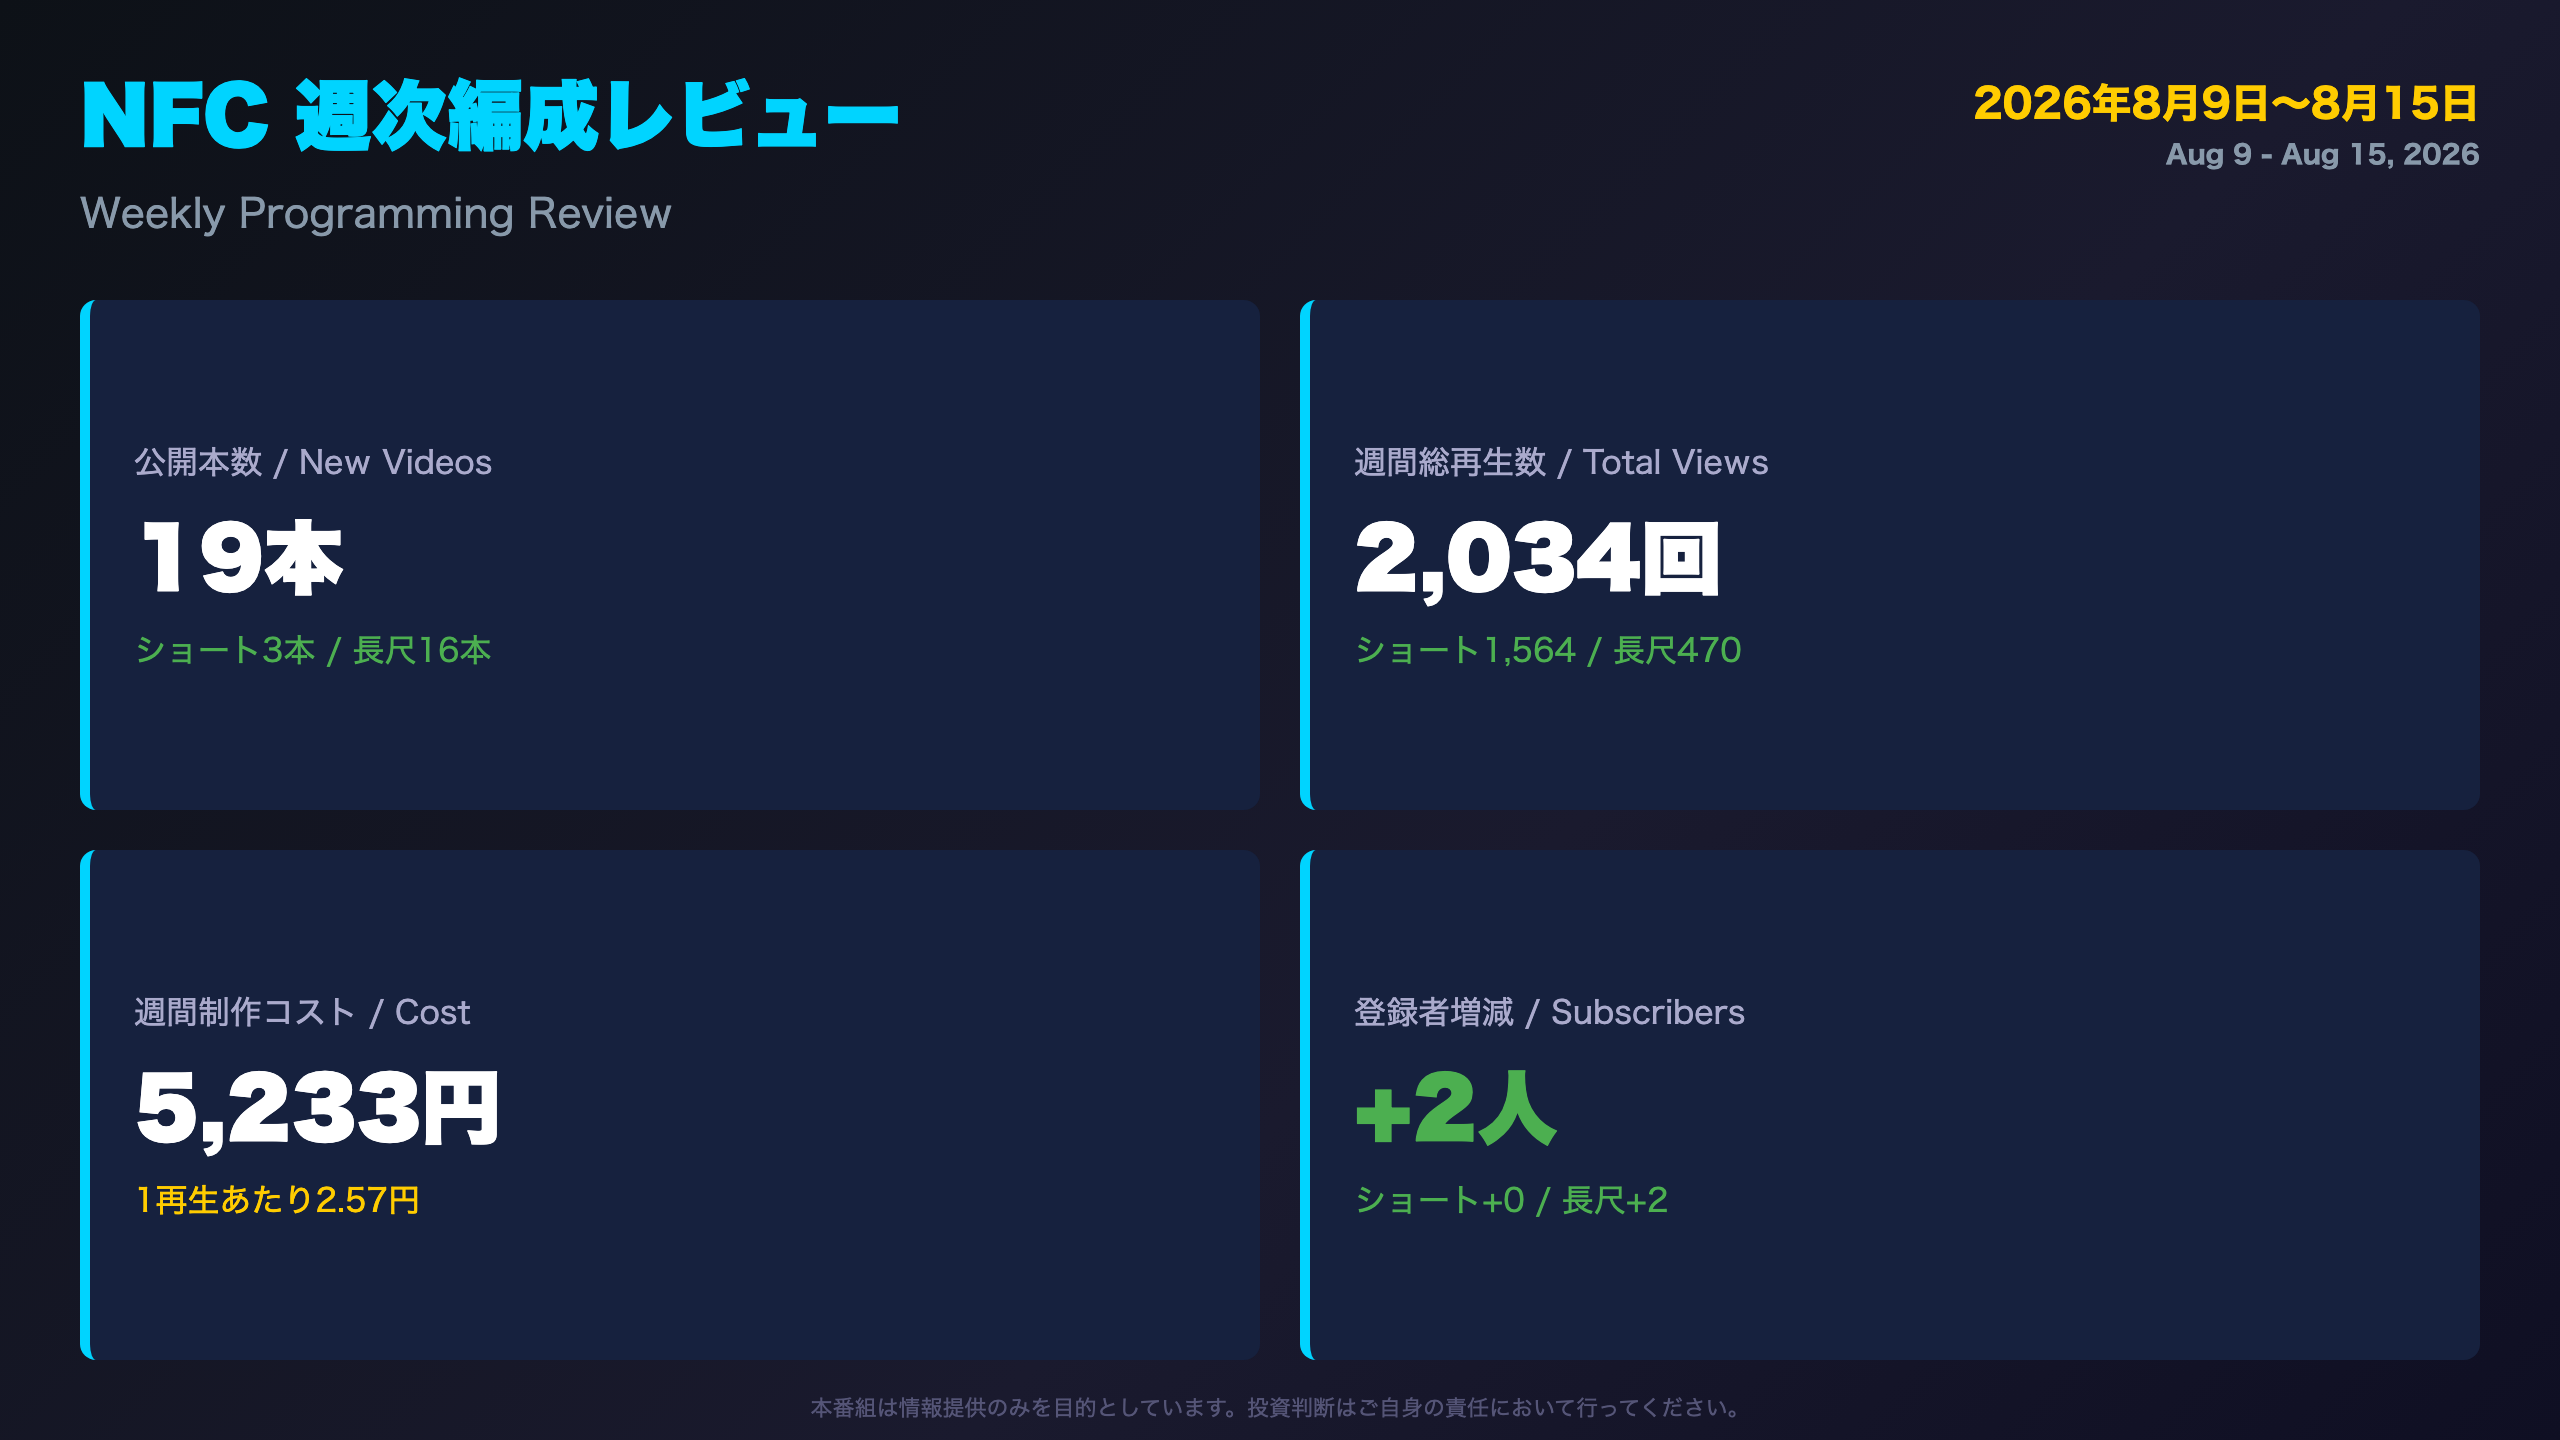
NFC Market Live published 19 new videos this week (Aug 9-15): 3 Shorts and 16 long-form episodes. Total views reached 2,034 (1,564 Shorts + 470 long-form), against a production cost of 5,233 yen—roughly 2.57 yen per view.
A Sharp Week-over-Week Decline
Compared to the prior 7-day total of 13,612 views, this week’s figure represents an approximate 85% drop. However, this week’s data is only complete through August 13, so a 7-day-equivalent estimate would be closer to 2,846 views—a meaningful but still notable decline.
Timing Overlap with a Policy Change
On August 12, we implemented a distribution policy change: long-form videos not flagged as “long_form_target” moved from unpublished to unlisted status, with only headline indicators and earnings releases going fully public. We also revised our X (Twitter) posting logic and added emoji markers (📺 public / 🔗 unlisted) to morning schedule posts.
“We adopted a two-tier approach: full publication only for headline indicators and earnings, with everything else set to unlisted (viewable via our blog).”
Engagement rate also fell sharply, from 0.592% in the prior week to 0.098% this week. Whether this reflects the policy shift or simple weekly variance remains an open question that requires further data.
Subscribers Still Growing, Modestly
Subscriber count rose by +2 this week (Shorts +0, long-form +2), maintaining a small but positive trend despite the view count decline.
今週新規ショート動画 成績リスト
Breaking Down the 3 New Shorts
| Rank | Title | Views | Watch Rate |
|---|---|---|---|
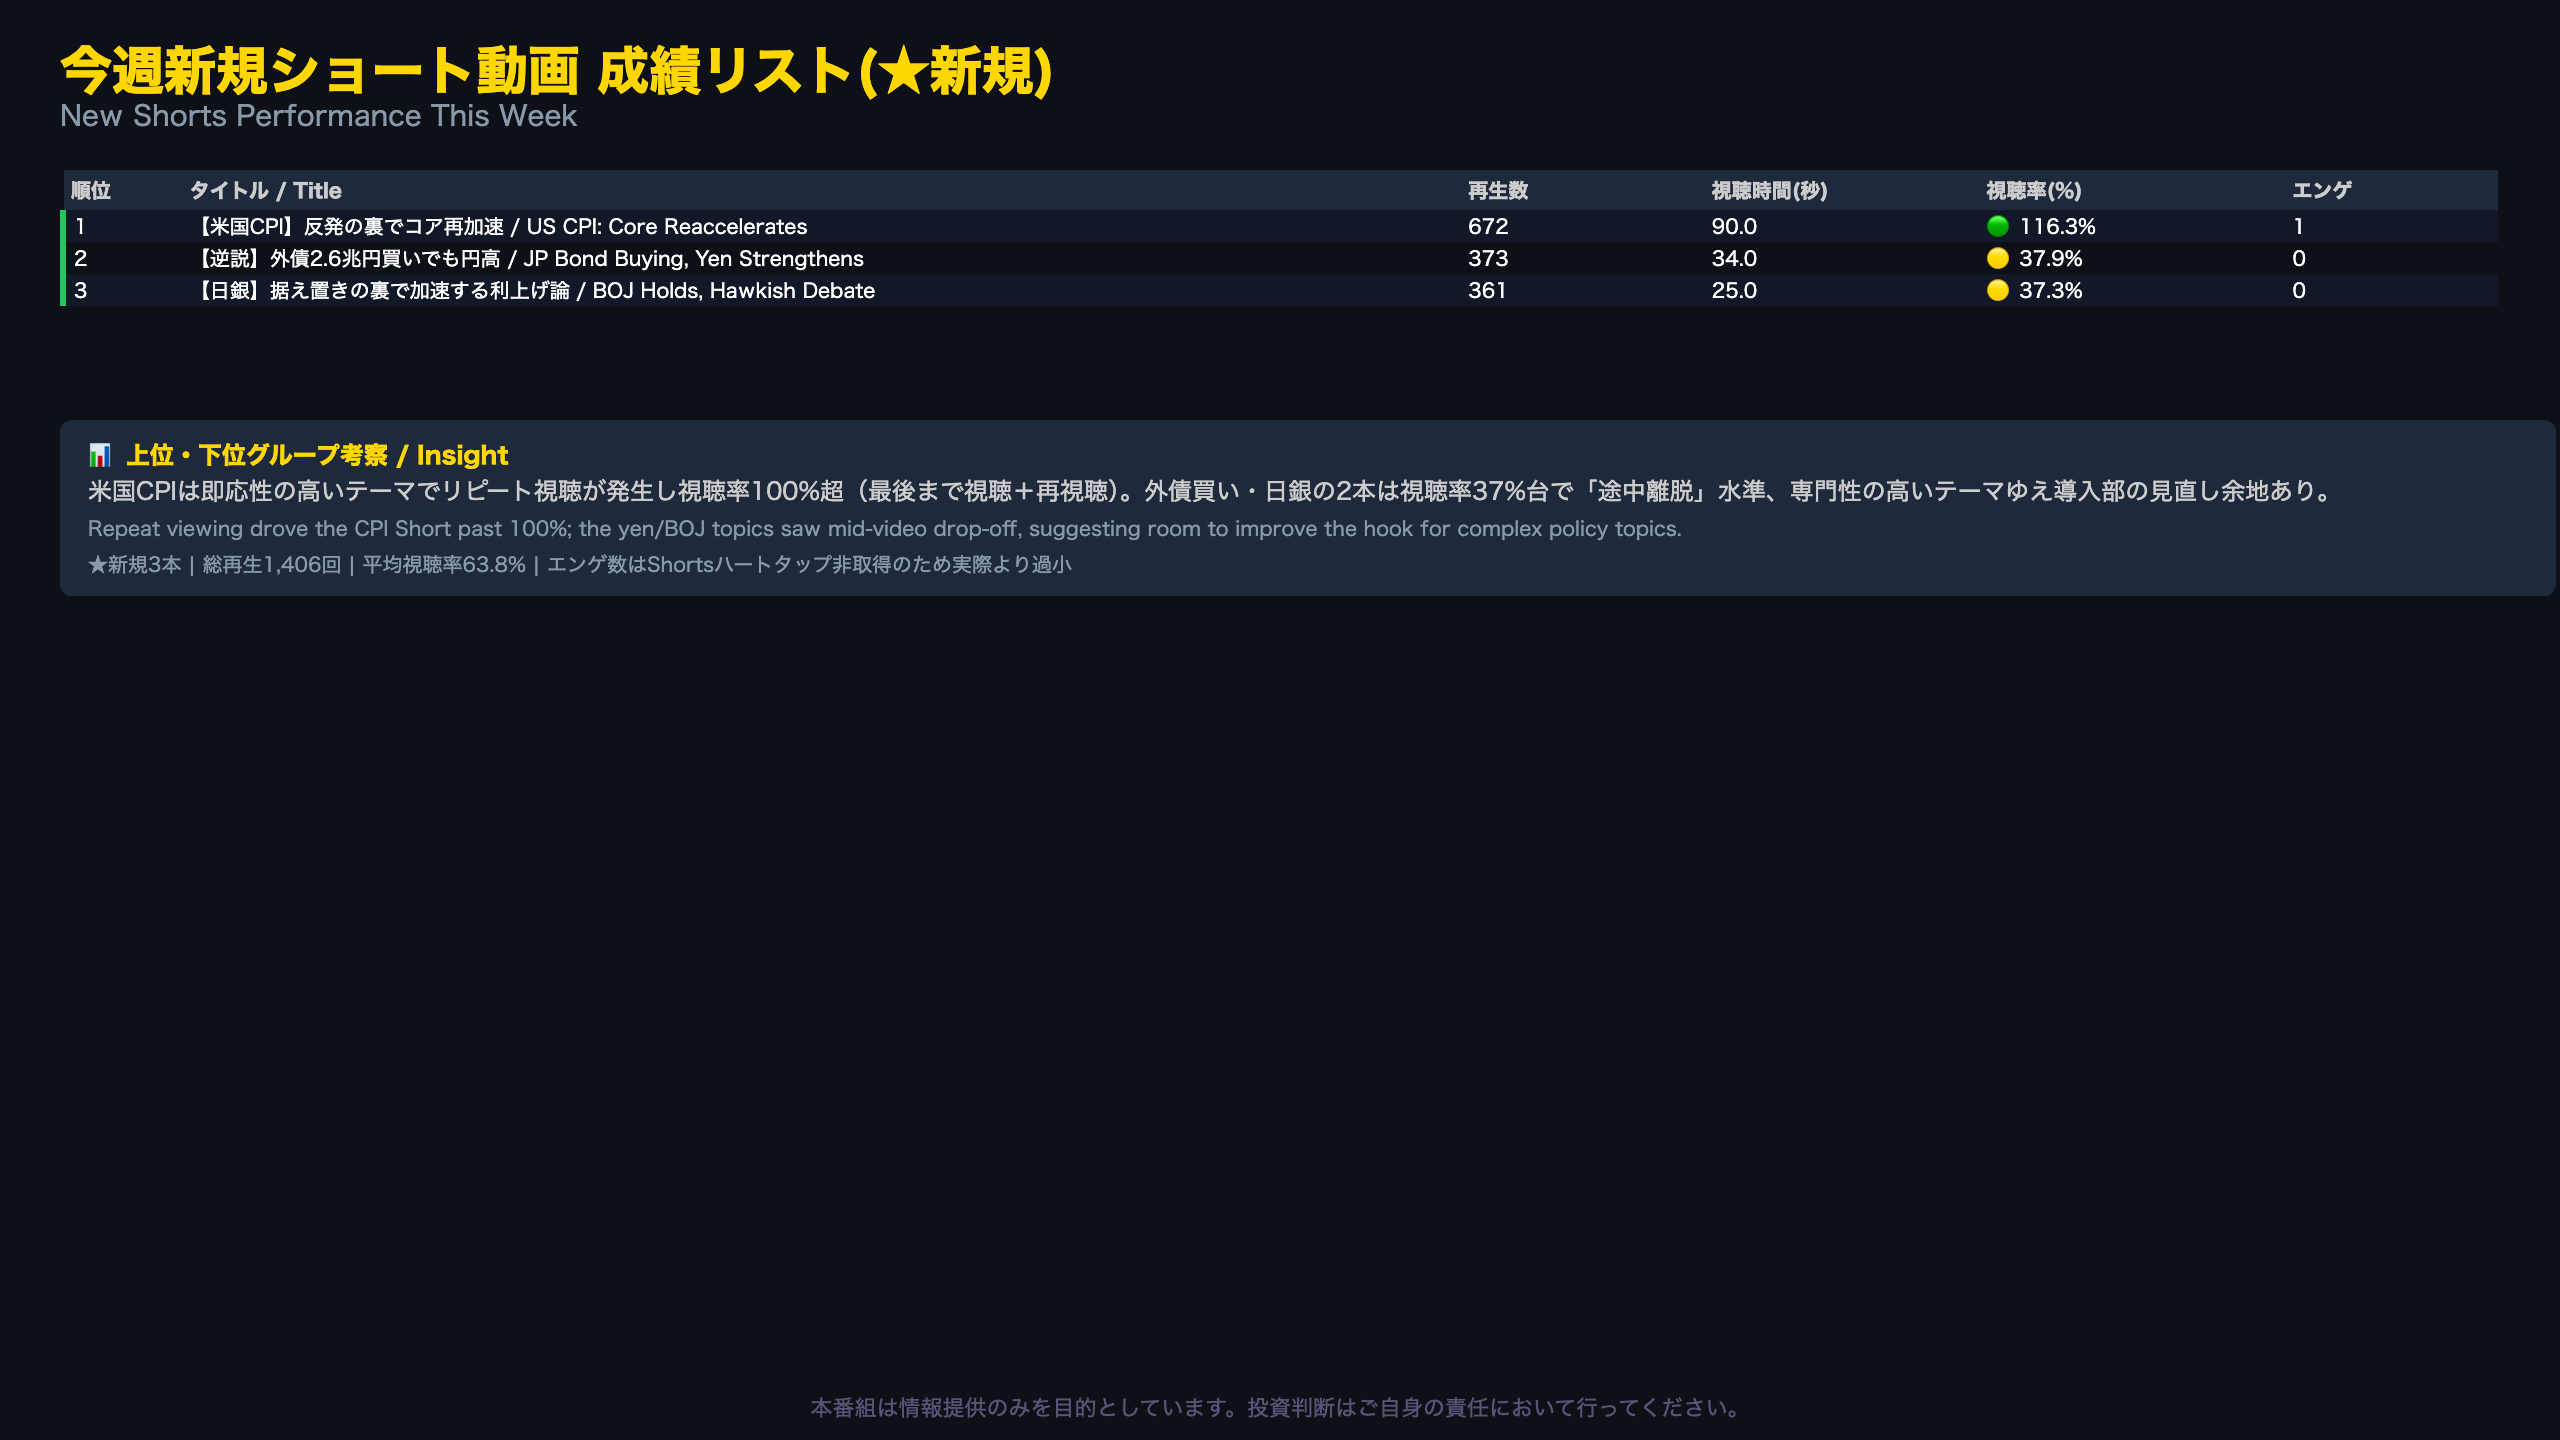
| 1 | US CPI rebound masks core reacceleration | 672 | 116.3% |
| 2 | Japan’s $18B bond buying, yet yen strengthens | 373 | 37.9% |
| 3 | BOJ holds rates, hawkish debate accelerates | 361 | 37.3% |
A watch rate exceeding 100% (116.3%) indicates substantial repeat/loop viewing—a common phenomenon on YouTube Shorts when viewers replay a clip multiple times. This is generally read as a signal of strong content engagement, though it’s a single data point.
Comparing to the Channel Average
Across all 50 Shorts tracked this week (new and existing), the average watch rate was 36.3%. Two of our three new Shorts (37.9%, 37.3%) sit right around this baseline, while the CPI Short (116.3%) is a clear outlier. This may reflect the immediacy of CPI as a topic that demands quick investor reaction, though drawing structural conclusions from one data point would be premature.
A Caveat on Engagement Metrics
Total engagement across these three Shorts was just 1. Importantly, YouTube’s Data API cannot capture Shorts “heart taps,” so actual engagement is structurally understated here.
For context, US economic indicators (CPI, jobs reports) are widely followed by retail and institutional investors alike, unlike the more specialized topics of Japanese bond flows or BOJ policy nuance—which may partly explain the watch-rate gap, though topic complexity is only one plausible factor among several.
今週新規長尺動画 成績リスト
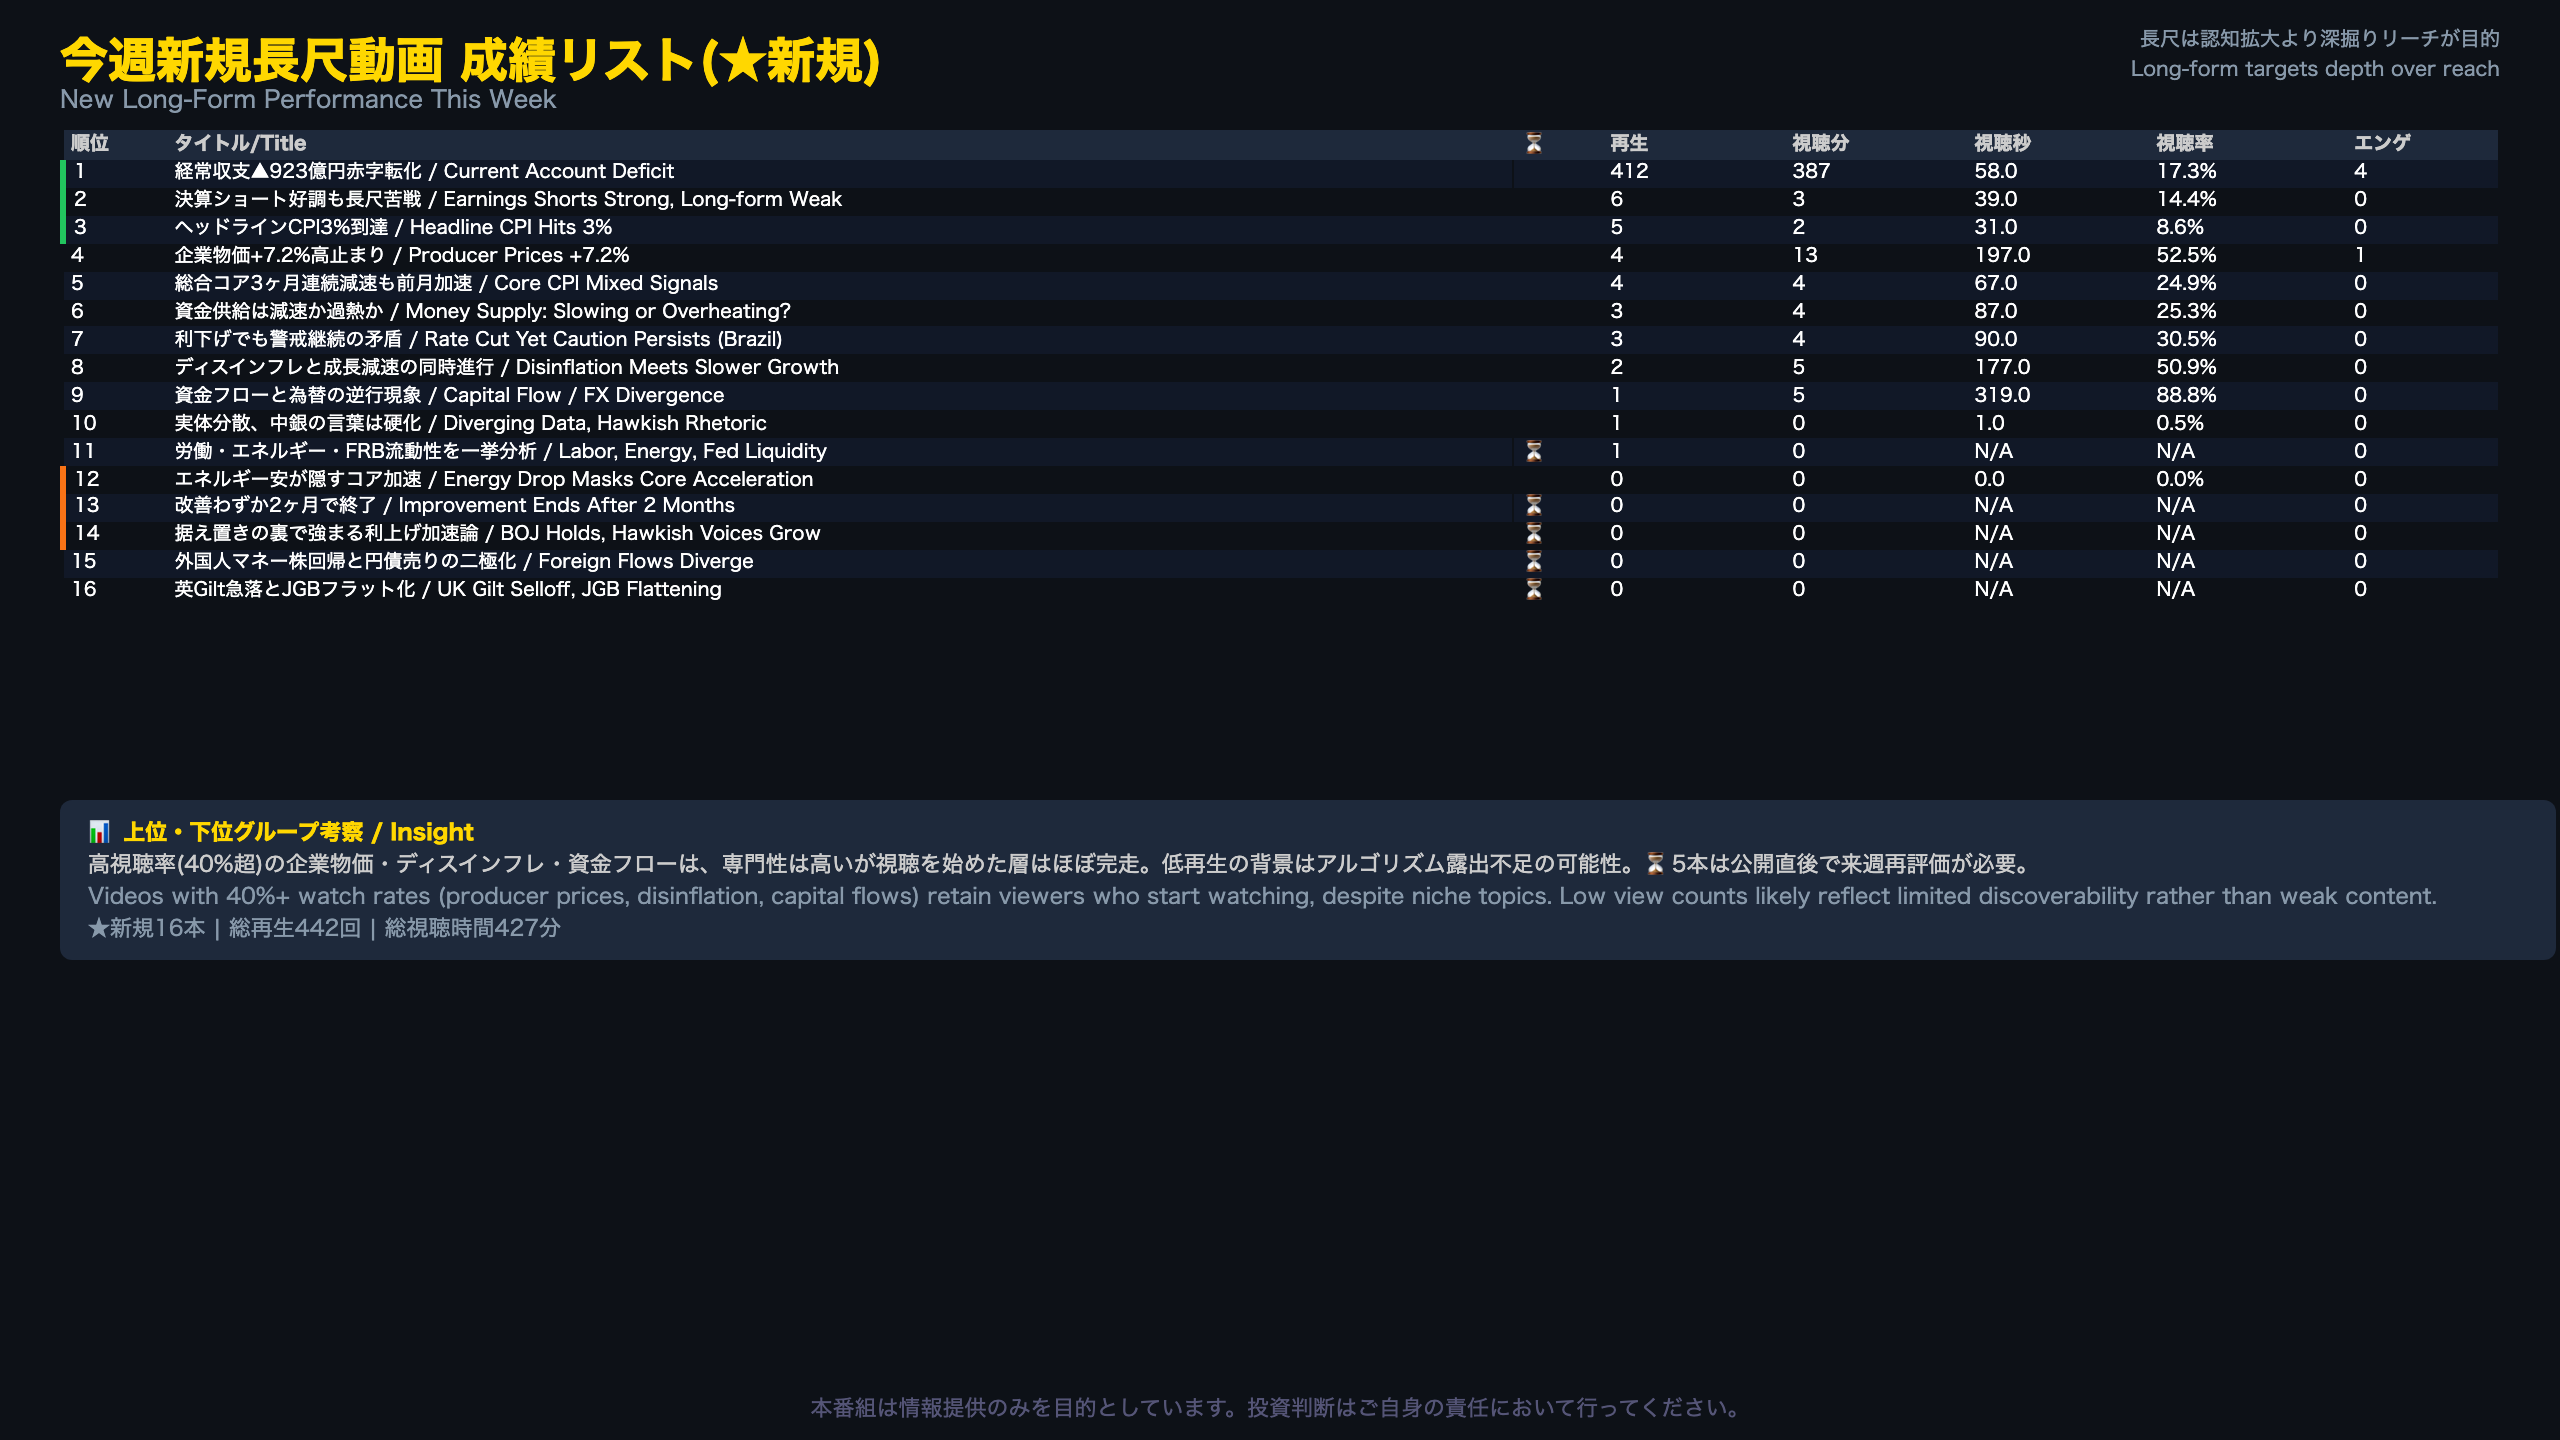
Overall Pattern Across 16 New Long-Form Videos
The 16 new long-form videos generated 442 combined views and 427 minutes of total watch time. The current account analysis led with 412 views and 387 minutes, while the rest of the lineup showed a classic long-tail distribution with single-digit view counts.
Watch Rate Tells a Different Story
Several videos that rank low by view count look much stronger through the lens of watch rate:
| Title | Views | Watch Rate |
|---|---|---|
| Capital flow / FX divergence | 1 | 88.8% |
| Producer prices at +7.2%, momentum fading | 4 | 52.5% |
| Disinflation continues alongside slower growth | 2 | 50.9% |
Even with only 1-4 views, watch rates of 50-88.8% suggest that viewers who start watching tend to stay until nearly the end. This pattern suggests these videos may simply lack reach/discoverability rather than lacking content quality—two very different problems requiring different solutions.
Five Videos Awaiting Analytics
Five videos marked with an hourglass (⏳)—covering labor/energy/Fed liquidity, the University of Michigan survey, BOJ policy, foreign capital flows, and UK Gilt volatility—were published August 10 and 13, too recently for YouTube Analytics to fully process. These require re-evaluation next week.
Possible Link to the Distribution Policy Change
Some of these pending videos may overlap with programs affected by our new “unlisted” distribution policy. Since unlisted videos receive less algorithmic exposure on YouTube, this could structurally limit their view growth going forward—a hypothesis worth monitoring in next week’s data, though it cannot be confirmed from this week’s numbers alone.
28日間 チャンネル成長トレンド
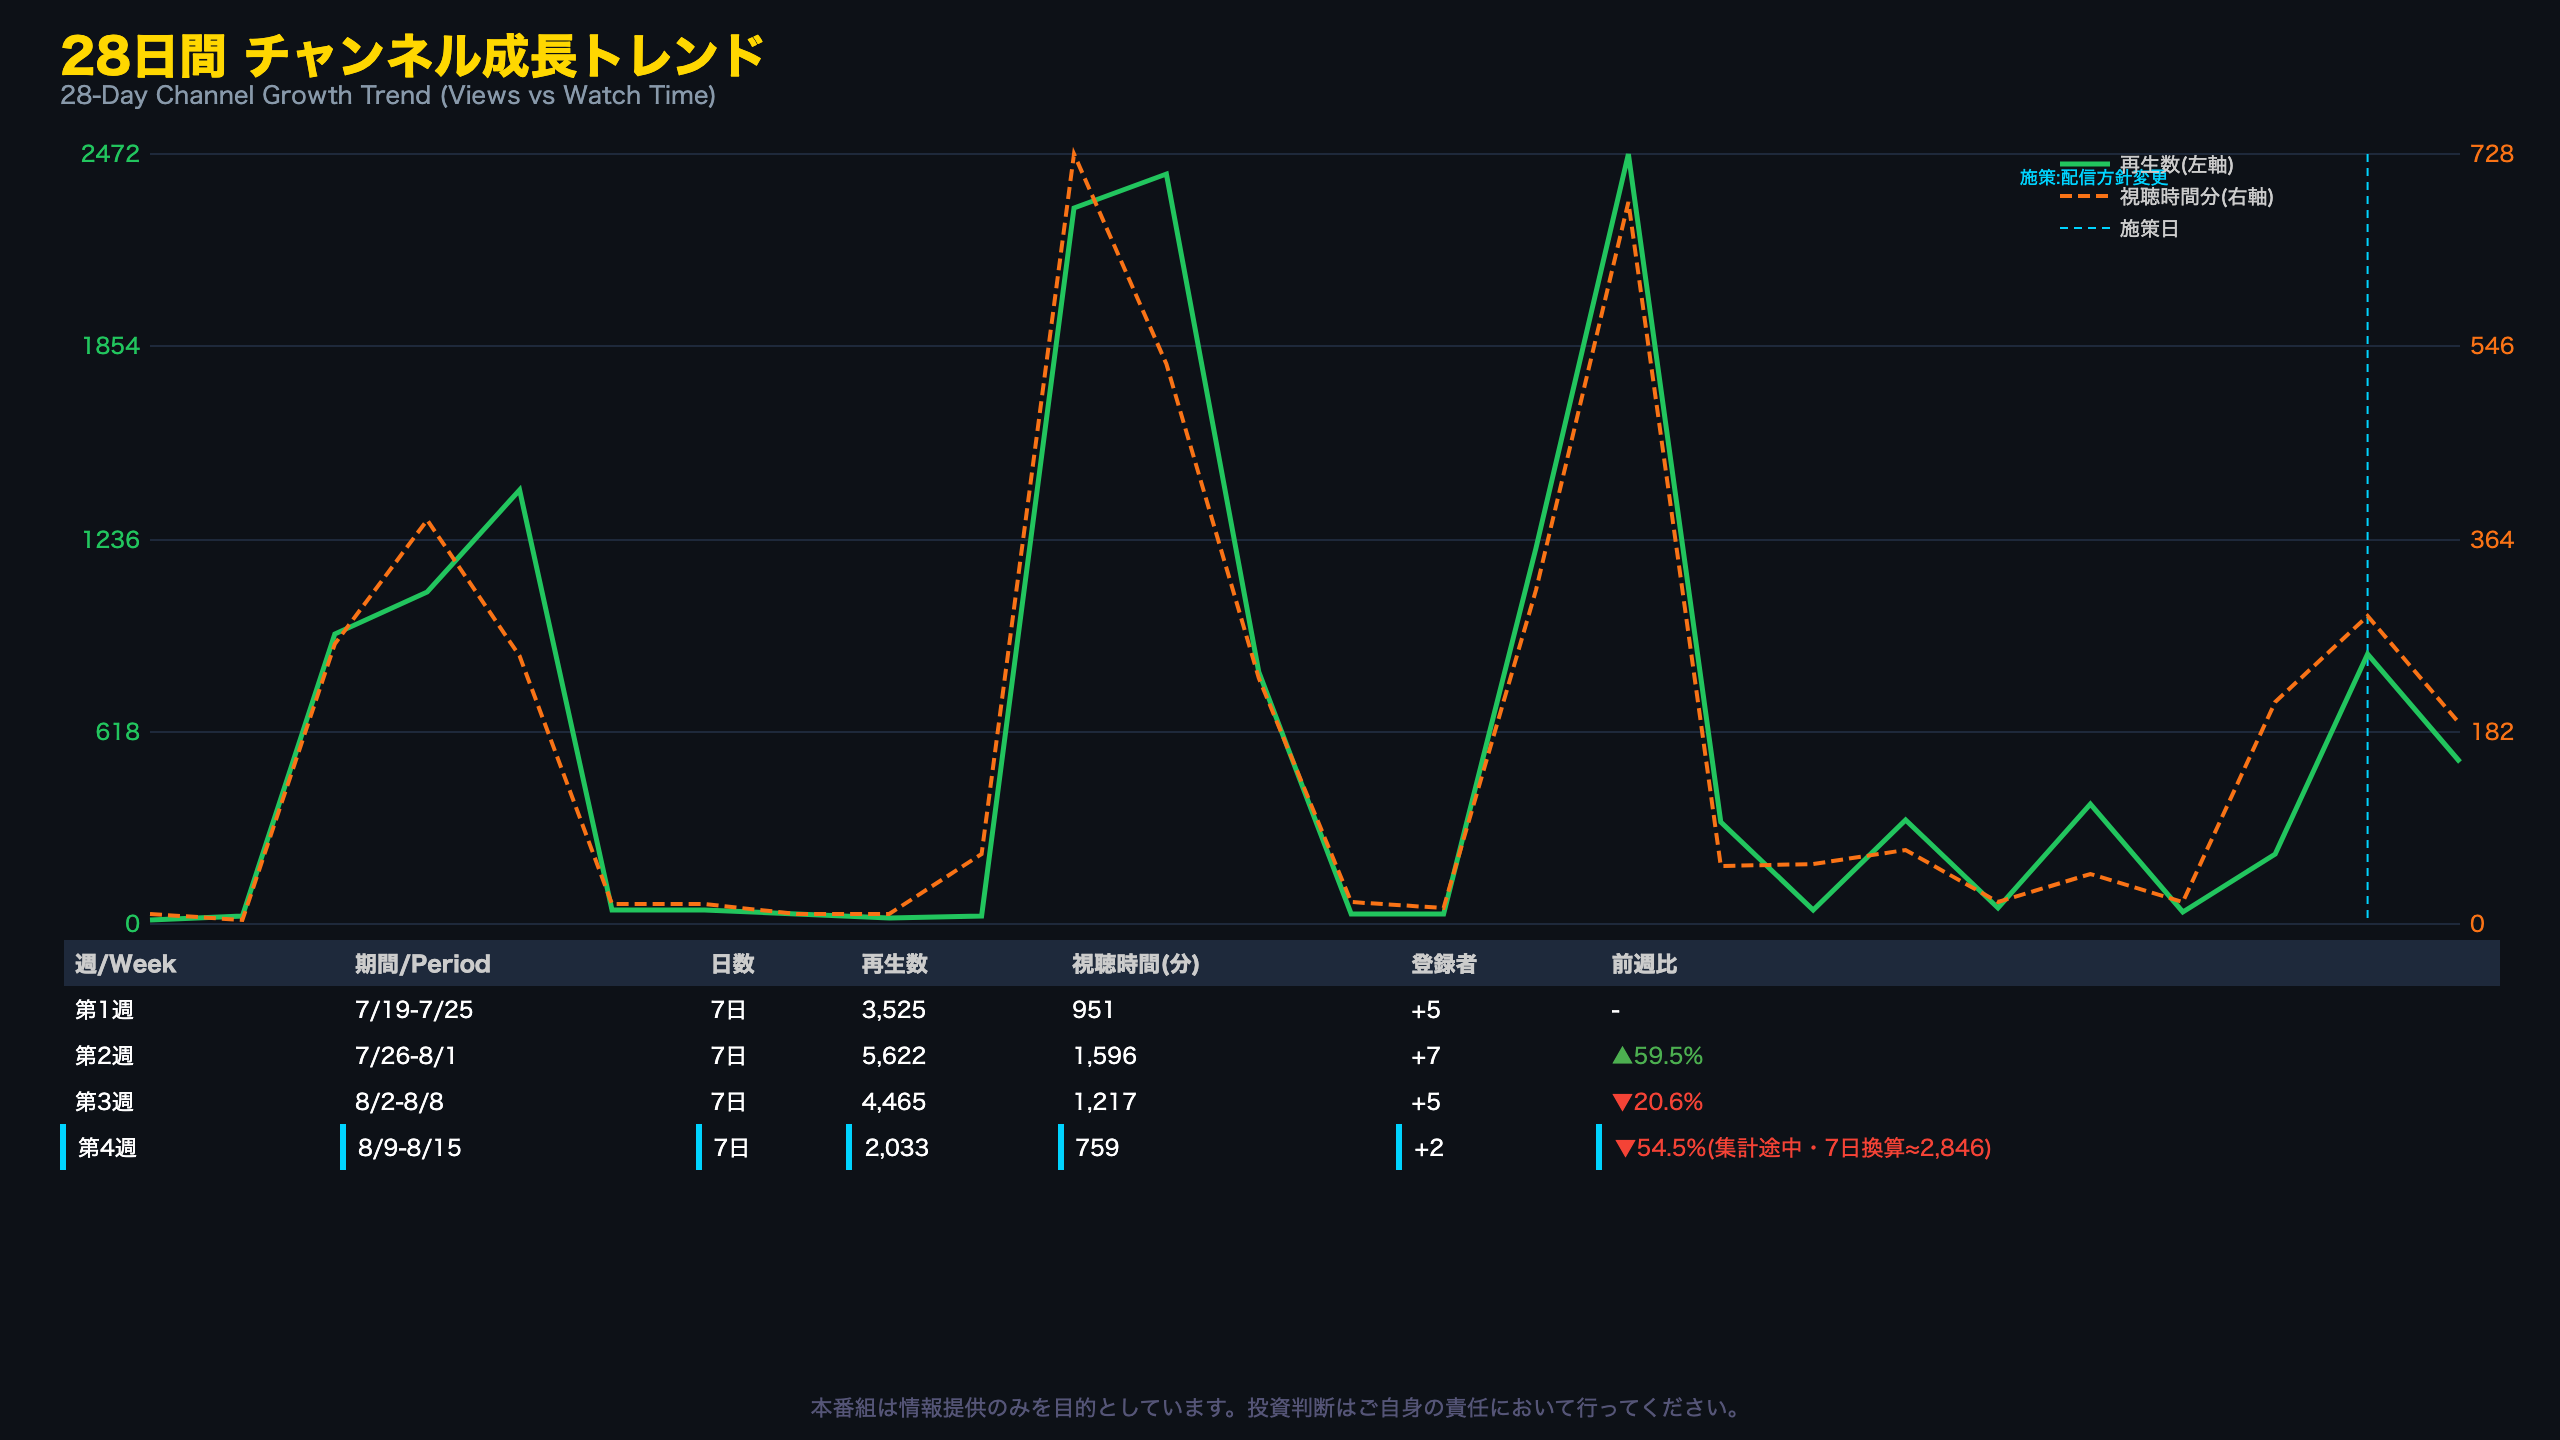
Reading the 28-Day Trend
The dataset covers 26 days from July 19 to August 13, 2026 (the final two days of a full 28-day window were not yet available). Within this window, clear view-count peaks occurred on July 21-23, July 29-31, and August 3-4—likely tied to specific publication dates for high-interest content.
A Day Where Watch Time Diverged from Views
August 11 stands out: 227 views paired with 210 minutes of watch time, implying roughly 55 seconds of watch time per view on average—unusually high. This suggests a smaller audience engaging much more deeply that day, rather than a broad but shallow viewership.
Weekly Trend Table
| Week | Period | Views | Watch Time | Subscribers |
|---|---|---|---|---|
| Week 1 | Jul 19-25 | 3,525 | 951 min | +5 |
| Week 2 | Jul 26-Aug 1 | 5,622 | 1,596 min | +7 |
| Week 3 | Aug 2-8 | 4,465 | 1,217 min | +5 |
| Week 4 | Aug 9-15 | 2,033 | 759 min | +2 |
Week 4 fell 54.5% versus Week 3, though this week’s data is only complete through August 13, giving a 7-day-equivalent estimate closer to 2,846 views. Even adjusting for this, the underlying trend still points downward relative to Week 3.
A Preliminary Read on the Policy Change
August 12 (the day our new distribution policy launched) saw 864 views, followed by 517 on August 13. These figures sit close to pre-policy levels like August 9 (387) and August 5 (329), meaning no clear uplift or drag from the policy change can be confirmed from this data alone. A full re-evaluation with next week’s complete dataset is essential before drawing conclusions.
今週の番組制作コスト分析
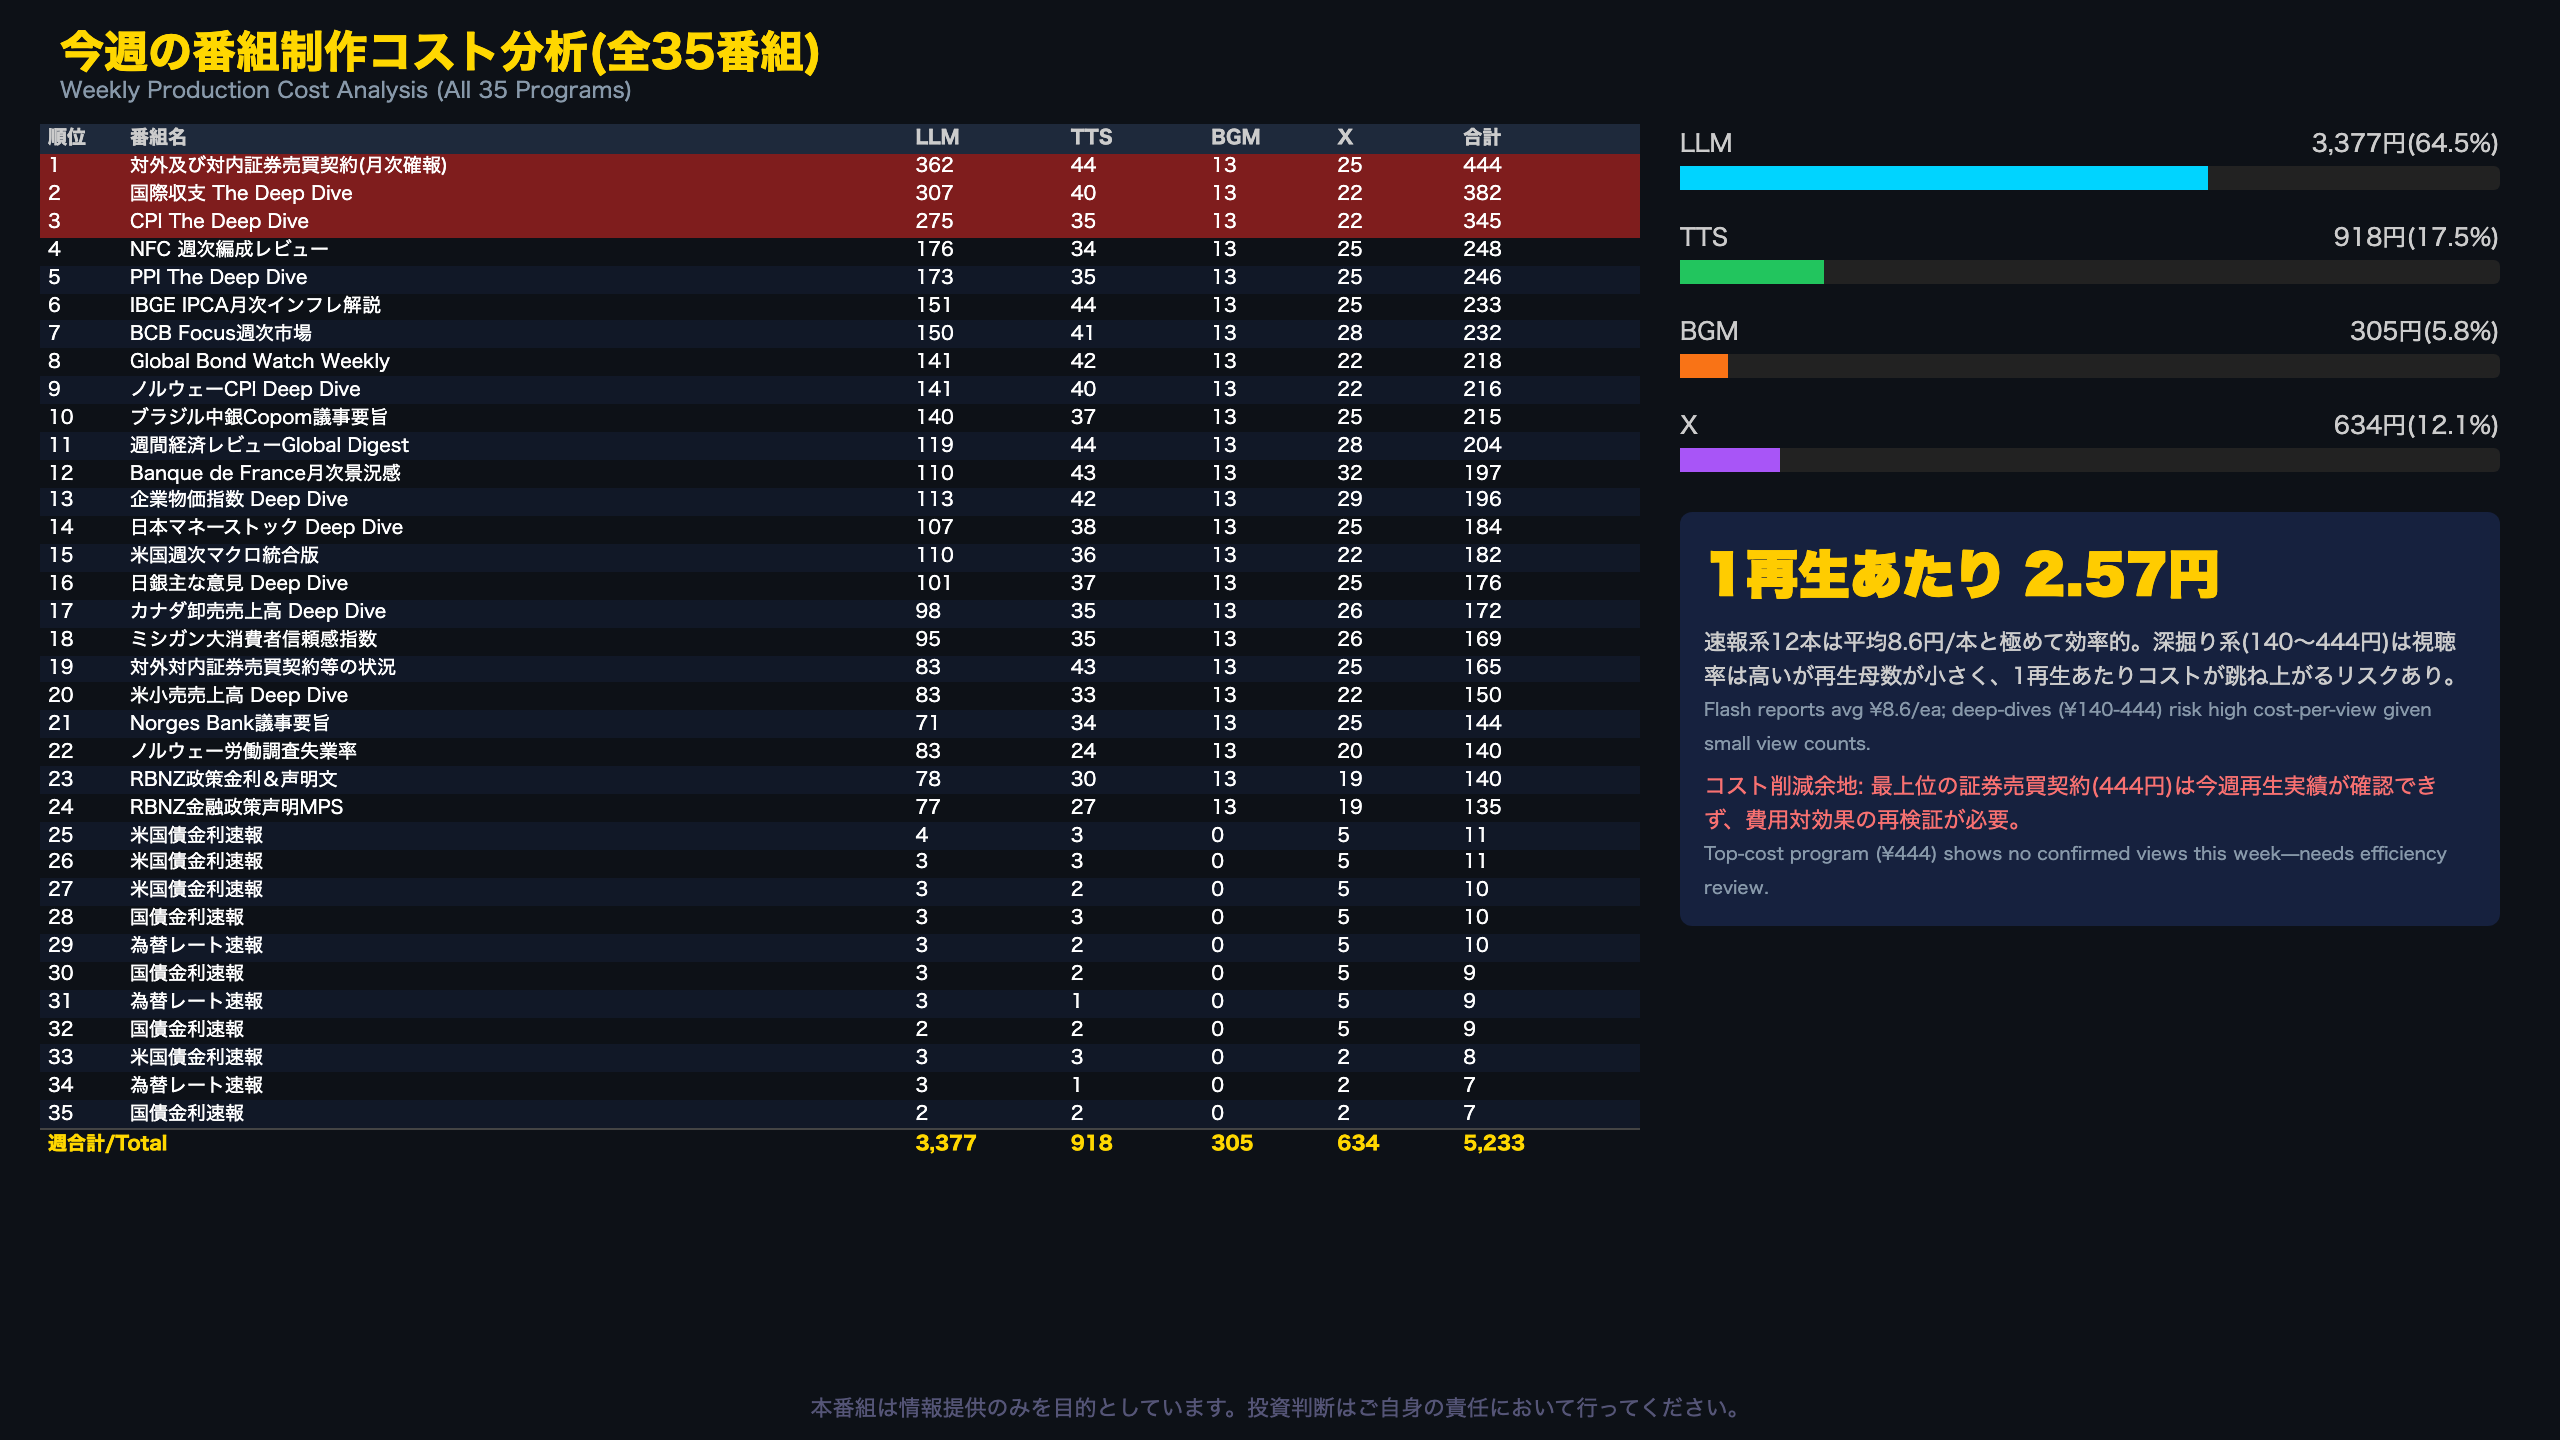
Cost Structure Breakdown
This week’s total production cost of 5,233 yen breaks down as: LLM 3,377 yen (64.5%), TTS 918 yen (17.5%), BGM 305 yen (5.8%), and X/social 634 yen (12.1%). LLM costs dominate, directly reflecting script length and analytical depth—longer, more detailed scripts cost proportionally more to generate.
Top 3 Highest-Cost Programs
| Program | LLM | TTS | BGM | X | Total |
|---|---|---|---|---|---|
| Securities Flows (Monthly) | ¥362 | ¥44 | ¥13 | ¥25 | ¥444 |
| Balance of Payments | ¥307 | ¥40 | ¥13 | ¥22 | ¥382 |
| CPI Deep Dive | ¥275 | ¥35 | ¥13 | ¥22 | ¥345 |
These three programs represent our deep-dive tier, each running roughly 275-362 yen in LLM cost alone. Notably, the top-cost program (securities flows) shows no confirmed views in this week’s tracking window, which flags a cost-efficiency question worth monitoring.
Efficiency of the 12 Flash-Report Programs
Our 12 flash-report programs (US Treasury yields, JGB yields, FX rates) totaled roughly 103 yen combined—about 8.6 yen per episode on average. These short-format programs keep both LLM and TTS costs to a minimum, demonstrating an efficient low-cost, high-frequency production model.
Weighing Cost Against Value
Overall cost-per-view came to 2.57 yen this week. However, this varies enormously by program: our current-account deep-dive (412 views) represents strong value, while several other deep-dive programs with minimal views carry a much higher effective cost-per-view given their small viewership base. Balancing the low-cost mass-production model (flash reports) against premium analytical content (deep dives) remains an ongoing operational challenge.
来週の番組制作方針
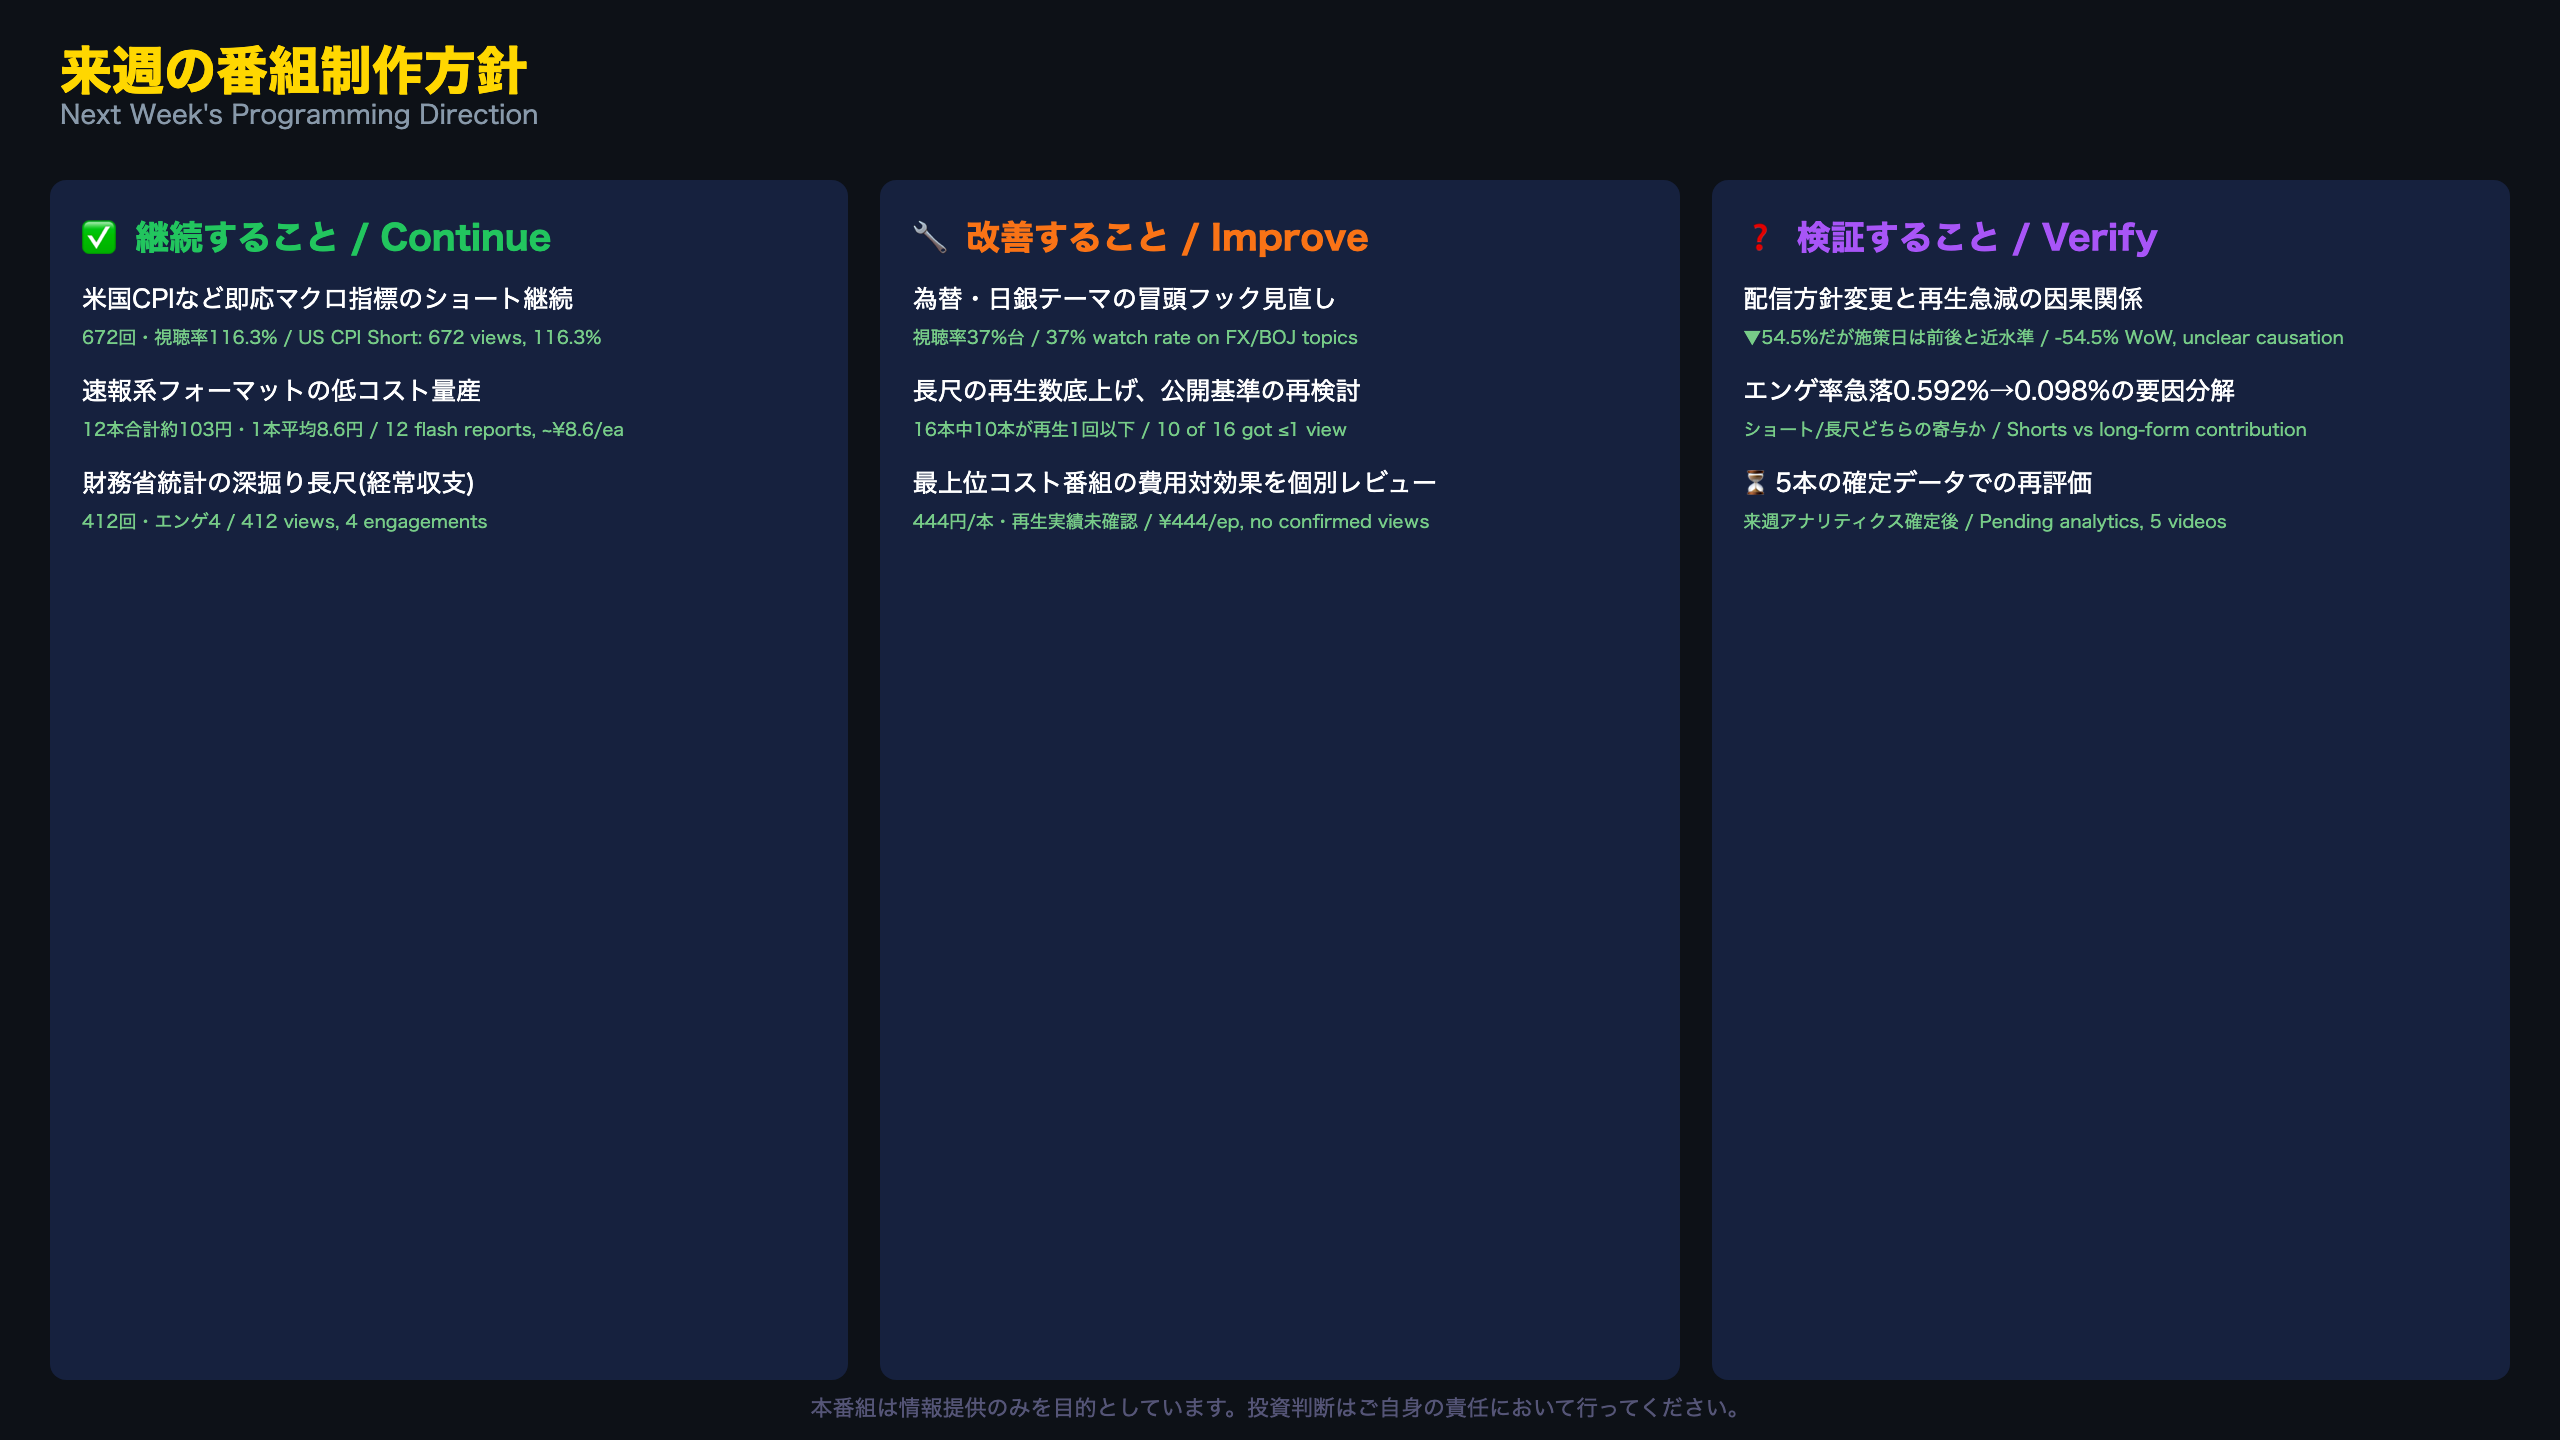
Concrete Next Steps for Next Week
Based on this week’s data, we’re organizing our approach around three tracks.
What to Continue
- Shorts on high-immediacy macro topics like US CPI (672 views, 116.3% watch rate this week)
- Low-cost mass production of flash-report formats (12 episodes, ~¥103 total, ~¥8.6/episode)
- Deep-dive coverage of MOF releases like the current account (412 views, 4 engagements)
What to Improve
- FX/BOJ-themed Shorts held at a 37% watch rate—the opening hook (first 3 seconds) needs revisiting
- 10 of 16 new long-form videos got ≤1 view. We need to isolate the effect of the unlisted-video policy before revising which programs get full publication
- Individually review the cost-efficiency of our top-cost program (¥444), which showed no confirmed views this week
Open Questions for Further Verification
- How much did the August 12 distribution policy change contribute to Week 4’s 54.5% WoW view decline? Since the launch day (864 views) and the following day (517) sit close to pre-policy levels, causation cannot yet be confirmed
- What drove the sharp engagement-rate drop from 0.592% to 0.098%? We need next week’s data to determine whether Shorts or long-form videos are the larger contributor
- Five long-form videos still marked as pending analytics need re-evaluation once confirmed data is available next week
Next week’s review will focus on finalized data for these five pending videos, plus a fuller two-week trend read on the distribution policy change.
Disclaimer: This article is for informational purposes only. All investment decisions are made solely at your own risk.