📺 Watch the Full Video Analysis
This article was automatically generated by the NFC Market Live AI analysis system. (Updated: 2026-08-16 22:44 JST)
📊 This week’s Global Macro Digest from NFC Market Live.
US CPI and PPI both showed calm headline prints, yet core measures accelerated in tandem. 📈
Japan’s current account swung to a rare deficit even as auto and semiconductor exports stayed resilient — and a currency paradox emerged. 💹
Brazil’s central bank cut rates while keeping hawkish language intact. ⚠️
Next week: Japan trade data and the Jackson Hole Symposium take center stage.
オープニング / Opening

This Week’s Global Economic Review
From August 9 to 16, 2026, we cover a wide sweep of data from the US, Japan, and Brazil. The week’s central theme: a surface-level calm paired with underlying stickiness, visible in US inflation data, Japan’s balance of payments, and Brazil’s monetary policy alike. This episode sets up next week’s Jackson Hole Symposium and Japan’s trade statistics, weighing strengths and weaknesses without favoring either narrative.
今週の総括:鎮静化の裏の粘着性 / The Weekly Verdict
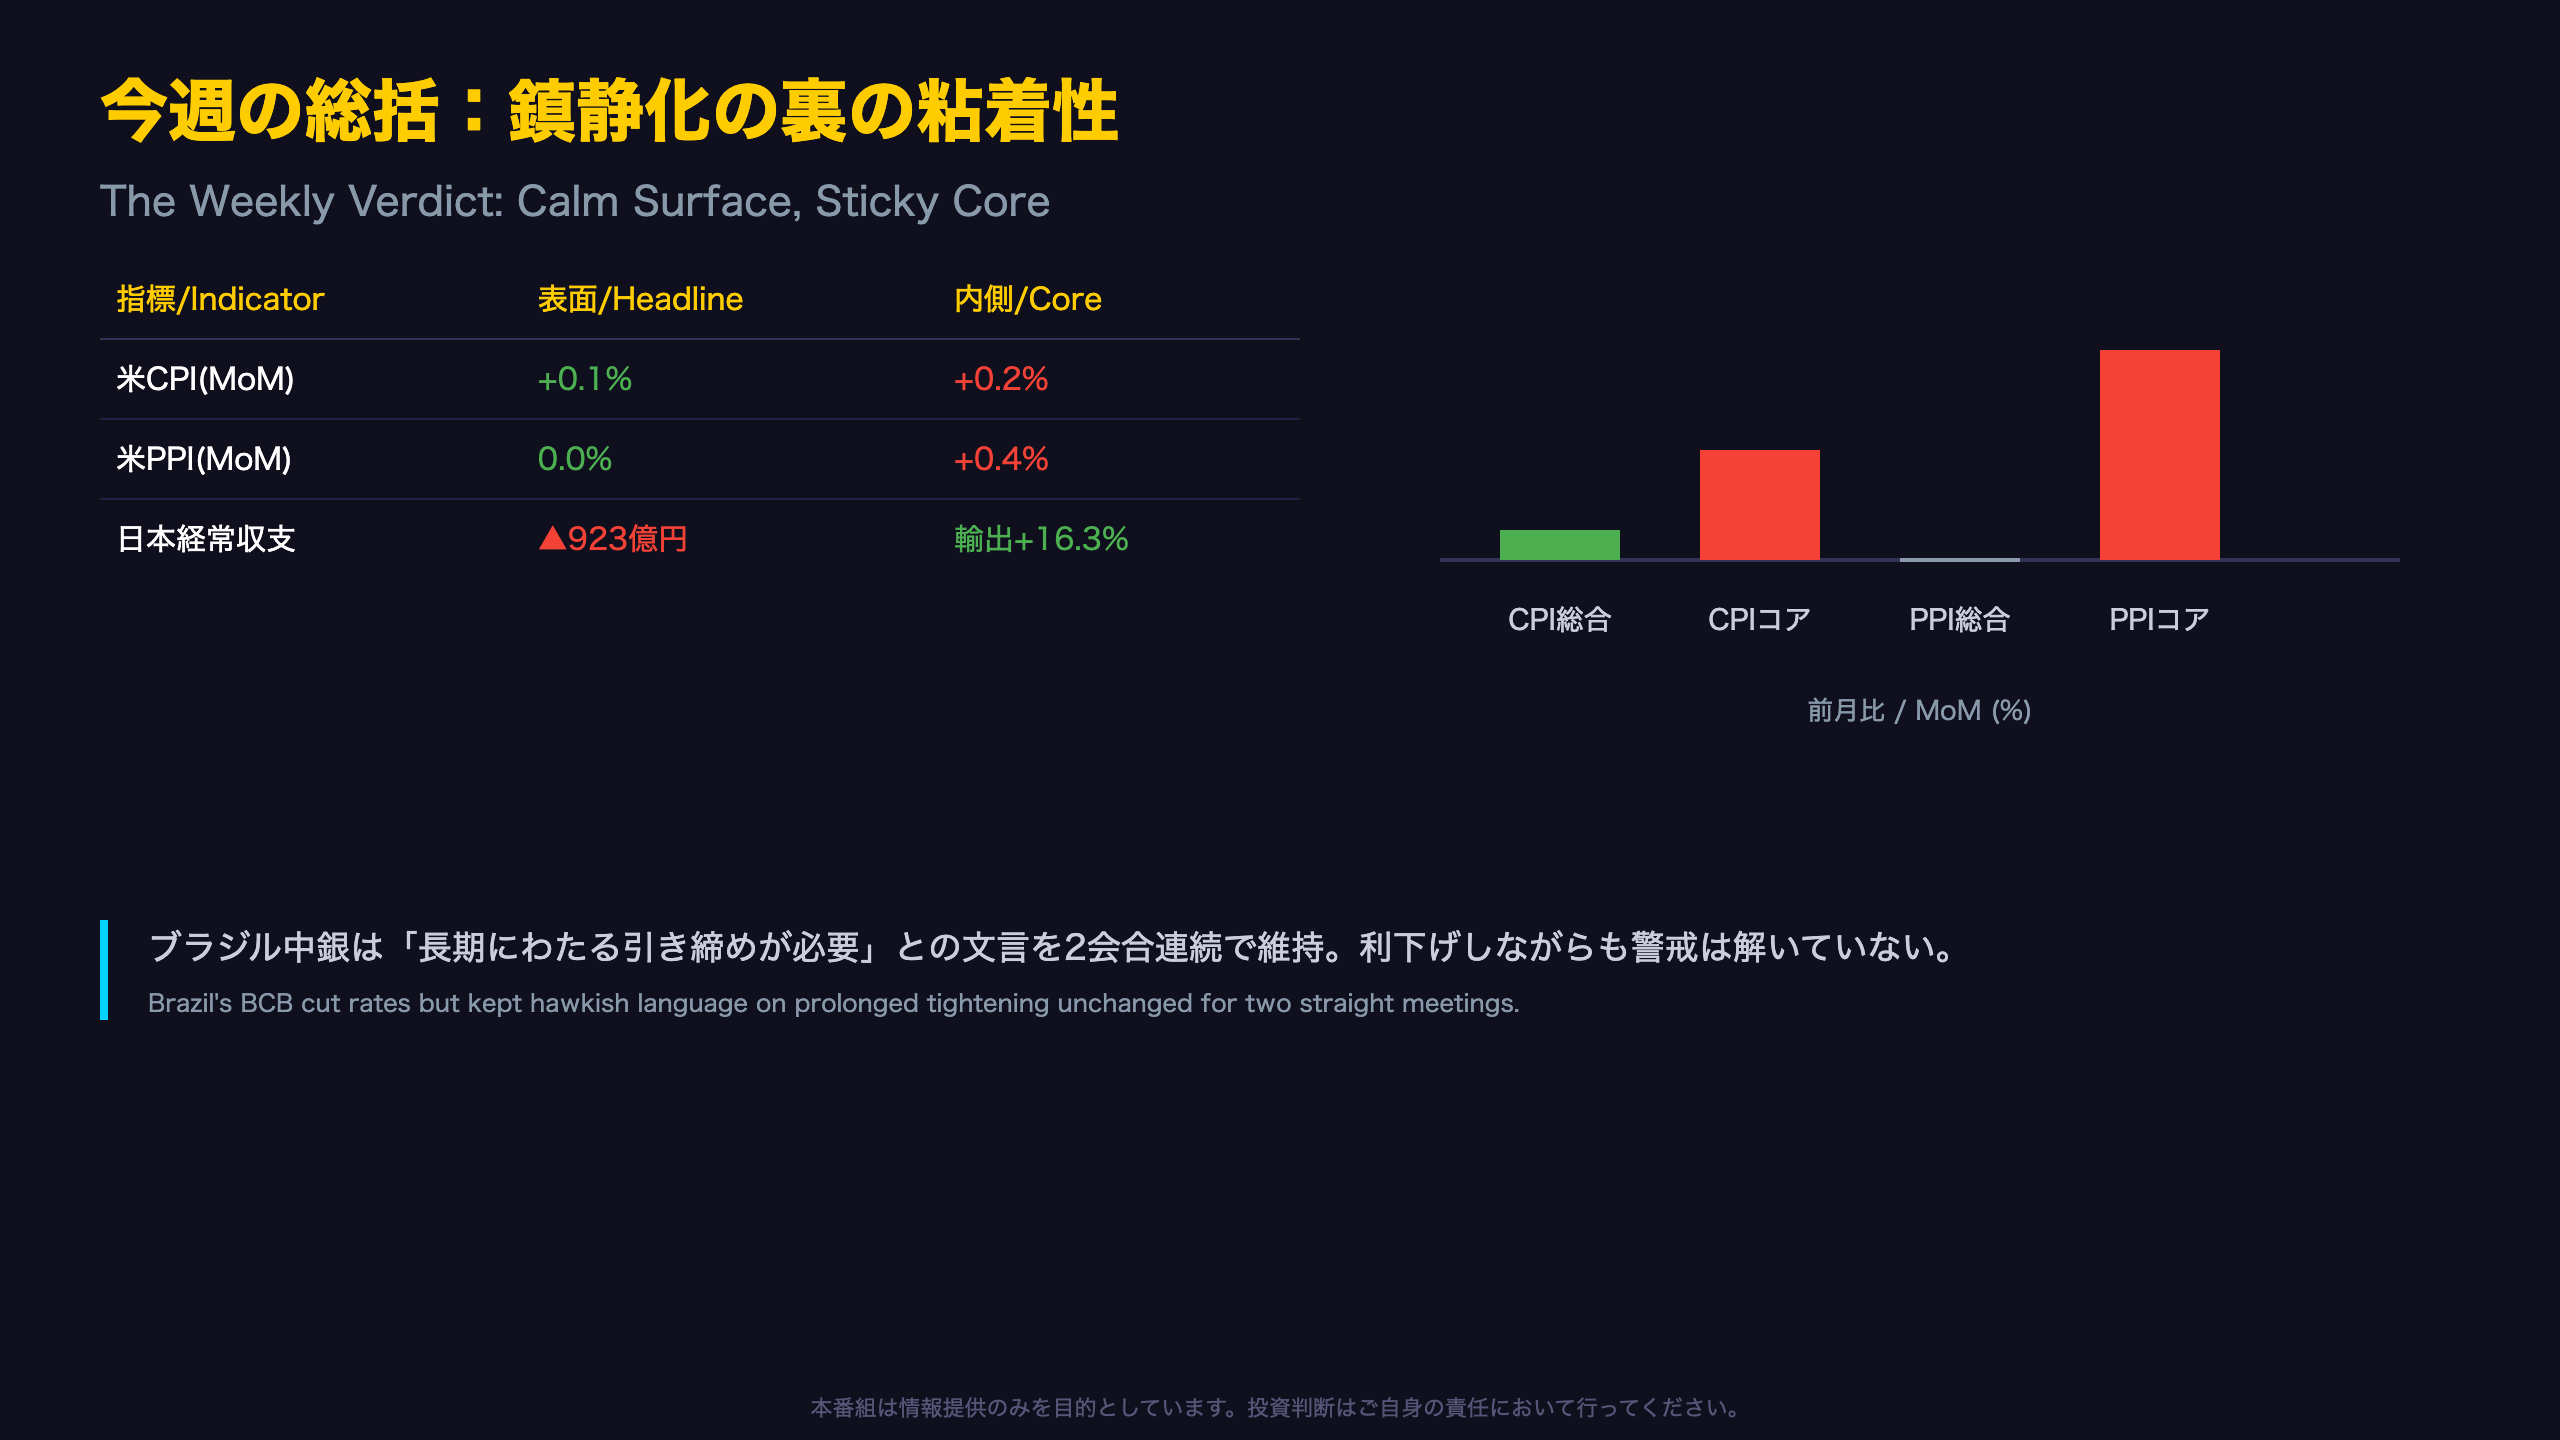
This Week’s Theme: Calm on the Surface, Sticky Underneath
Data from the US, Japan, and Brazil painted a week that resists a simple bull/bear label.
The Two Faces of the Data
| Indicator | Headline | Underlying |
|---|---|---|
| US CPI (MoM) | +0.1% | Core +0.2% (up from 0.0%) |
| US PPI (MoM) | 0.0% | Core +0.4% (up from +0.1%) |
| Japan Current Account | -¥92.3B (first deficit) | Exports still +16.3% YoY |
| Brazil Selic/GDP | Cut to 14.00% | 2027 GDP cut 3 weeks running |
Context for International Readers
Japan’s Ministry of Finance (MOF) reported the current account swinging from a ¥3.97 trillion surplus in May to a ¥92.3 billion deficit in June. The MOF cited a shrinking primary income surplus, not a collapse in trade competitiveness.
Brazil’s central bank (BCB) cut its Selic rate to 14.00% while repeating, across two consecutive meetings, that tightening stronger and more prolonged than previously considered appropriate is still needed — a textbook hawkish cut.
General principle: when core inflation reaccelerates even briefly while headline cools, central banks tend to delay declaring victory. This week’s core CPI and PPI both ticked up, though one month alone isn’t conclusive.
Neither an inflation is beaten nor a recession is here narrative fits comfortably with this week’s crosscurrents.
日本:経常赤字ショックと資金フローの逆説 / Japan: Deficit Shock & Flow Paradox
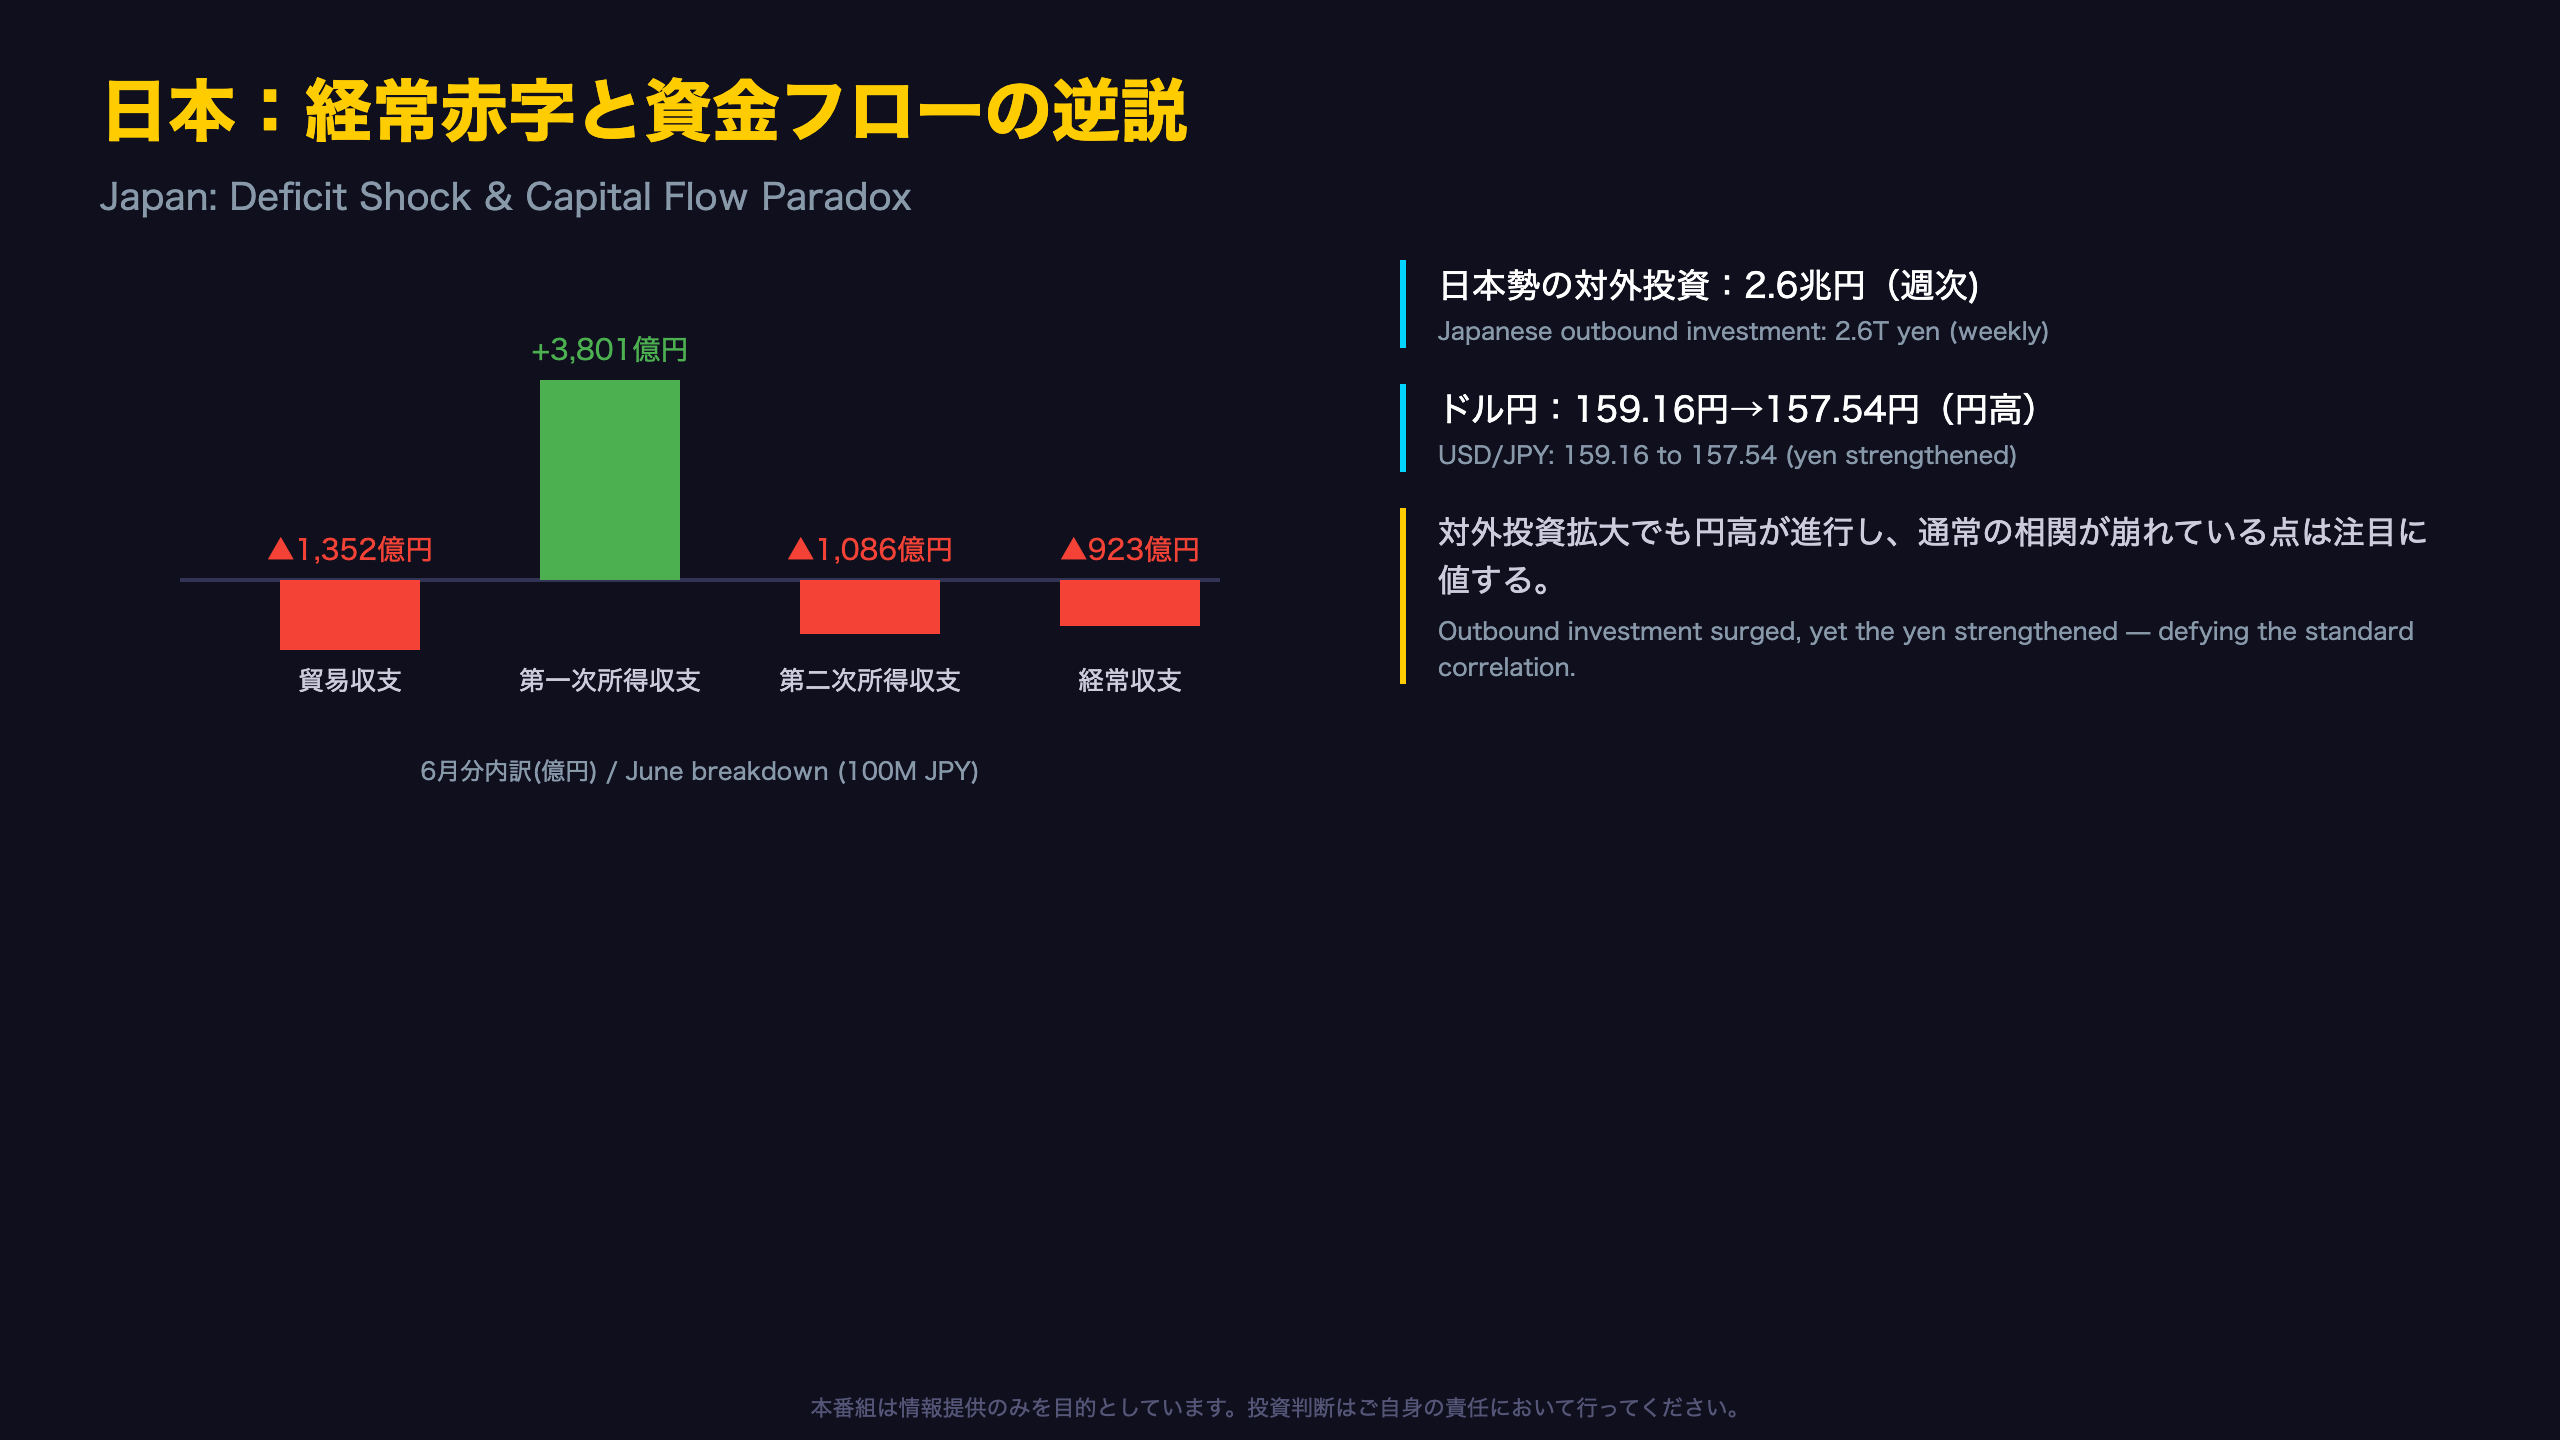
Japan’s Current Account Deficit: One-Off Shock or Structural Shift?
Japan’s Ministry of Finance (MOF) reported a rare monthly current account deficit of 92.3 billion yen for June 2026, a 1.37 trillion yen deterioration from a year earlier.
| Item | June | YoY Change |
|---|---|---|
| Trade Balance | -135.2B yen | -602.5B yen |
| Primary Income | +380.1B yen | -1,064.8B yen |
The MOF explicitly cited a widening deficit in securities investment income as a key driver — unusual, since this line item is typically a large, stable surplus. June is a month when Japanese corporations concentrate dividend payouts, which may partly explain the swing.
Crucially, export volumes stayed resilient: autos posted +6.0% volume growth and semiconductor-related exports jumped 53.8% in value, both tied to the ongoing global AI investment cycle. The trade deficit was driven almost entirely by import prices — crude oil import volume actually fell 13.7% year-on-year, yet the yen-value cost rose 59.3%.
The Capital Flow Paradox
MOF’s weekly flow data (week of Aug 2-8) showed Japanese investors buying a combined 2.59 trillion yen of foreign stocks and bonds, more than 10x the prior week, yet USD/JPY strengthened from 159.16 to 157.54 over the same period — defying the standard assumption that outbound investment weakens the yen.
Connecting to BOJ Policy
Japan’s 10s-2s JGB spread compressed to 1.21 percentage points, driven by rising 2-year yields, consistent with BOJ meeting minutes showing at least nine members favoring continued or accelerated rate hikes.
米国:ヘッドライン鎮静・コア粘着 / US: Calm Headlines, Sticky Cores
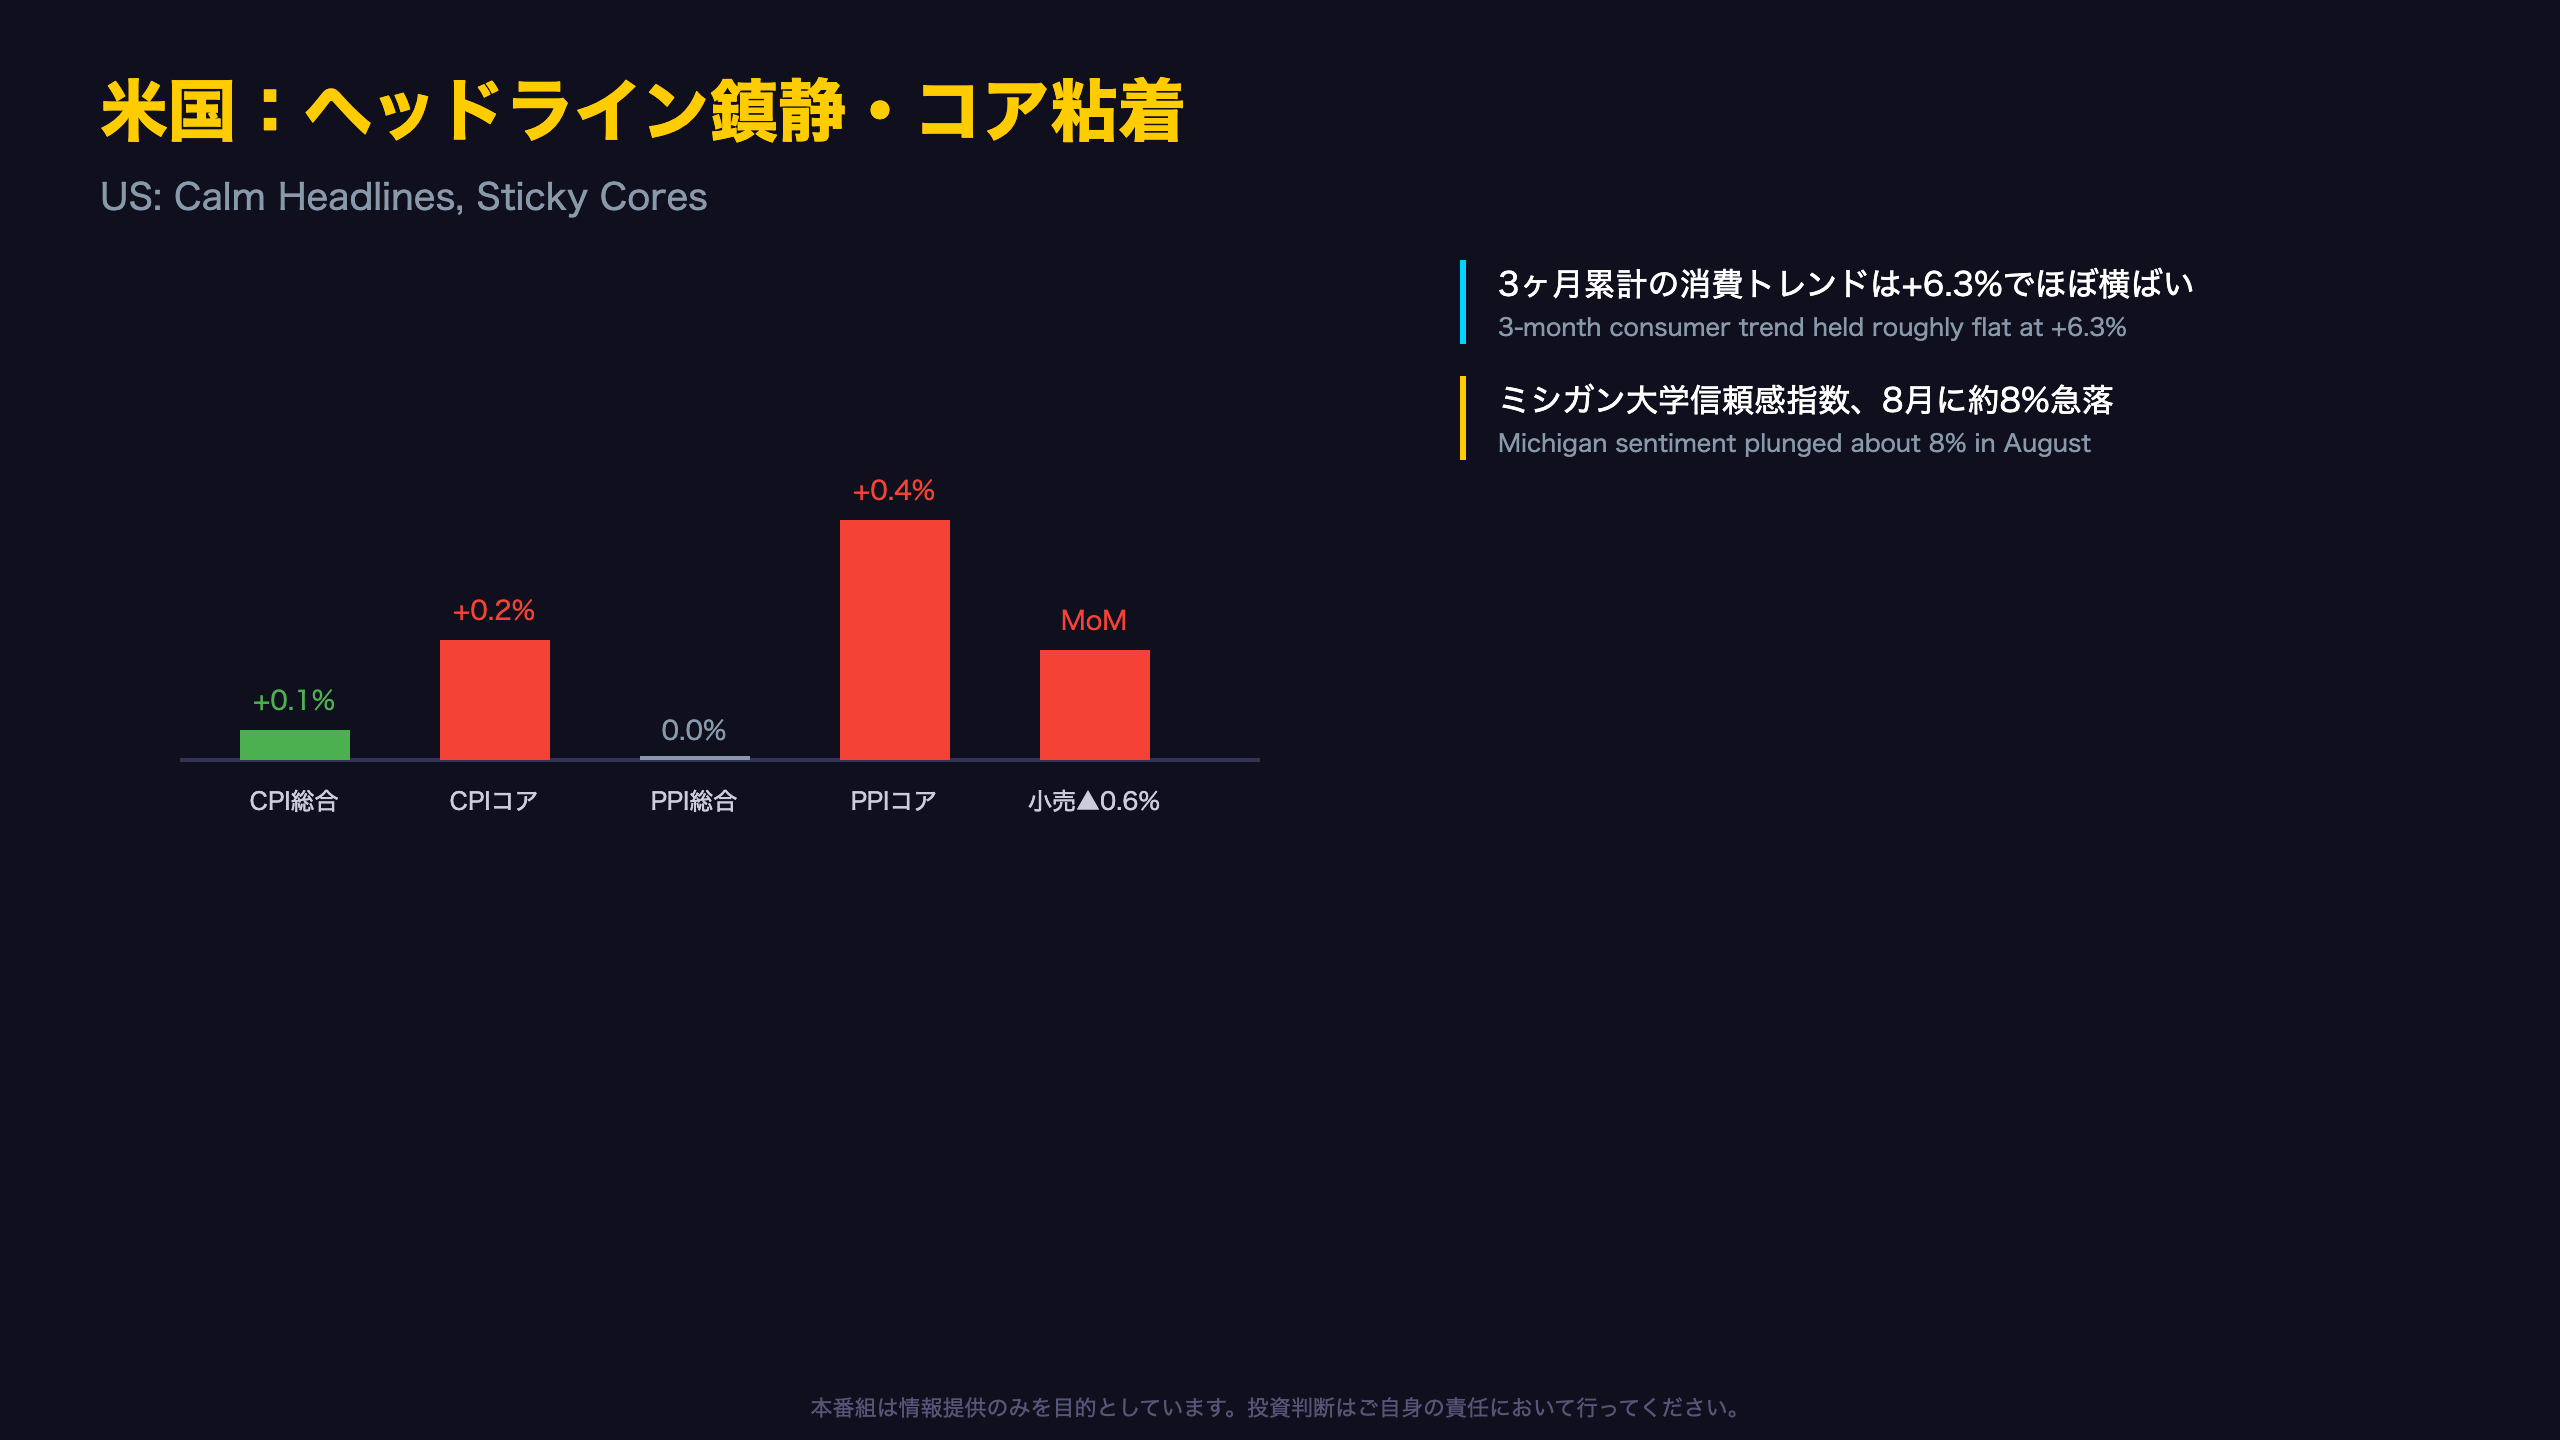
Three US Indicators, One Shared Pattern
Both CPI and PPI from the Bureau of Labor Statistics (BLS) showed the same divergence this week: soft headline prints alongside accelerating core measures.
| Indicator | Headline MoM | Core MoM |
|---|---|---|
| CPI (July) | +0.1% | +0.2% (vs 0% in June) |
| PPI (July) | 0.0% | +0.4% (vs +0.1% in June) |
The BLS explicitly noted that prices excluding food, energy, and trade services rose 0.4% in July after just 0.1% in June — a jump large enough that it’s not obviously just noise, though one month alone can’t confirm a new trend.
Retail Sales: An Auto-Driven Air Pocket
Retail sales fell a statistically significant 0.6% in July, driven by a 1.8% plunge in auto dealer sales (ex-auto: -0.3%). Yet the three-month rolling year-on-year figure held essentially steady at 6.3% versus 6.4% previously — a reminder that a single soft month doesn’t necessarily signal a consumer pullback. Note this data is nominal, not inflation-adjusted.
Michigan Sentiment: Two Months of Gains, Erased
The University of Michigan’s index dropped roughly 8% in August, ending a two-month recovery. The expectations index fell more (-8.7%) than current conditions (-5.5%), suggesting Americans feel okay about their own finances but increasingly anxious about the broader economy. One-year inflation expectations ticked up to 4.3%, holding in a range the Fed won’t ignore even as headline CPI cools.
Why This Matters for the Fed
A single month of core acceleration doesn’t overturn the multi-month disinflation trend, but it argues for caution before assuming the Fed’s next move is a cut.
中央銀行の現在地 / Central Bank Policy Stances
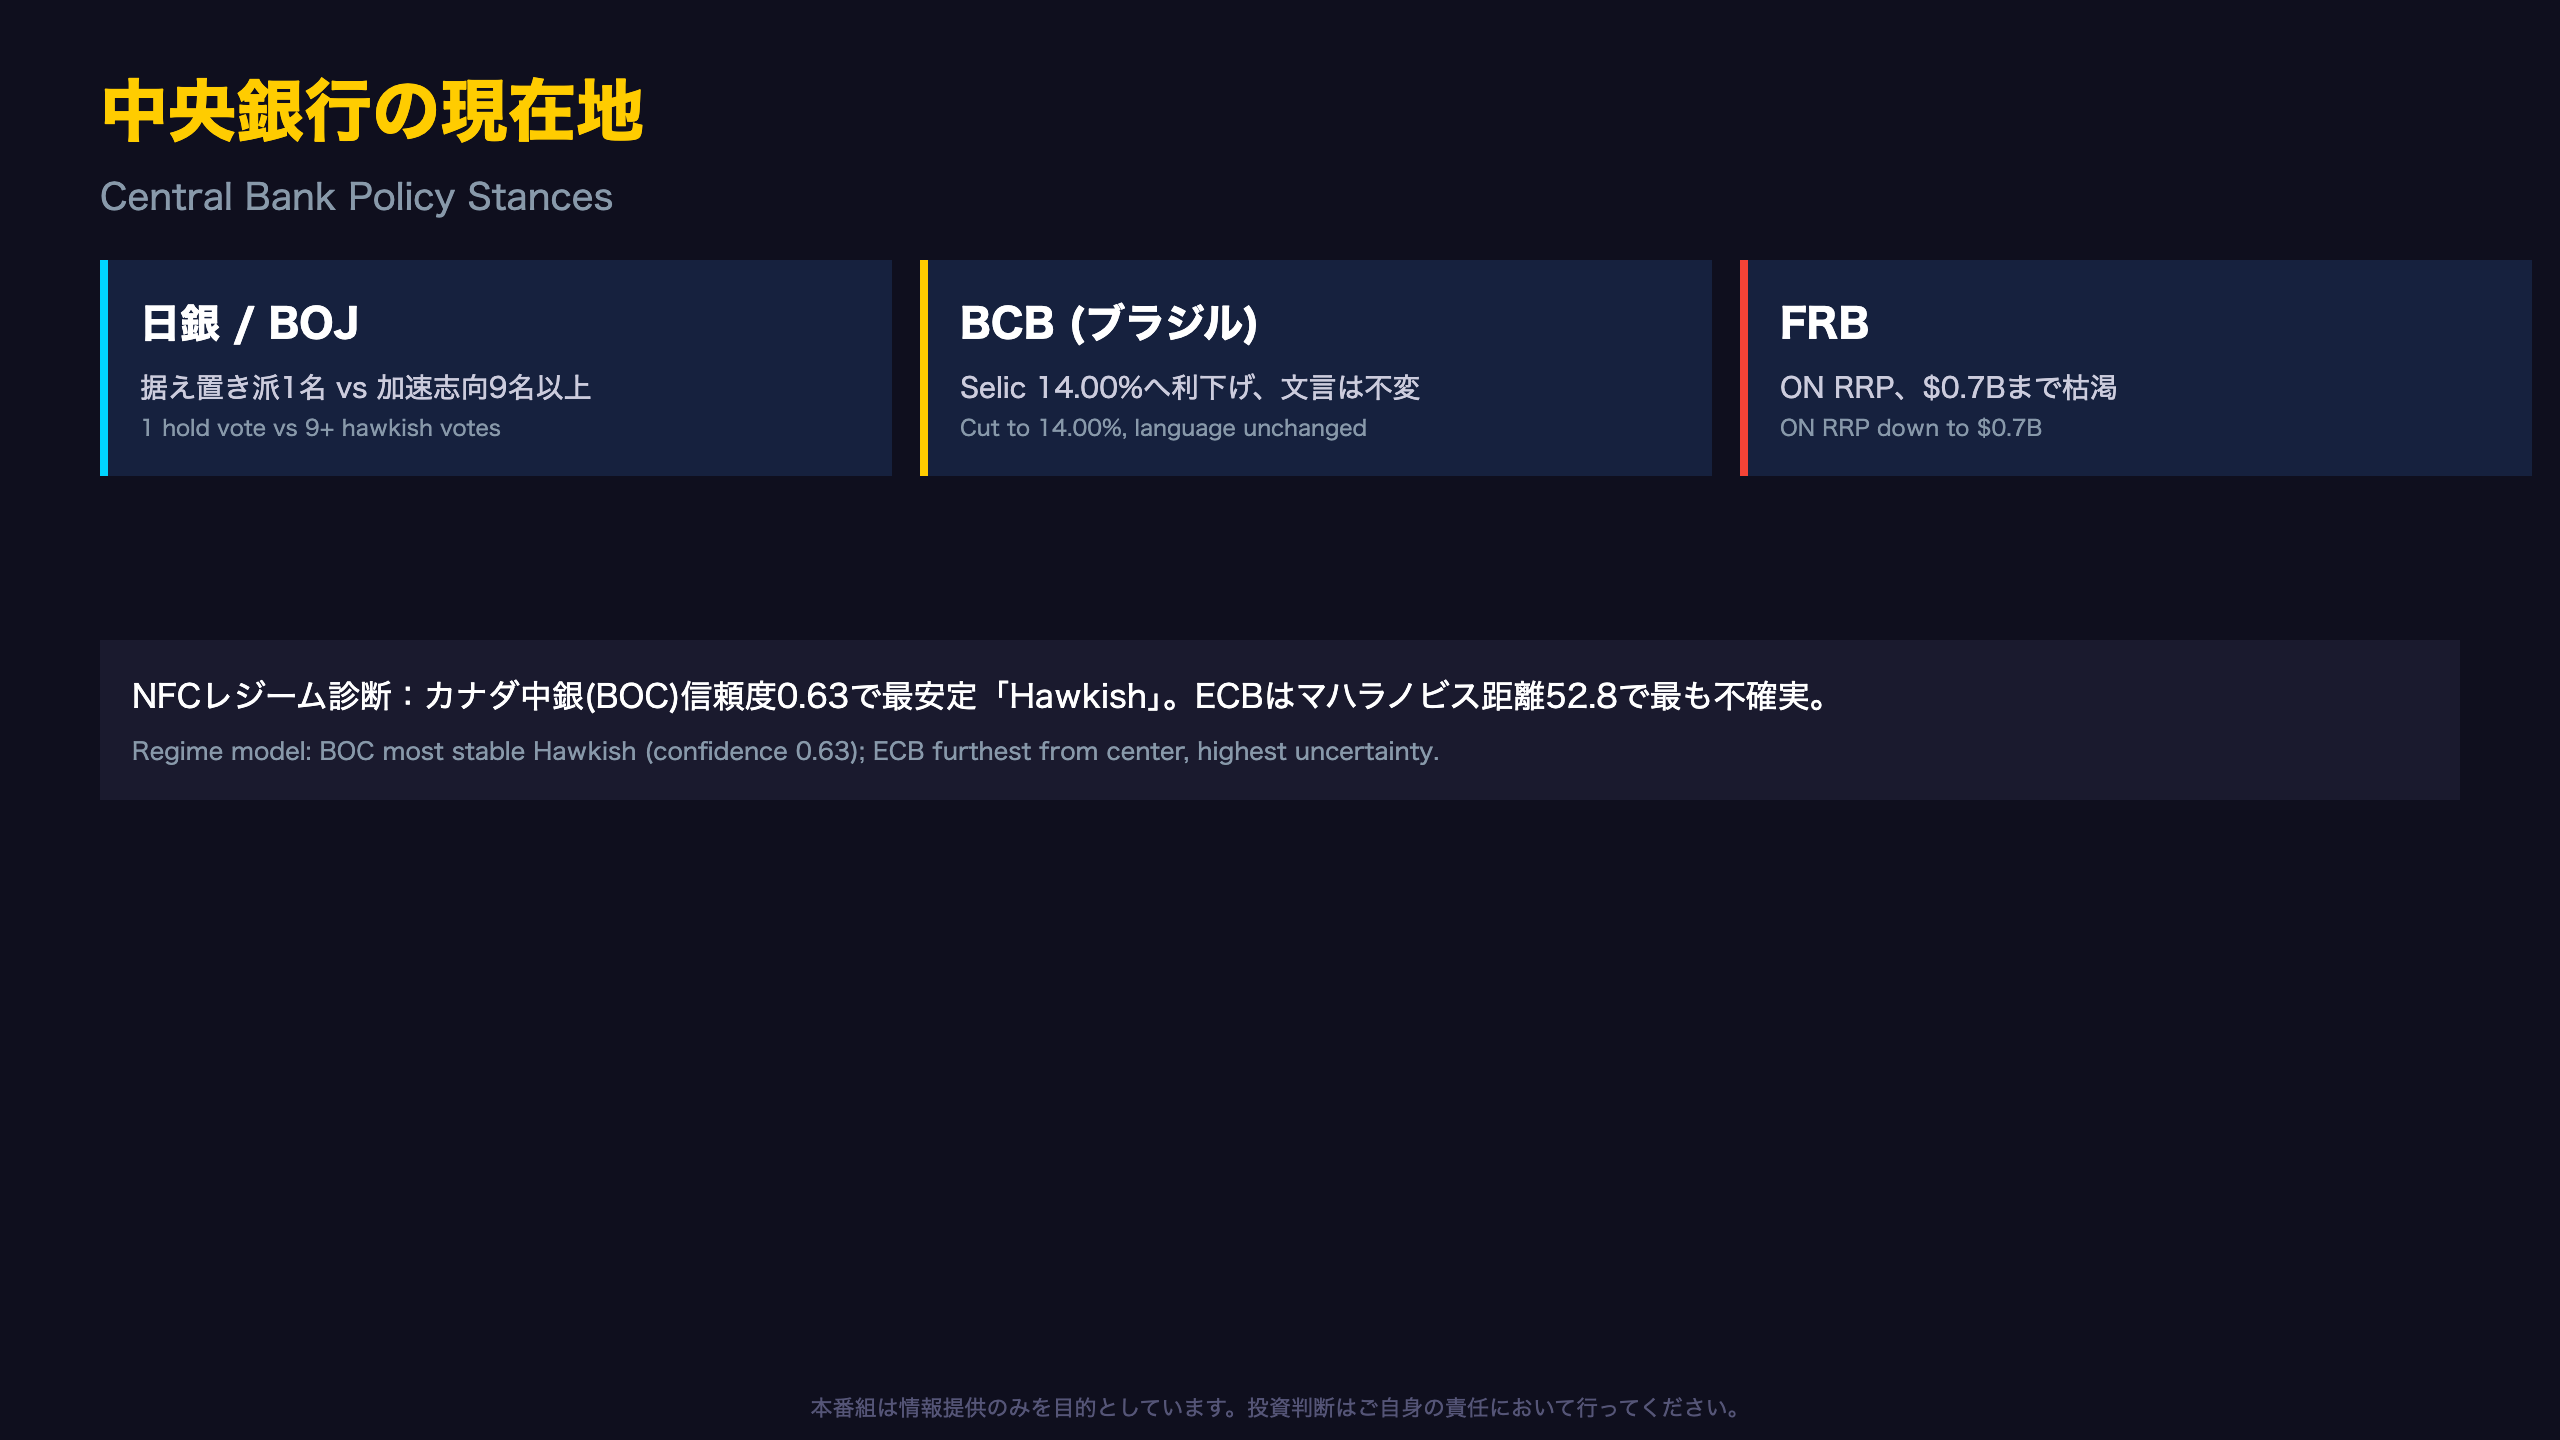
Three Central Banks, Three Shades of Hawkishness
BOJ: From Achieving 2% to Preventing Overshoot
In minutes from its July 30-31 meeting, the Bank of Japan showed a clear hawkish tilt: only one member favored holding rates, while at least nine leaned toward continuing or accelerating hikes. One member noted the policy focus has shifted from raising inflation to 2% to preventing a further overshoot.
BCB: A Hawkish Cut, Not a Pivot
Brazil’s central bank cut the Selic rate 25bp to 14.00% in a unanimous 7-0 vote, yet the key sentence on needing tightening stronger and more prolonged than previously considered appropriate was repeated verbatim from the prior meeting — a textbook hawkish cut.
The Fed: A Quietly Tightening Balance Sheet
While the Fed’s total securities holdings rose $138.95B year-on-year, T-bill holdings rose $333.1B while MBS fell $189.8B. The overnight reverse repo facility averaged just $0.7B for the week, down more than 90% from $73.7B a year earlier — a buffer that has historically absorbed Treasury cash-balance swings without squeezing bank reserves directly.
A Quick Regime Check
NFC’s proprietary 10-central-bank regime model flags the Bank of Canada as the most stable Hawkish read, with a confidence score of 0.63, the highest among all ten models tracked. The ECB sits furthest from its historical center, reflecting the highest classification uncertainty of the group.
今週の番組制作費 / Production Cost Corner
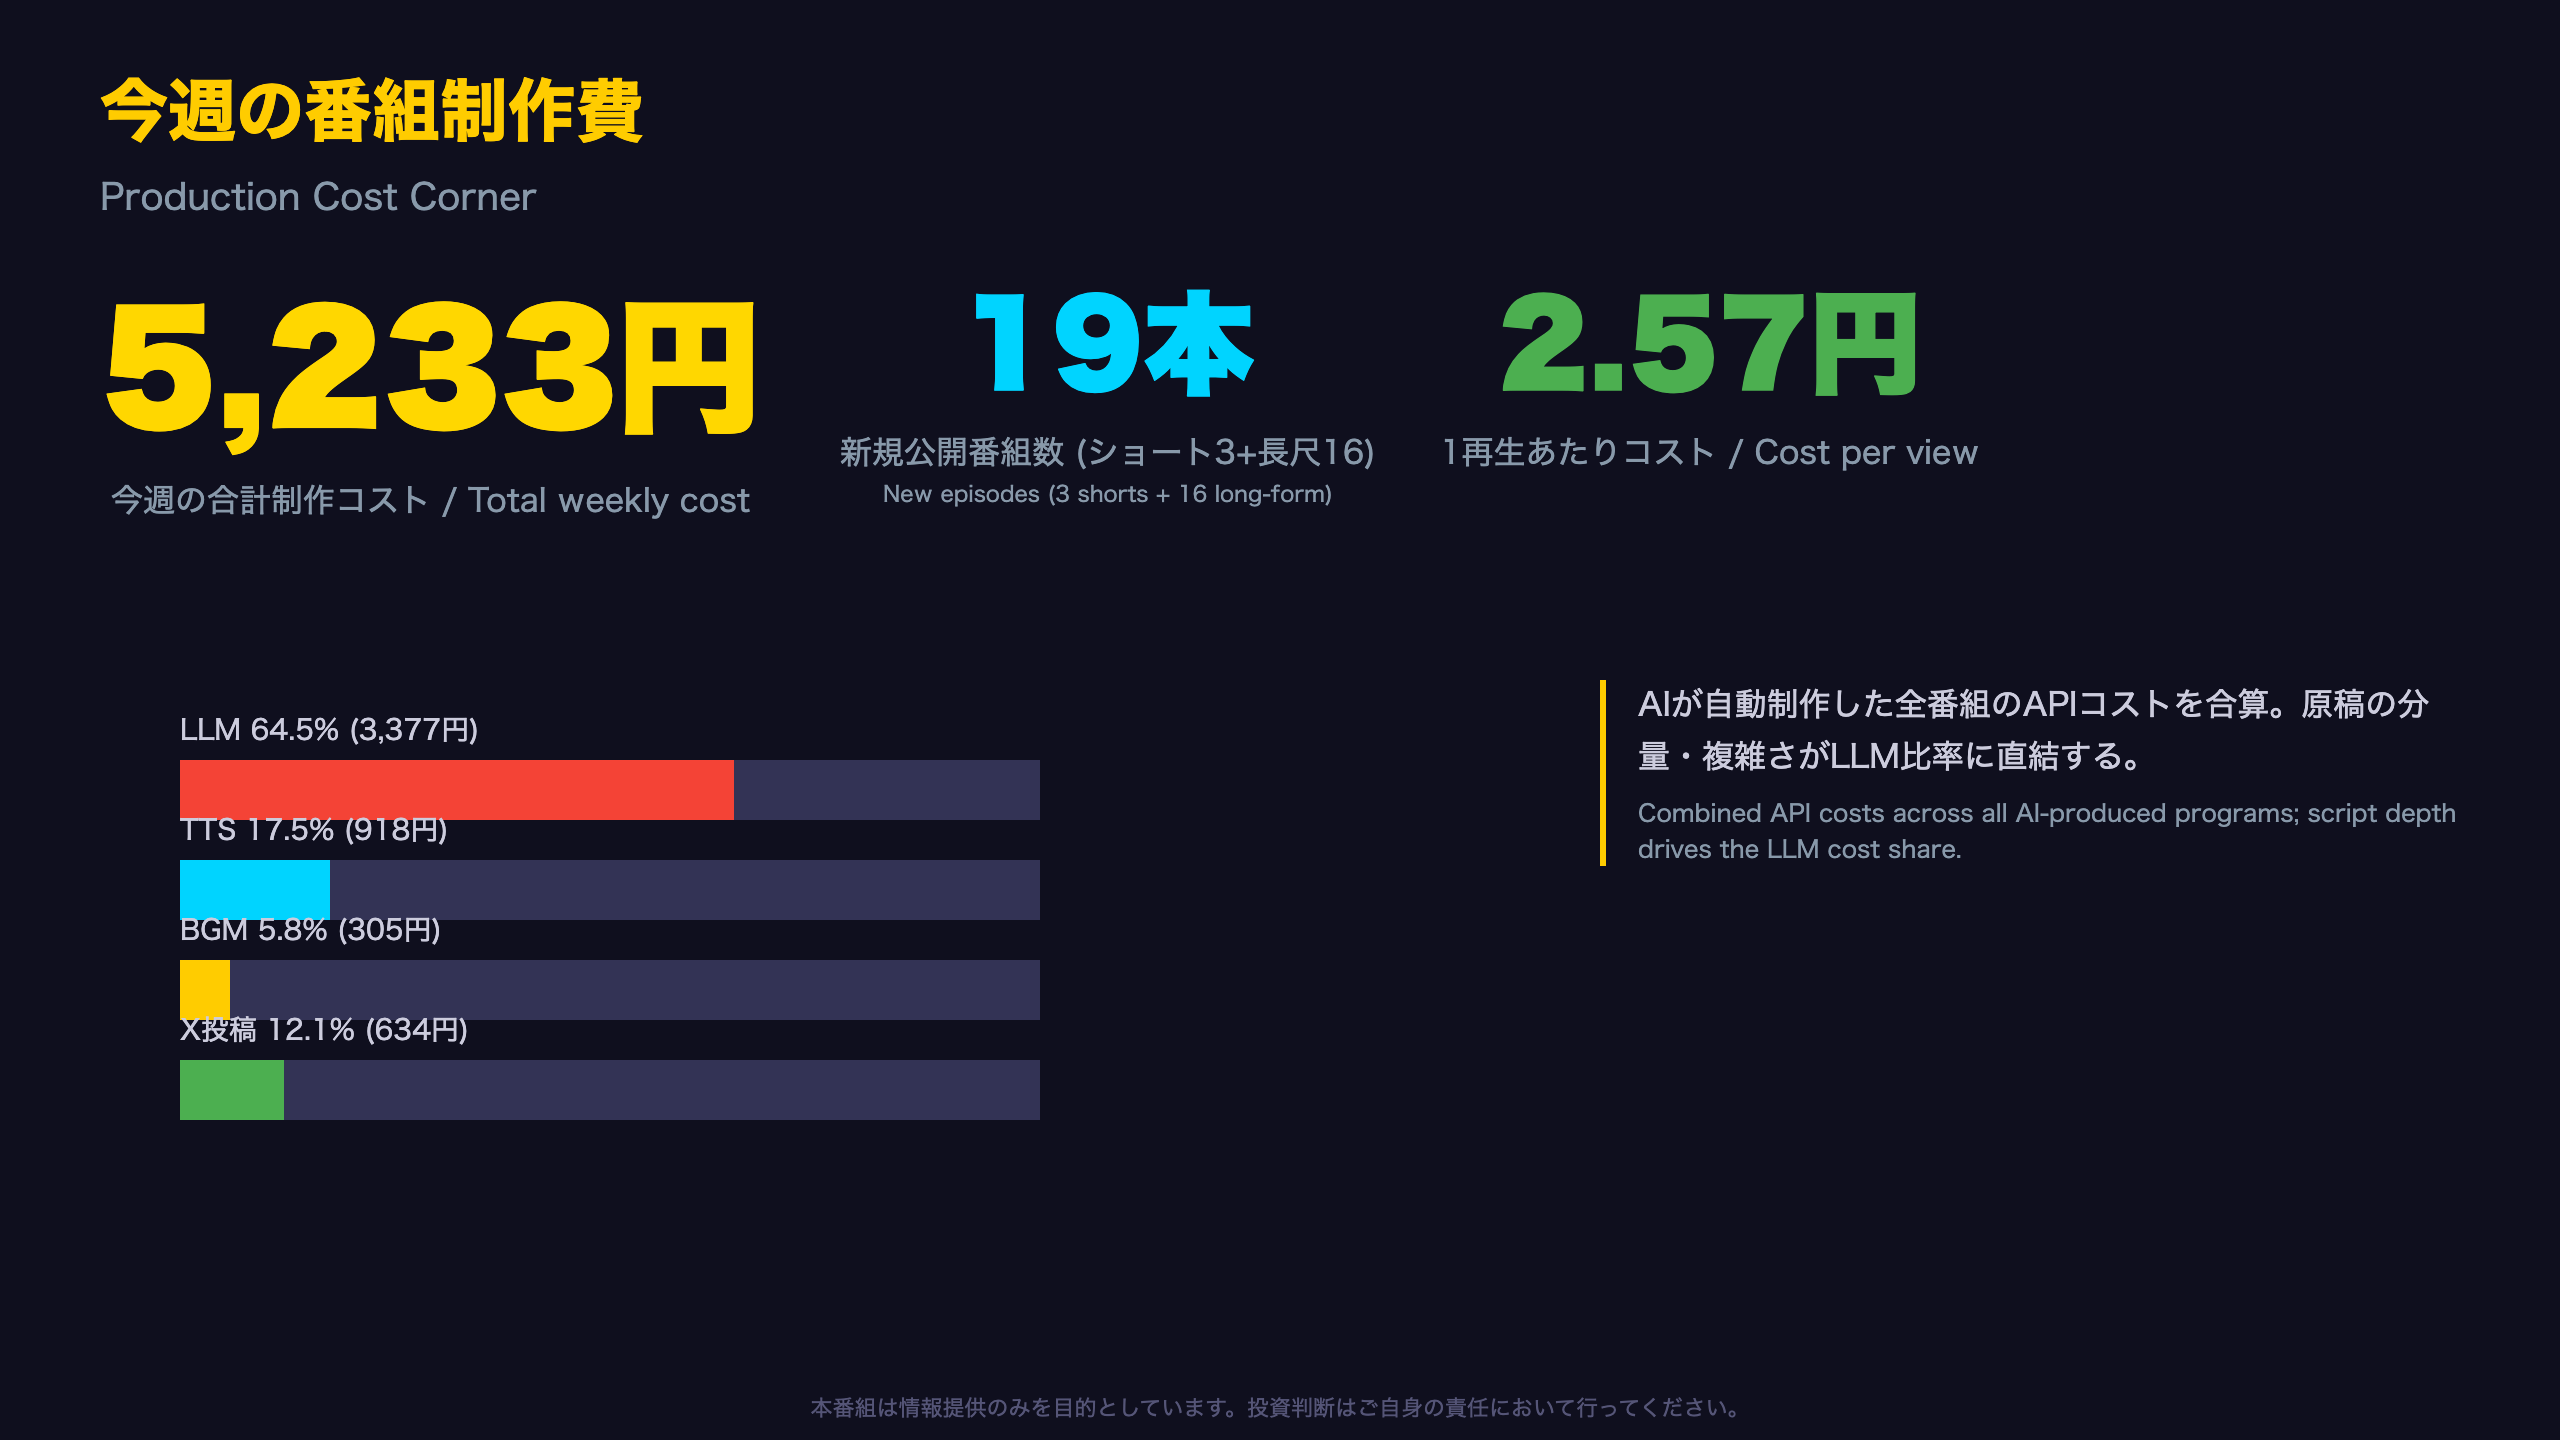
Inside This Week’s Production Costs
This week (Aug 9-15), NFC Market Live published 19 new episodes, 3 short-form and 16 long-form videos, for a total production cost of 5,233 yen.
| Category | Cost (JPY) | Share |
|---|---|---|
| LLM | ¥3,377 | 64.5% |
| TTS | ¥918 | 17.5% |
| BGM | ¥305 | 5.8% |
| Social (X) | ¥634 | 12.1% |
| Total | ¥5,233 | 100% |
Why LLM Costs Dominate
All of our shows are generated by large language models, so LLM costs scale directly with script length and analytical depth. This week’s heavier focus on deep-dive topics, including Japan’s current account swing, BOJ minutes, and Brazil’s COPOM minutes, pushed LLM costs to nearly two-thirds of the total.
Cost Efficiency Context
With 2,034 total views this week (1,564 for Shorts, 470 for long-form), cost-per-view works out to about ¥2.57. Rather than reducing program count, the more promising lever for efficiency is improving reach per episode, something being actively tested through distribution policy changes.
Full Transparency
Every number here represents actual API costs billed for AI-generated content, published weekly as part of our commitment to transparency in AI-driven financial media.
来週の注目イベントカレンダー / Next Week’s Calendar
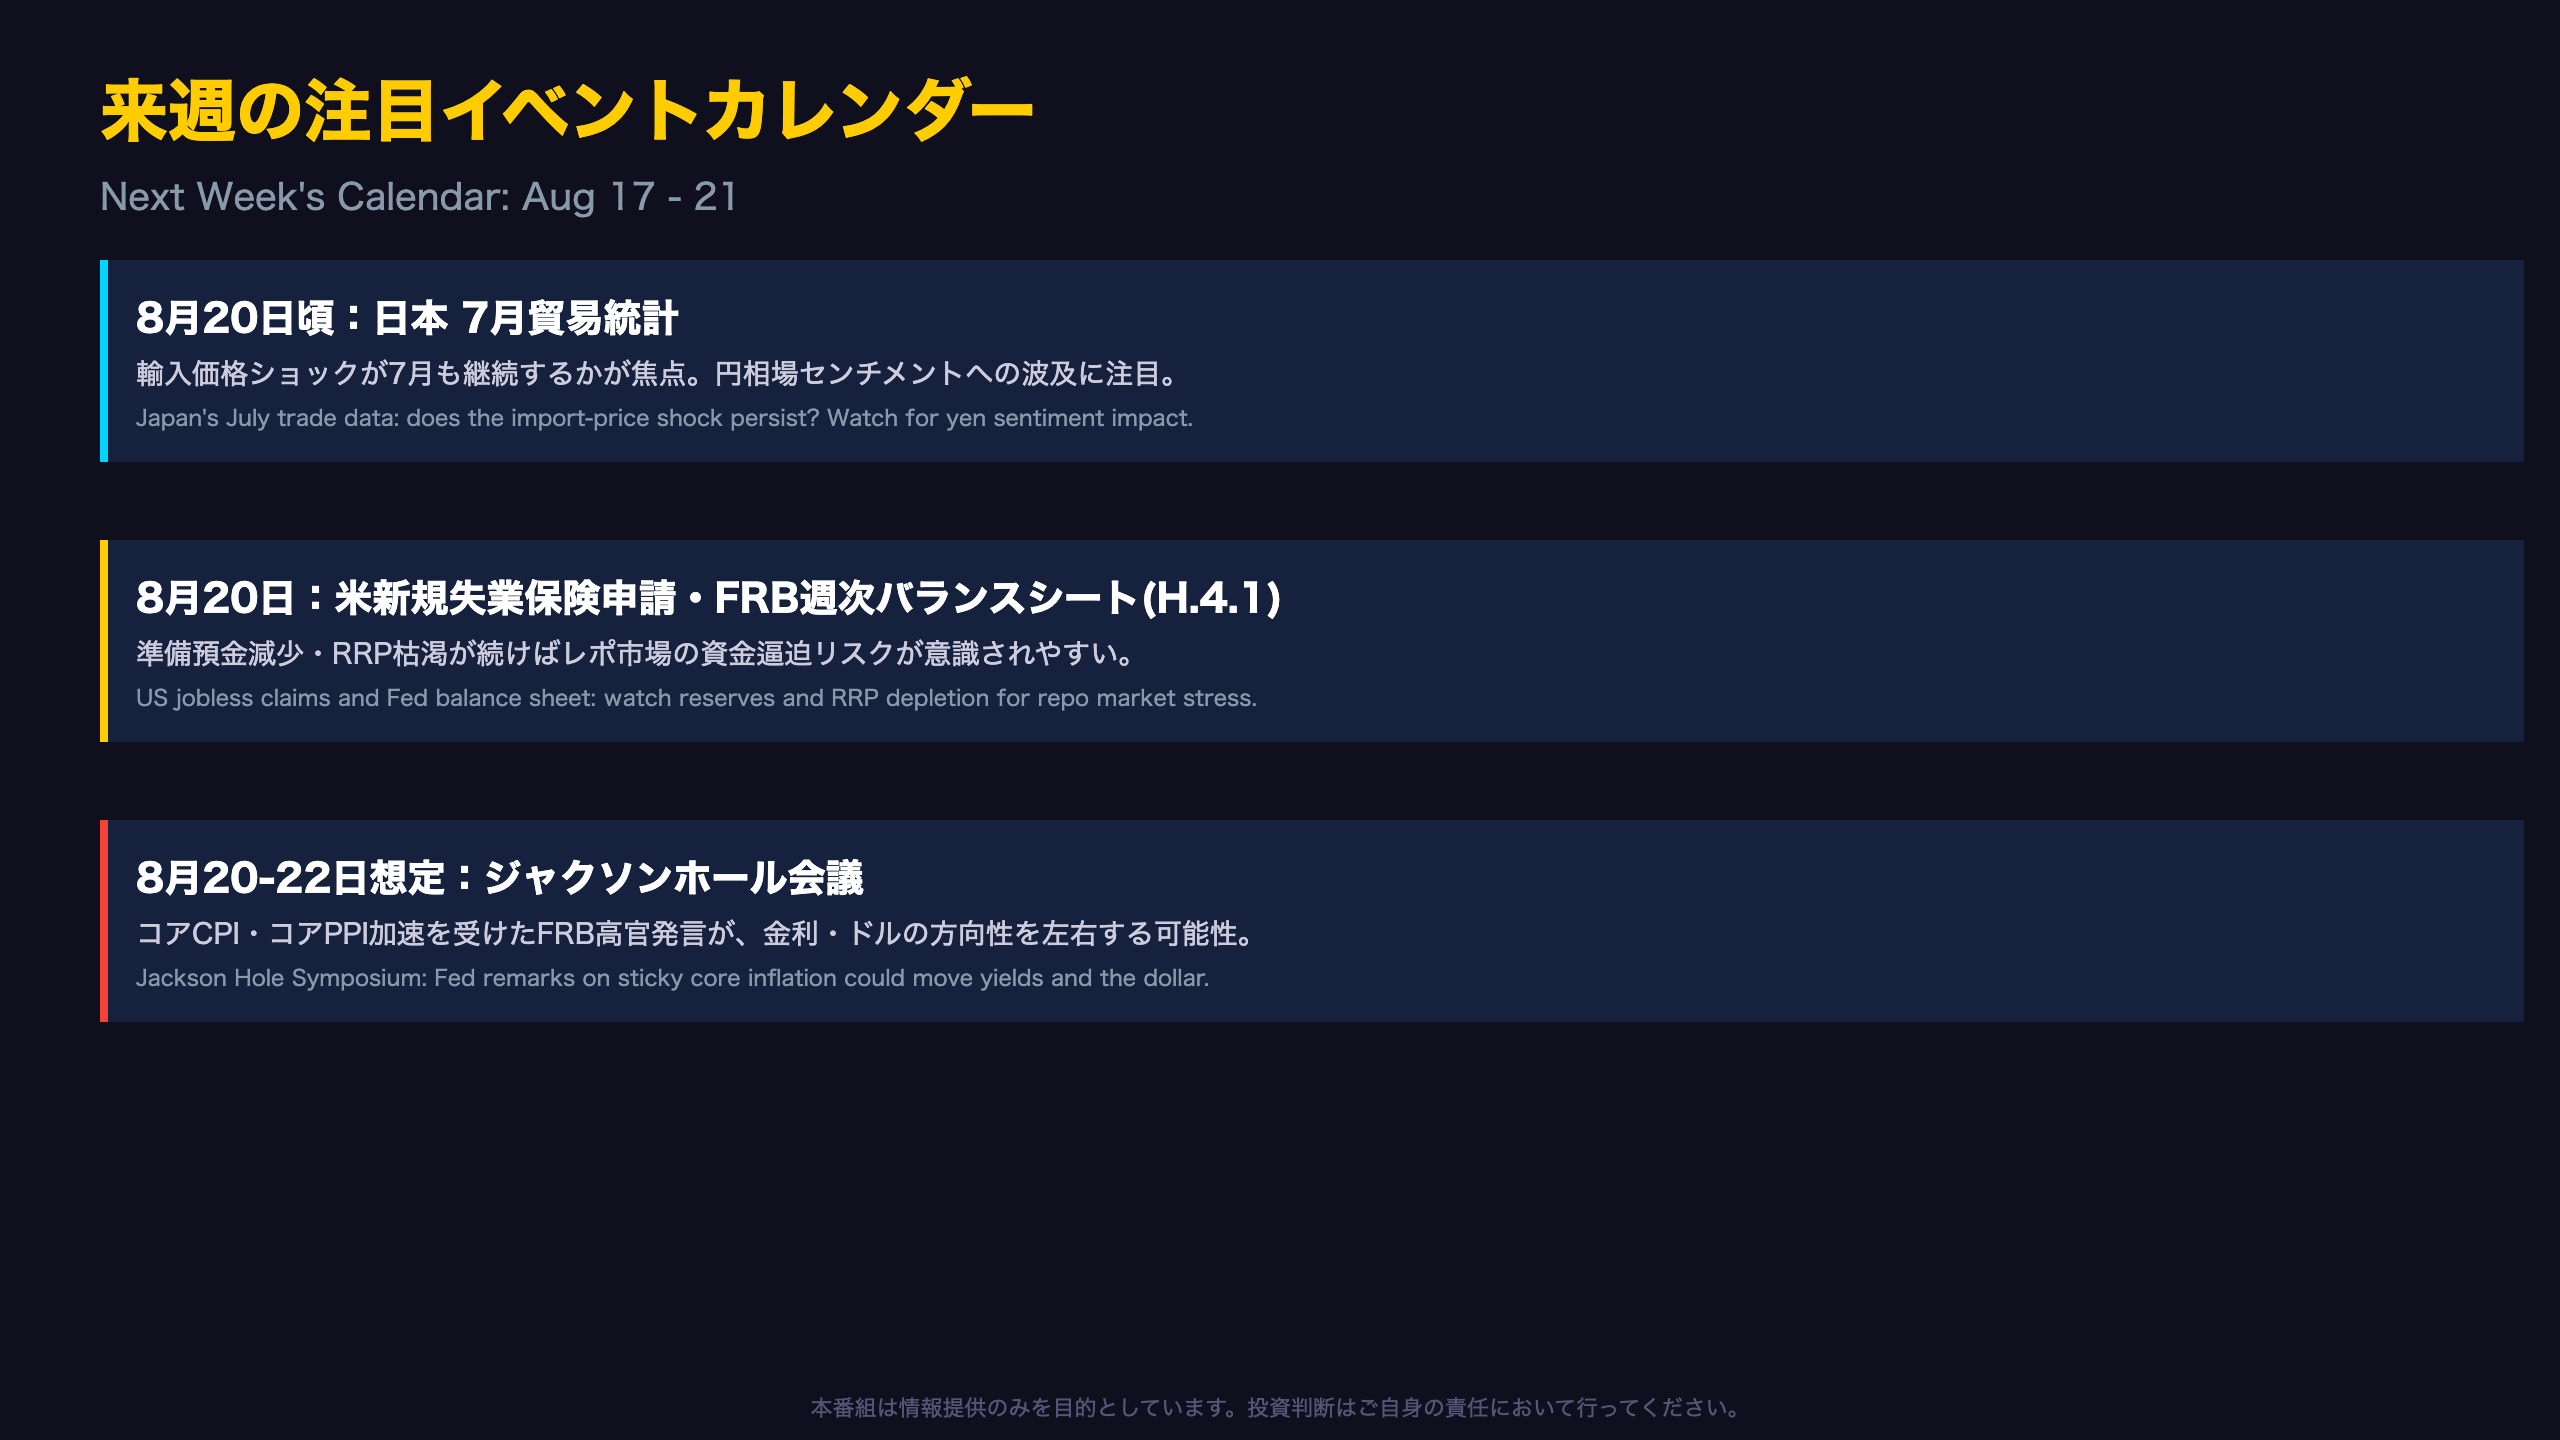
Next Week’s Watchlist: Three Chains of Reasoning
1) Japan’s July Trade Statistics (around Aug 20)
Fact: June’s trade deficit was driven almost entirely by import prices, volume rose just 1.1% while prices jumped 24.0%. Mechanism: whether July repeats this depends on crude prices and the yen. Implication: a widening deficit would reinforce concerns about Japan’s current account, potentially weighing on yen sentiment, though continuation is unconfirmed.
2) US Jobless Claims & Fed H.4.1 Data (Aug 20)
Fact: unadjusted claims rose faster than seasonal norms this week, while Fed reserves fell $376B year-on-year and ON RRP is nearly depleted. Mechanism: continued above-seasonal claims growth would prompt a labor market reassessment, while a depleted RRP raises odds that Treasury cash swings hit reserves directly. Implication: repo markets and the dollar could see added volatility.
3) Jackson Hole Symposium (expected Aug 20-22)
Fact: both US core CPI and core PPI accelerated month-on-month this week. Mechanism: it’s generally believed that Fed commentary on stickiness could push back rate-cut pricing, though this week’s data alone cannot predict what officials will say. Implication: Fed remarks at Jackson Hole are a classic catalyst for Treasury yield and dollar volatility.
The Bottom Line
Next week effectively tests three threads opened this week: whether Japan’s import-price shock persists, whether US liquidity keeps tightening, and whether the Fed leans hawkish or dovish on sticky inflation at its highest-profile venue of the year.
Disclaimer: This article is for informational purposes only. All investment decisions are made solely at your own risk.