📺 Watch the Full Video Analysis
This article was automatically generated by the NFC Market Live AI analysis system. (Updated: 2026-06-29 17:39 JST)
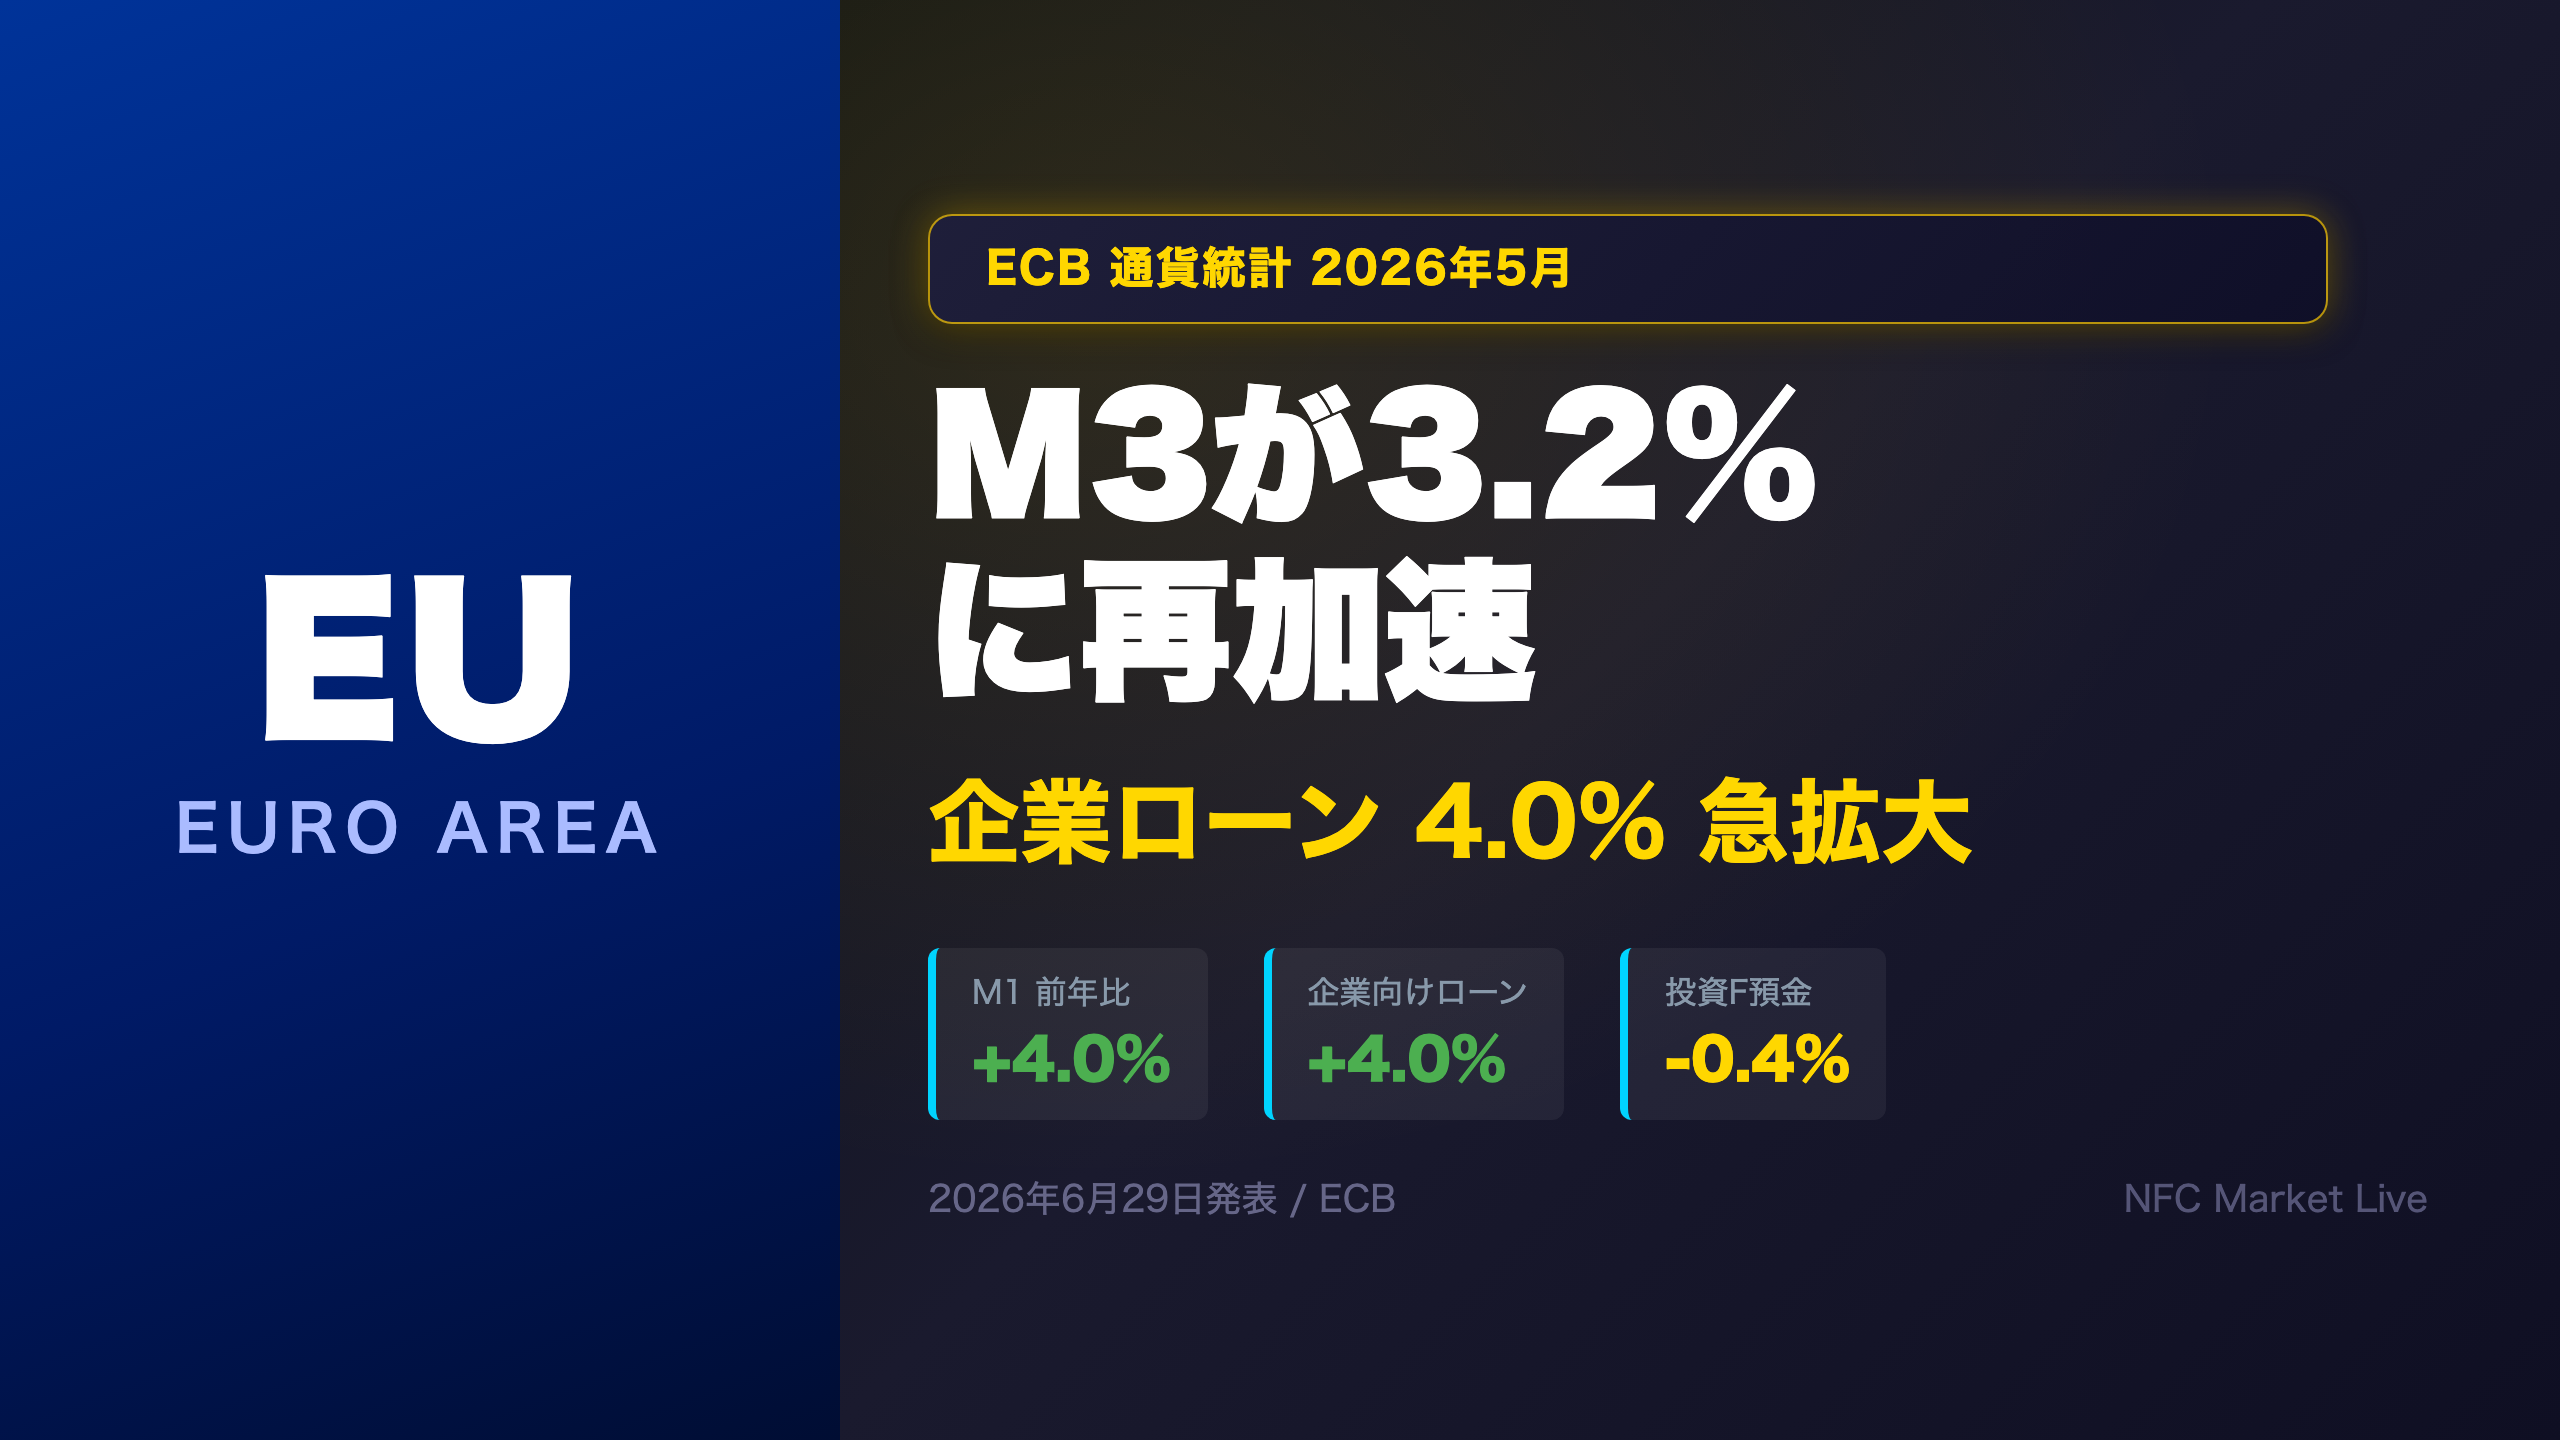
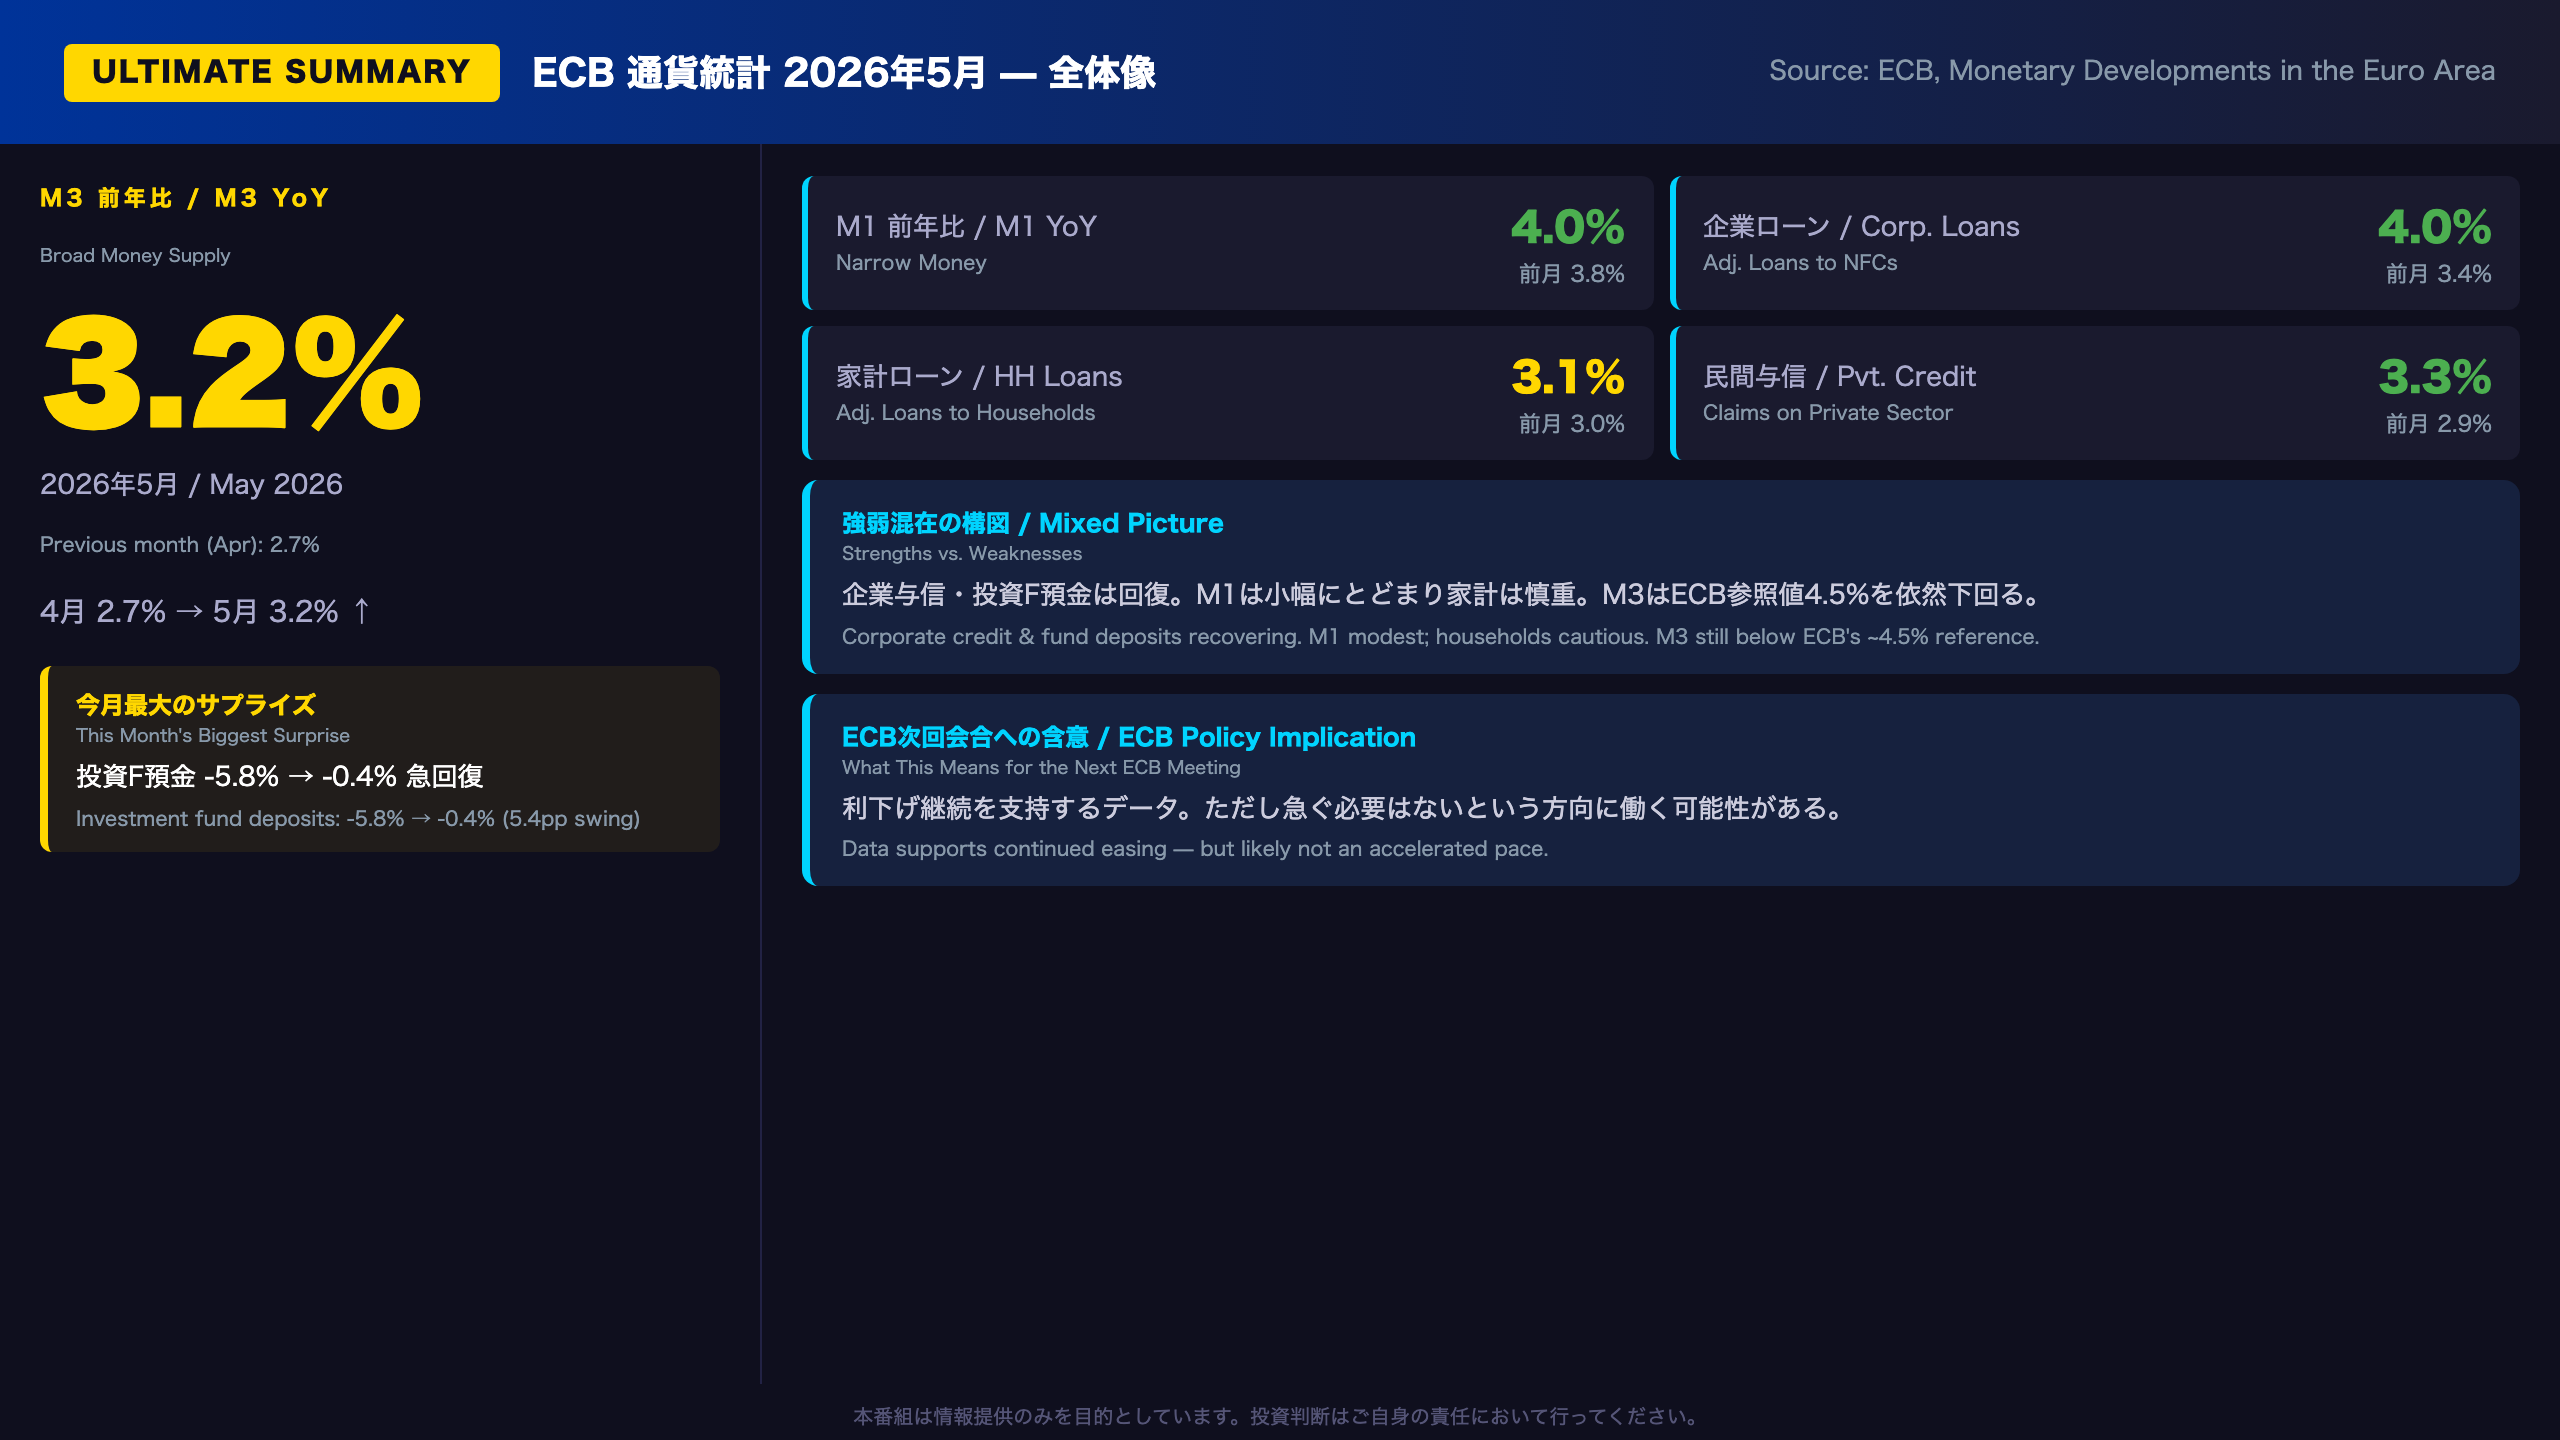
Euro area M3 money supply rebounded to 3.2% YoY in May 2026, up from 2.7% in April. Corporate loans surged to 4.0% — a potential signal that ECB rate cuts are gaining traction. Investment fund deposits staged a dramatic recovery from -5.8% to -0.4%. We break down what this means for ECB policy and EUR/JPY traders.
Ultimate Summary — 5月M3の全体像
May 2026 ECB Monetary Developments: Three Lenses on a Mixed Picture
What Is the ECB’s Monetary Developments Report?
Every month, the European Central Bank (ECB) publishes its “Monetary Developments in the Euro Area” report, which tracks the growth of money supply aggregates (M1, M2, M3) and credit flows across the 20-nation euro area. The ECB uses this data as one of two analytical pillars — alongside economic analysis — to assess inflation risks and calibrate monetary policy.
The Biggest Surprise: Investment Fund Deposits Snap Back
The most striking data point in May was the recovery in deposits placed by investment funds (excluding money market funds): from -5.8% in April to -0.4% in May — a 5.4 percentage-point swing in a single month. This likely reflects a partial normalization after the financial market volatility triggered by U.S. tariff uncertainty in April. However, the reading remains negative, so “stabilization” is a more accurate characterization than “recovery.”
M3 Trend: Stuck in the 2.7–3.2% Range
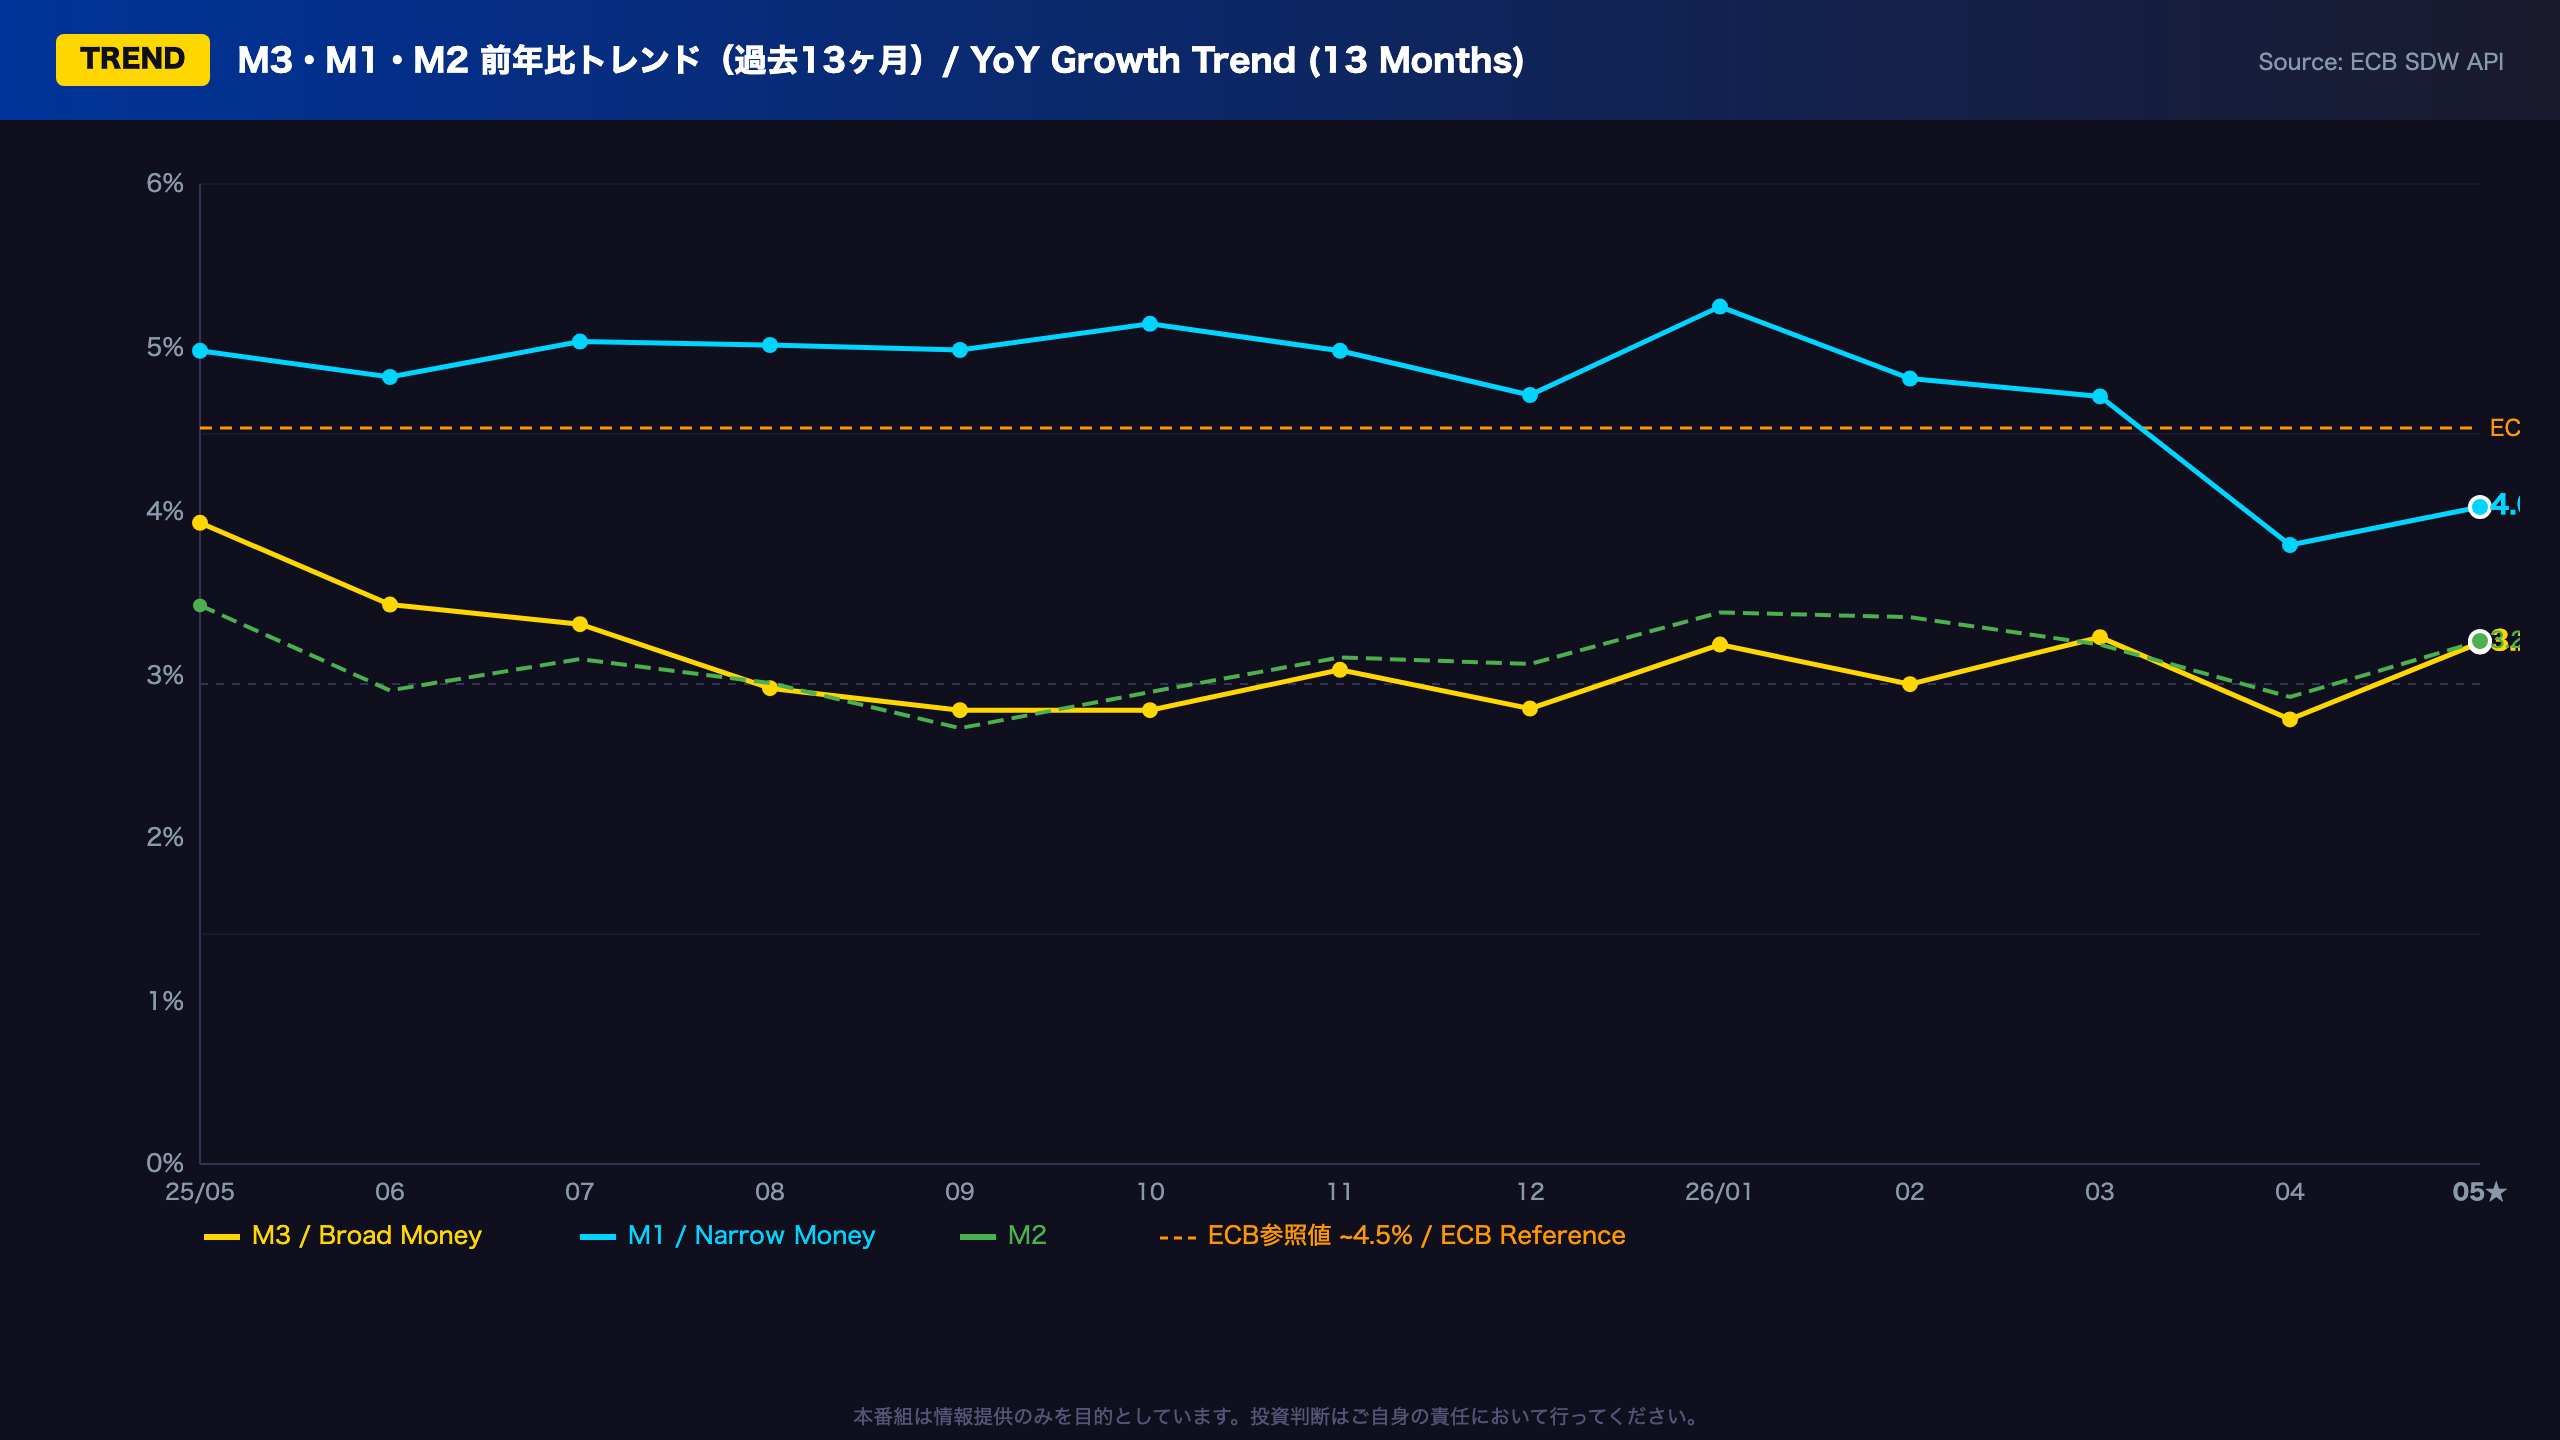
M3 has oscillated between 2.7% and 3.9% over the past 12 months, well below the ECB’s historical reference value of approximately 4.5% — a benchmark the ECB used during the pre-2008 era to signal neutral monetary conditions. The persistent gap suggests that the ECB’s prior rate hikes (which brought the deposit rate to 4.0% in 2023) continue to exert a dampening effect on broad money creation.
For comparison, the U.S. Federal Reserve monitors M2 growth, which has also been subdued. The ECB’s M3 trajectory is broadly consistent with a disinflationary environment, though not deflationary.
Corporate vs. Household Credit: A Divergence Worth Watching
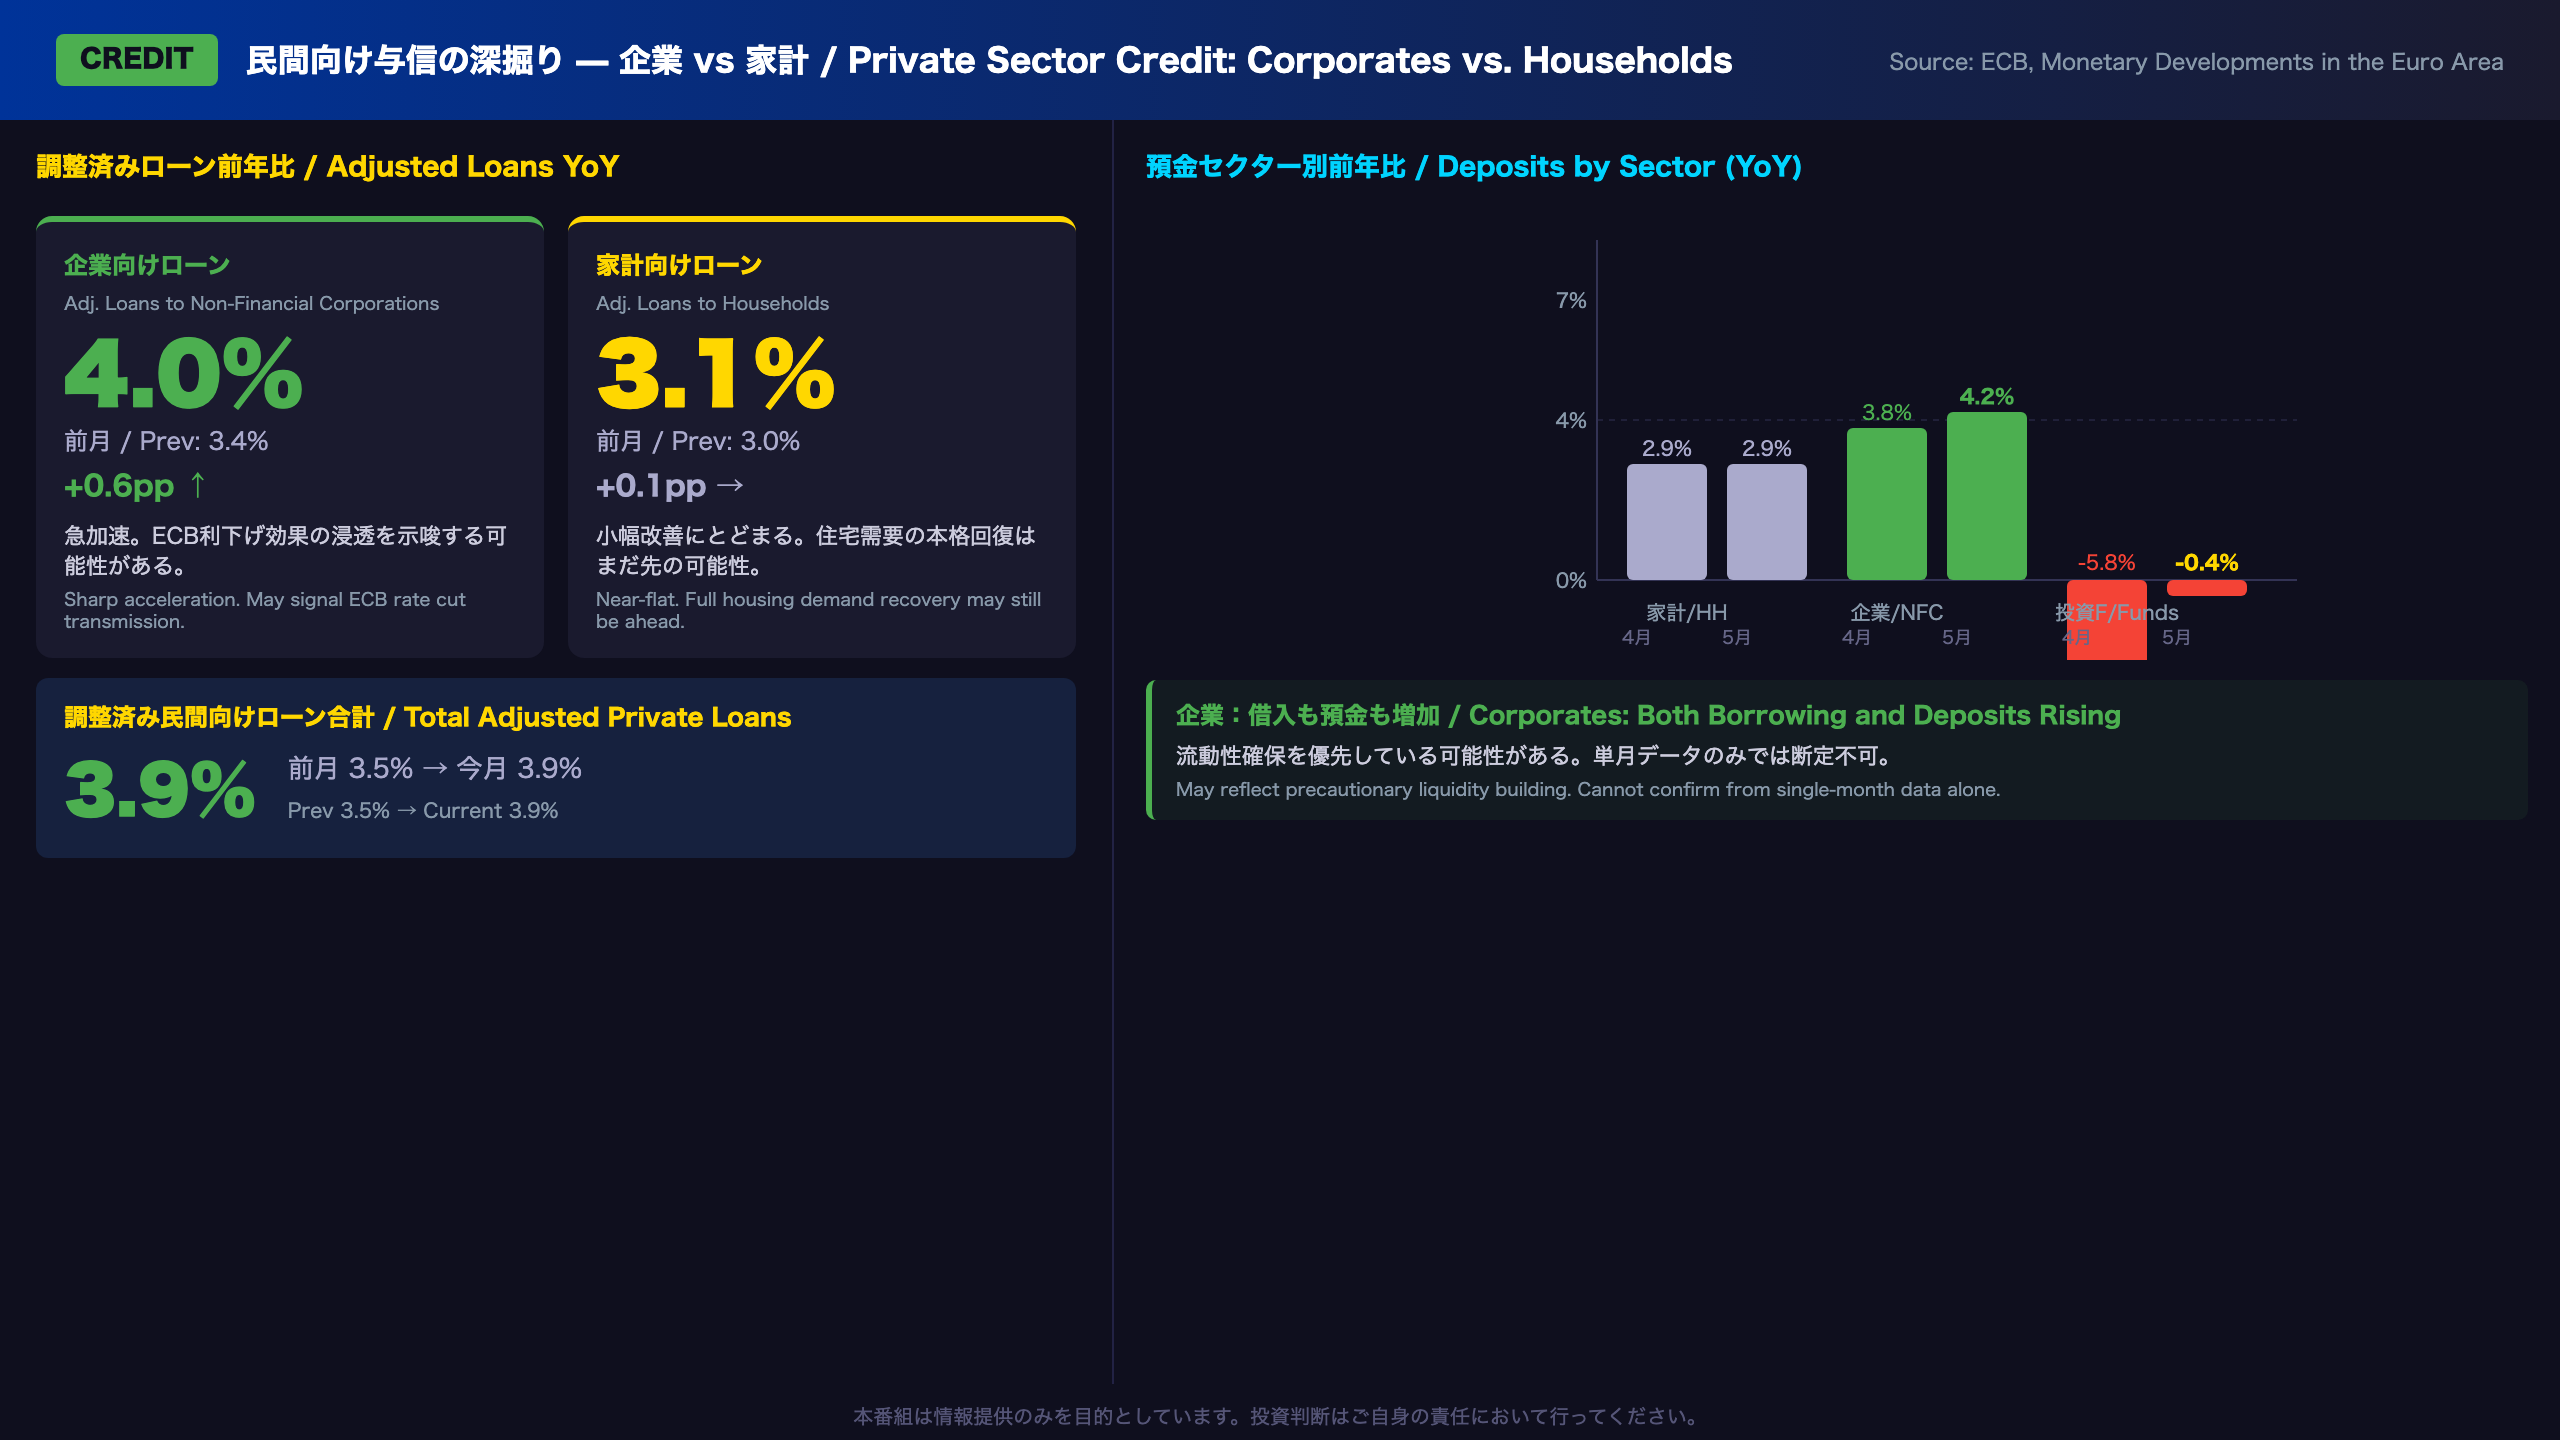
- Adjusted loans to non-financial corporations: 3.4% → 4.0% (+0.6pp) — strongest in roughly two years
- Adjusted loans to households: 3.0% → 3.1% (+0.1pp) — near-flat
The corporate credit acceleration is the most policy-relevant signal in this report. It suggests that ECB rate cuts (the deposit rate has been reduced from 4.0% to approximately 2.25% by mid-2026) are beginning to stimulate business borrowing. However, a single month of data is insufficient to confirm a structural trend.
Market Implications for EUR/JPY
The asymmetry between ECB easing and BOJ tightening remains the dominant macro driver for EUR/JPY. This report, while showing credit improvement, does not materially alter the ECB’s easing bias. If M3 remains below 3.5% and household credit stays subdued, the ECB is likely to continue gradual rate cuts — a headwind for EUR against a yen that may benefit from BOJ normalization.
M3・M1・M2 トレンド分析(過去12ヶ月)
M3, M2, M1 Trend Analysis: Reading 12 Months of Context
The M1 Rollercoaster: From 5.25% to 3.79% and Back
M1 — the narrowest money aggregate comprising currency in circulation and overnight deposits — tells the most dynamic story over the past year. After peaking at 5.25% in January 2026, it plunged to 3.79% in April, a drop of nearly 1.5 percentage points in just three months. May’s partial recovery to 4.02% is a positive sign but leaves M1 well below its recent peak.
Two interpretations are plausible:
Bull case: Households are rationally shifting funds from low-yield overnight deposits into higher-yielding term deposits (captured in M2-M1) or marketable instruments (M3-M2). Total money (M3) is stable — the composition is simply shifting toward yield-seeking instruments.
Bear case: The decline in M1 could reflect reduced liquidity demand, potentially signaling weaker consumer spending intentions. M1 is sometimes used as a leading indicator of consumption activity in the euro area.
Given that ECB rate cuts have been ongoing, the most likely explanation is a combination of both: some yield-seeking behavior plus some genuine moderation in household spending appetite.
M2-M1 and M3-M2: The Composition Shift
- M2-M1 (short-term time deposits): 0.9% → 1.4% — still accelerating despite ECB cuts, suggesting term deposit rates remain attractive
- M3-M2 (marketable instruments): 0.9% → 3.2% — dramatic acceleration, consistent with the recovery in investment fund deposits
What to Watch Next
The key question for June data (due late July 2026) is whether M1 can sustain its recovery above 4%. If ECB rate cuts continue to reduce term deposit attractiveness, funds may flow back into overnight deposits, pushing M1 higher — a potentially positive signal for consumer spending.
M3対価構成の深掘り — 前月比で最も変化した項目
Decomposing M3 Counterparts: What’s Really Driving Euro Money Growth?
Understanding M3 Counterparts
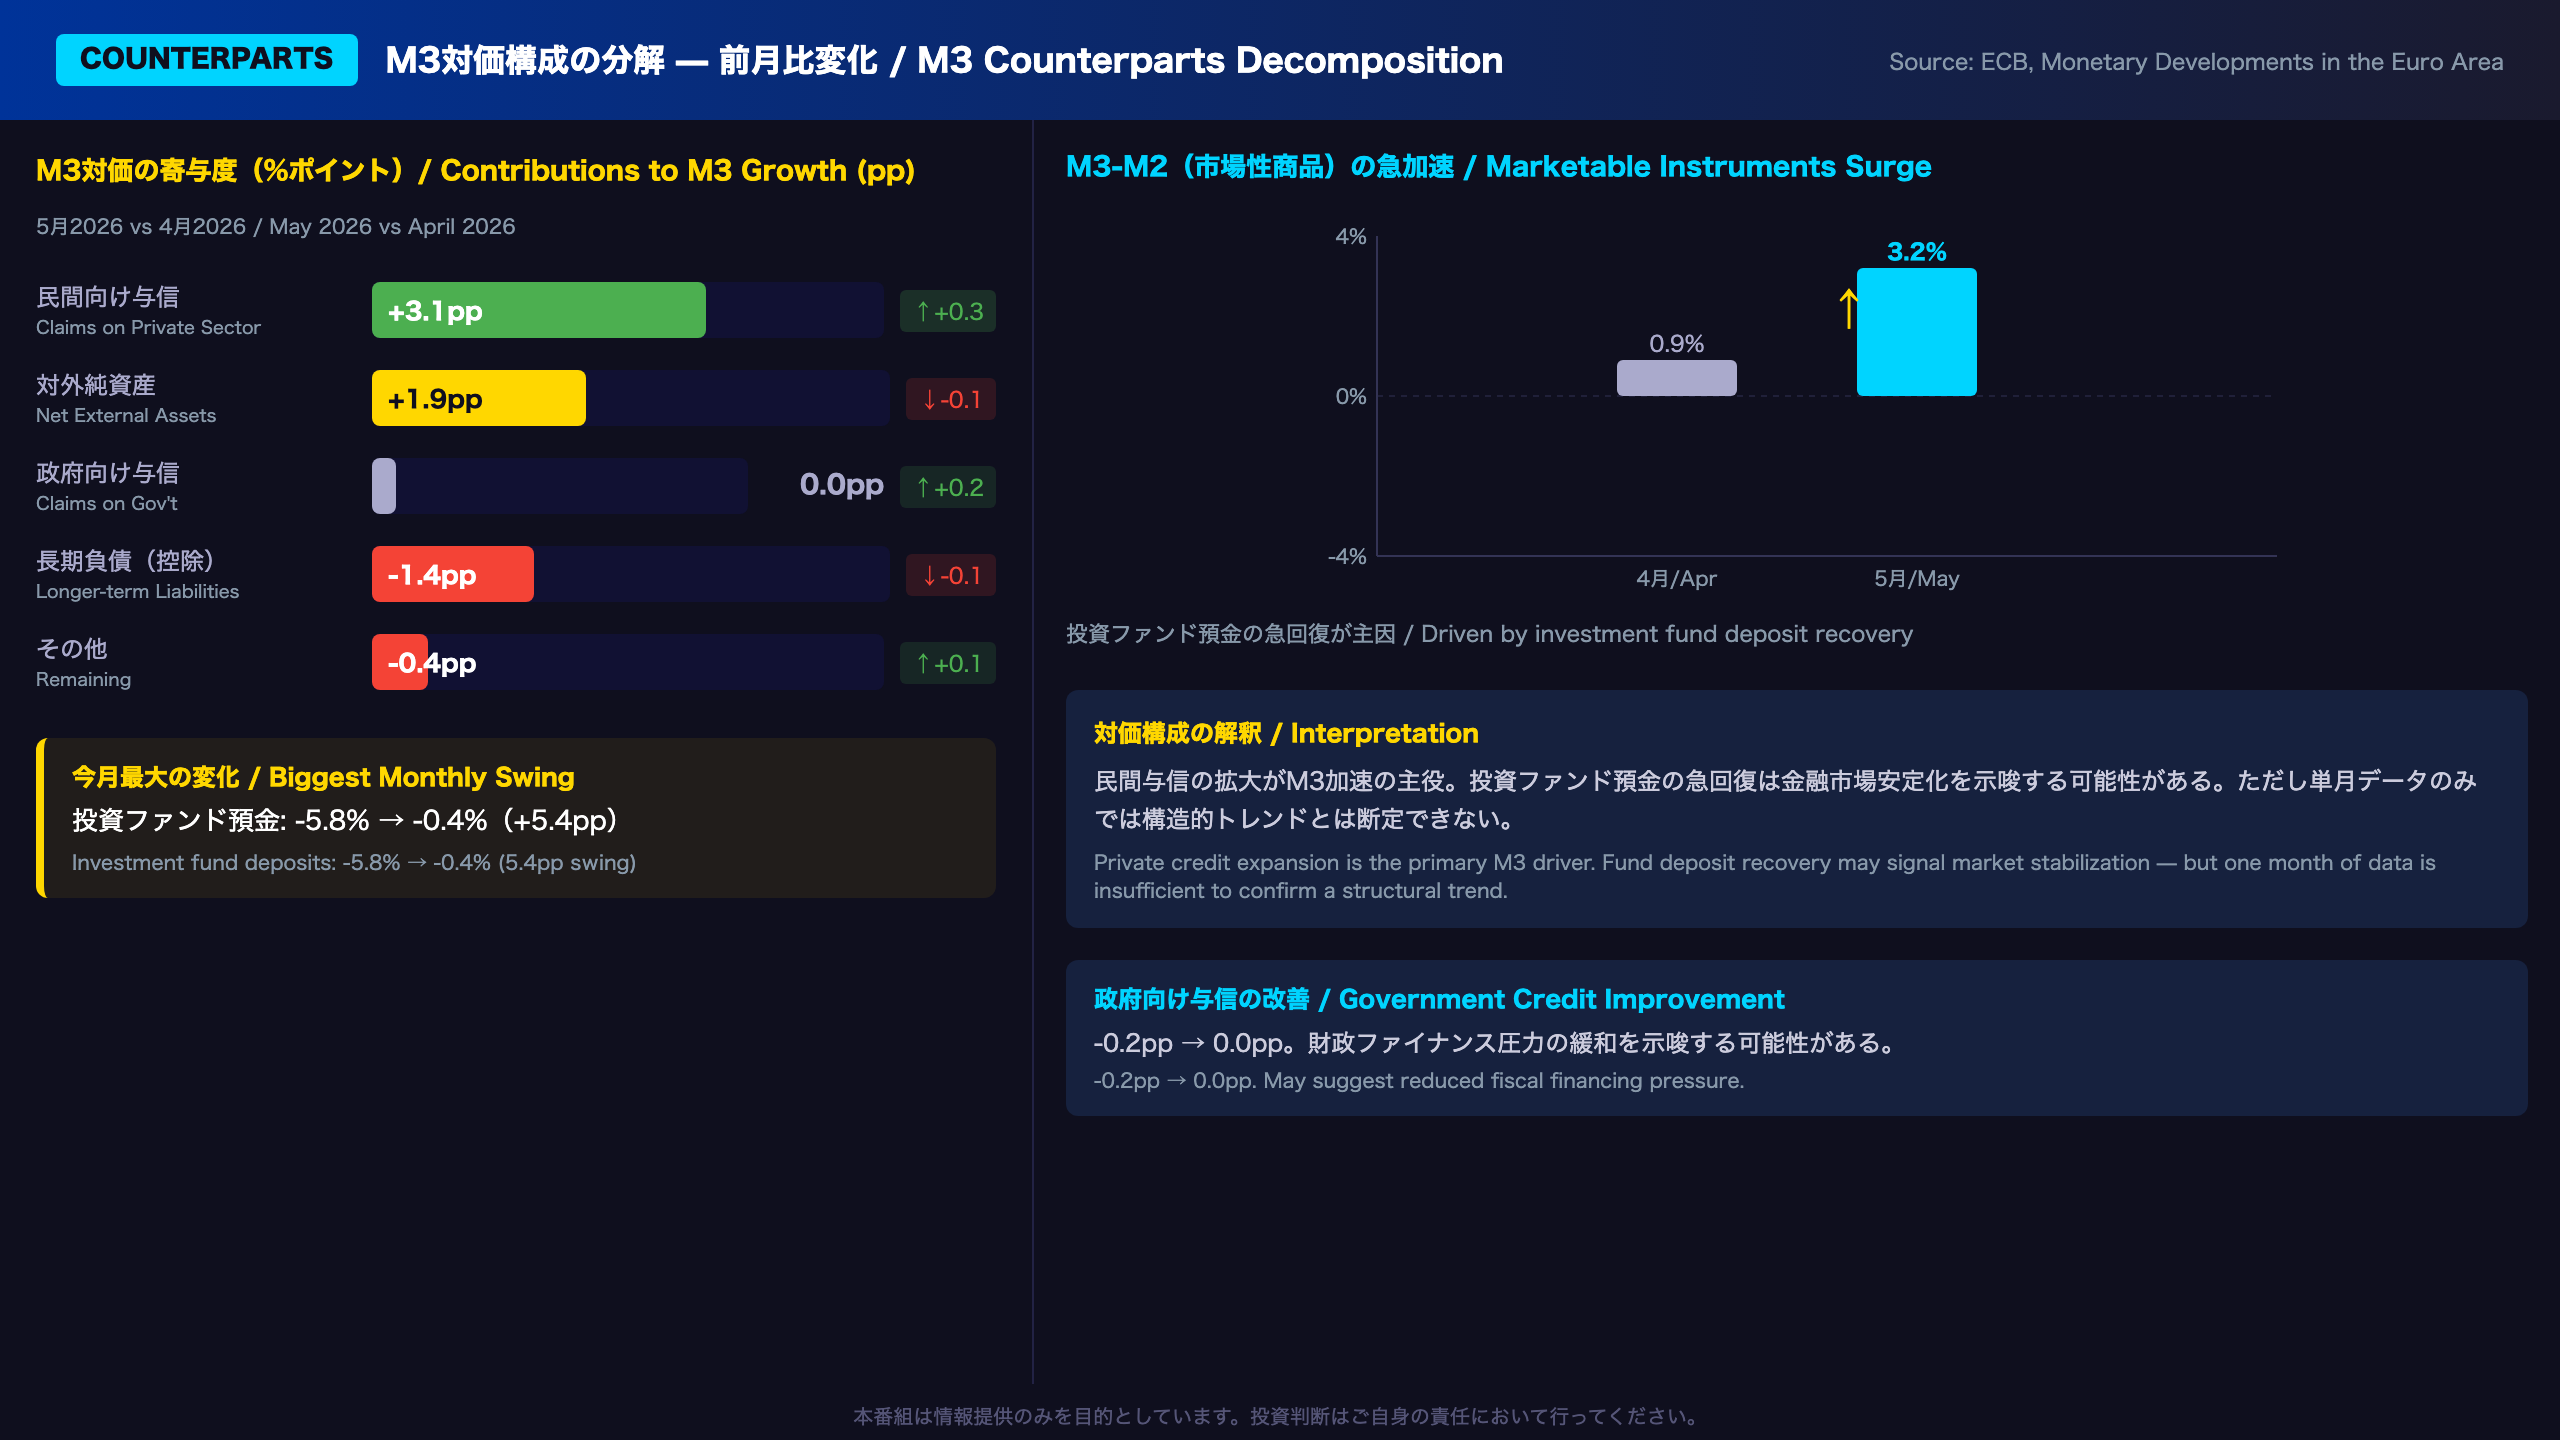
The “counterparts of M3” framework decomposes M3 growth into its balance-sheet drivers. In simple terms: M3 grows when banks extend more credit to the private sector, when net external assets increase (capital inflows), or when government borrowing from banks rises. It shrinks when banks issue more long-term bonds (longer-term liabilities) or when capital flows out.
May 2026 Counterpart Breakdown
| Component | Apr Contribution | May Contribution | Change |
|---|---|---|---|
| Claims on private sector | +2.8pp | +3.1pp | +0.3pp ↑ |
| Net external assets | +2.0pp | +1.9pp | -0.1pp ↓ |
| Claims on general government | -0.2pp | 0.0pp | +0.2pp ↑ |
| Longer-term liabilities | -1.3pp | -1.4pp | -0.1pp ↓ |
| Remaining counterparts | -0.5pp | -0.4pp | +0.1pp ↑ |
The Standout Move: Investment Fund Deposits
The most dramatic single-month swing was in marketable instruments (M3-M2), driven by investment fund deposits recovering from -5.8% to -0.4% year-on-year. This 5.4 percentage-point reversal likely reflects the partial normalization of European financial markets after the April volatility triggered by U.S. tariff uncertainty. However, the reading remains negative — this is stabilization, not a full recovery.
Private Credit: The Main Engine
The expansion in claims on the private sector — from 2.8pp to 3.1pp contribution — is the primary driver of M3 acceleration. This is the most policy-relevant signal: ECB rate cuts appear to be stimulating borrowing demand.
Government Credit: From Drag to Neutral
The improvement in claims on general government (from -0.2pp to 0.0pp) suggests reduced fiscal drag on M3. This could reflect changes in government bond issuance patterns or bank portfolio adjustments.
民間向け与信の深掘り — 企業 vs 家計
Private Sector Credit Deep Dive: The Corporate-Household Divergence
What Are “Adjusted Loans”?
The ECB reports “adjusted loans” — figures stripped of the distorting effects of loan securitization and notional cash pooling. This gives a cleaner picture of underlying credit demand than raw loan data.
Corporate Loan Surge: Signal or Noise?
Adjusted loans to non-financial corporations (NFCs) accelerated from 3.4% to 4.0% year-on-year — the sharpest monthly gain in recent months. Two interpretations:
Bull case: ECB rate cuts (deposit facility rate reduced from 4.0% in mid-2023 to approximately 2.25% by mid-2026) are finally lowering borrowing costs enough to stimulate genuine business investment. This is the “monetary policy transmission” story the ECB has been waiting for.
Bear case: The corporate borrowing surge may reflect working capital financing needs driven by cost pressures (energy, wages) rather than productive investment. If so, it signals stress rather than expansion. Without breakdown data on loan purpose, this cannot be resolved from the press release alone.
Household Credit: Still Subdued
Adjusted loans to households grew only 3.0% → 3.1% — a near-flat reading. Despite ECB rate cuts reducing mortgage rates, housing affordability constraints and cautious consumer sentiment appear to be limiting demand. This is consistent with the modest M1 recovery, suggesting households remain in a “wait and see” mode.
Deposit Sector Breakdown: A Nuanced Picture
| Sector | Apr YoY | May YoY | Change |
|---|---|---|---|
| Households | 2.9% | 2.9% | flat |
| Non-financial corporations | 3.8% | 4.2% | +0.4pp |
| Investment funds (ex-MMF) | -5.8% | -0.4% | +5.4pp |
The fact that corporations are simultaneously increasing both borrowing and deposits is intriguing — it could suggest precautionary liquidity building rather than active investment deployment. However, this interpretation requires more data to confirm.
International Context
For comparison, U.S. commercial and industrial loan growth has been running at roughly 2-4% YoY in early 2026. Euro area corporate credit at 4.0% is therefore broadly comparable, suggesting that the ECB’s easing cycle is achieving a transmission effect similar to the Fed’s prior easing.
ECB金融政策との対話 — 利下げサイクルの現在地
ECB Policy Dialogue: Where Are We in the Easing Cycle?
The ECB’s Two-Pillar Framework
The ECB’s monetary policy analysis rests on two pillars: economic analysis (growth, inflation, labor market) and monetary and financial analysis (M3, credit, financial conditions). This monthly monetary statistics report feeds directly into the second pillar.
M3 vs. ECB Reference Value: The 1.3pp Gap
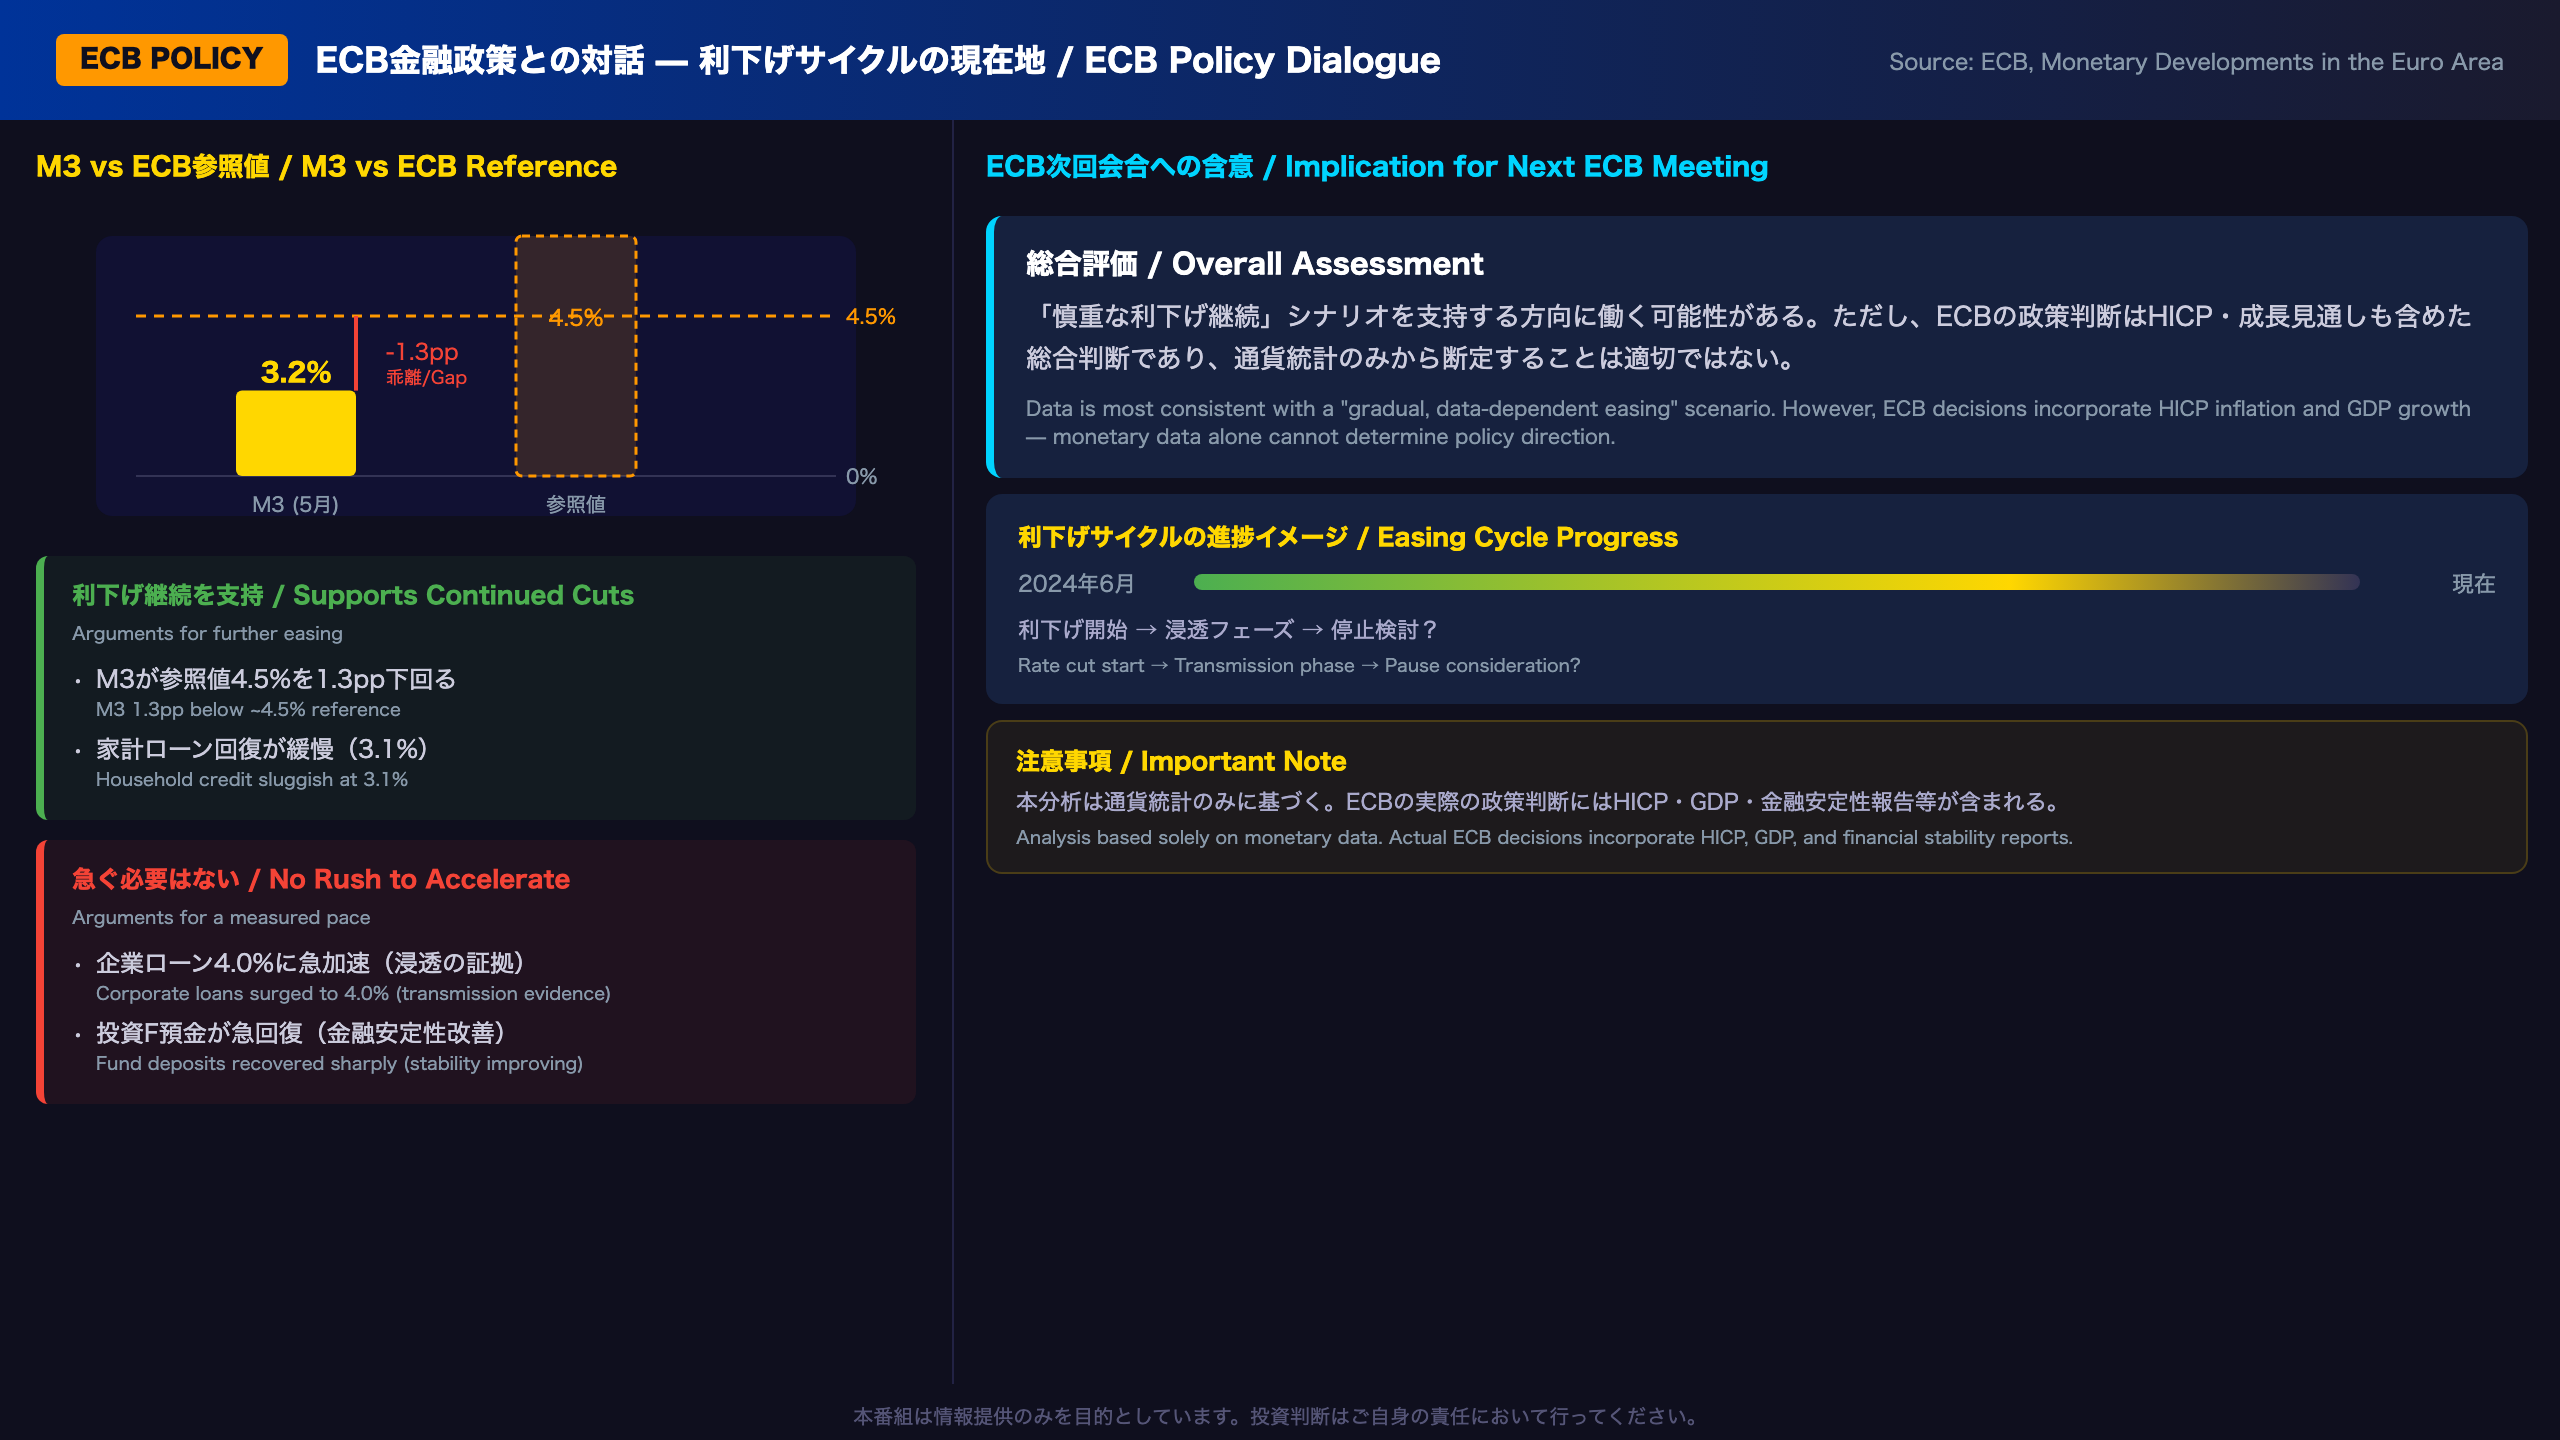
The ECB historically used a reference value of approximately 4.5% for M3 growth as a benchmark for “neutral” monetary conditions (this reference value was formally de-emphasized after 2003 but remains analytically relevant). At 3.2%, M3 sits 1.3 percentage points below this benchmark, suggesting that monetary conditions remain somewhat restrictive — consistent with the ECB’s ongoing easing bias.
The Easing Cycle in Context
The ECB began cutting rates in June 2024, reducing the deposit facility rate from 4.0% to approximately 2.25% by mid-2026 (specific rate levels not stated in the press release). The acceleration in corporate credit to 4.0% may represent the first clear evidence that this easing cycle is achieving meaningful transmission into the real economy.
Signals For and Against Further Cuts
Supporting continued cuts:
– M3 still 1.3pp below the ~4.5% reference
– Household credit recovery remains sluggish at 3.1%
– M1 well below its January 2026 peak of 5.25%
Arguing for a pause or slower pace:
– Corporate loans surging to 4.0% — easing is working
– Investment fund deposits recovering sharply — financial stability improving
– M3 at the upper end of its recent 2.7–3.2% range
Bottom Line
This data set is most consistent with a “gradual, data-dependent easing” scenario — continued cuts but at a measured pace. However, ECB policy decisions incorporate HICP inflation data, GDP growth, and financial stability assessments that go well beyond this single report.
EUR/JPY保有者への含意 — 日欧の非対称性

EUR/JPY Implications: Reading the BOJ-ECB Asymmetry
The “Chain of Reasoning” Framework
Following the required analytical framework:
ECB continued easing → EUR headwind:
[M3 at 3.2%, below ~4.5% reference] → [ECB maintains easing bias; rate cuts likely to continue] → [EUR/JPY faces downward pressure from ECB-BOJ policy divergence — though this data alone cannot confirm the magnitude or timing]
Euro area resilience → EUR support:
[Corporate loans at 4.0%, investment fund deposits recovering] → [Euro area economic activity may be accelerating] → [Could provide EUR support, partially offsetting easing pressure — but single-month data is insufficient to confirm a structural trend]
BOJ-ECB asymmetry → Yen strengthening pressure:
[BOJ normalizing rates upward vs. ECB continuing to ease] → [Japan-EU interest rate differential narrowing] → [Generally considered a headwind for EUR/JPY, though this monetary data alone cannot determine the direction or magnitude]
What EUR/JPY Holders Should Monitor
The EUR/JPY trajectory depends on factors well beyond this monetary statistics report:
- Euro area HICP: If inflation re-accelerates, ECB pause expectations could strengthen EUR
- BOJ policy decisions: Faster BOJ rate hikes would amplify yen-strengthening pressure
- USD dynamics: EUR/USD movements transmit to EUR/JPY
- Geopolitical risk: Euro area geopolitical uncertainty affects EUR risk premium
Key Upcoming Events
- Euro area HICP flash estimate (early July 2026)
- Next ECB Governing Council meeting
- BOJ Monetary Policy Meeting
- June ECB Monetary Developments (due late July 2026)
For EUR-Denominated Investment Trust Holders
The currency component of EUR-denominated investment trusts (投資信託) is directly affected by EUR/JPY movements. A strengthening yen reduces the JPY-denominated return of EUR assets, even if the underlying EUR-denominated performance is positive. The current policy asymmetry between BOJ and ECB is a factor that EUR-asset holders should incorporate into their risk assessment.
Disclaimer: This article is for informational purposes only. All investment decisions are made solely at your own risk.