📺 Watch the Full Video Analysis
This article was automatically generated by the NFC Market Live AI analysis system. (Updated: 2026-06-24 15:16 JST)
📄 Primary Source
Statistics Norway
https://www.ssb.no/en/arbeid-og-lonn/sysselsetting/statistikk/arbeidskraftundersokelsen
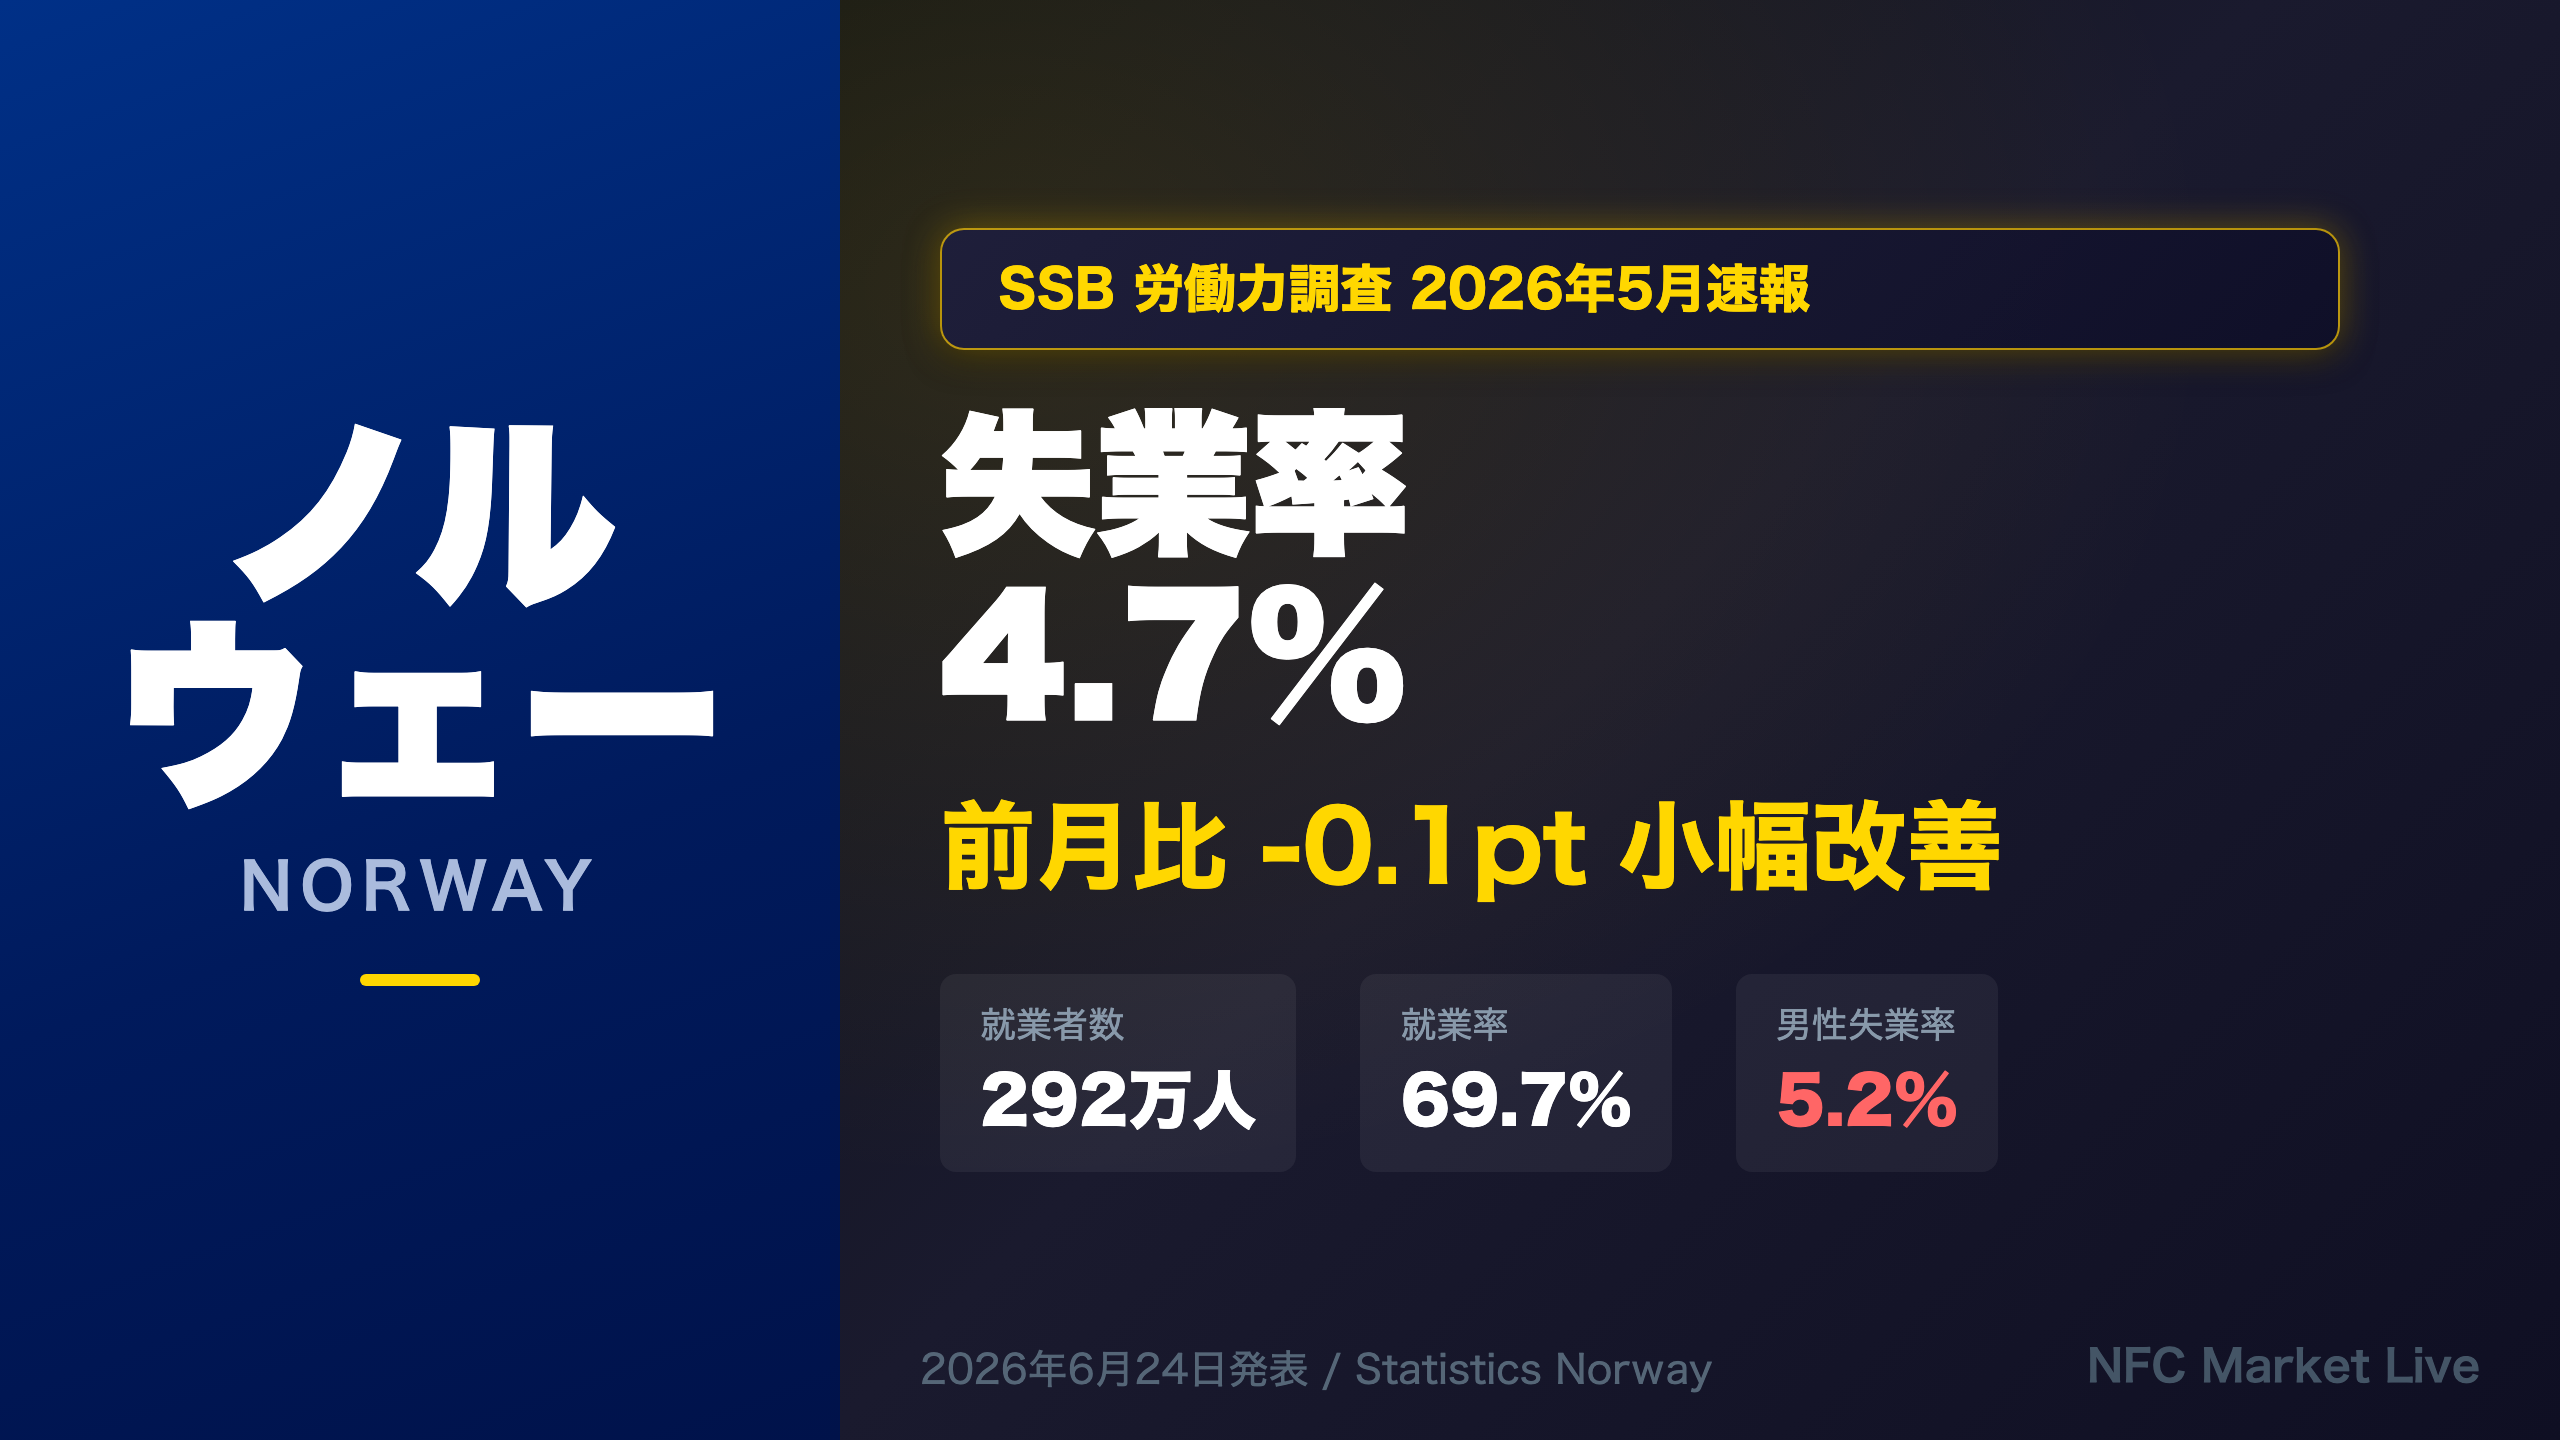
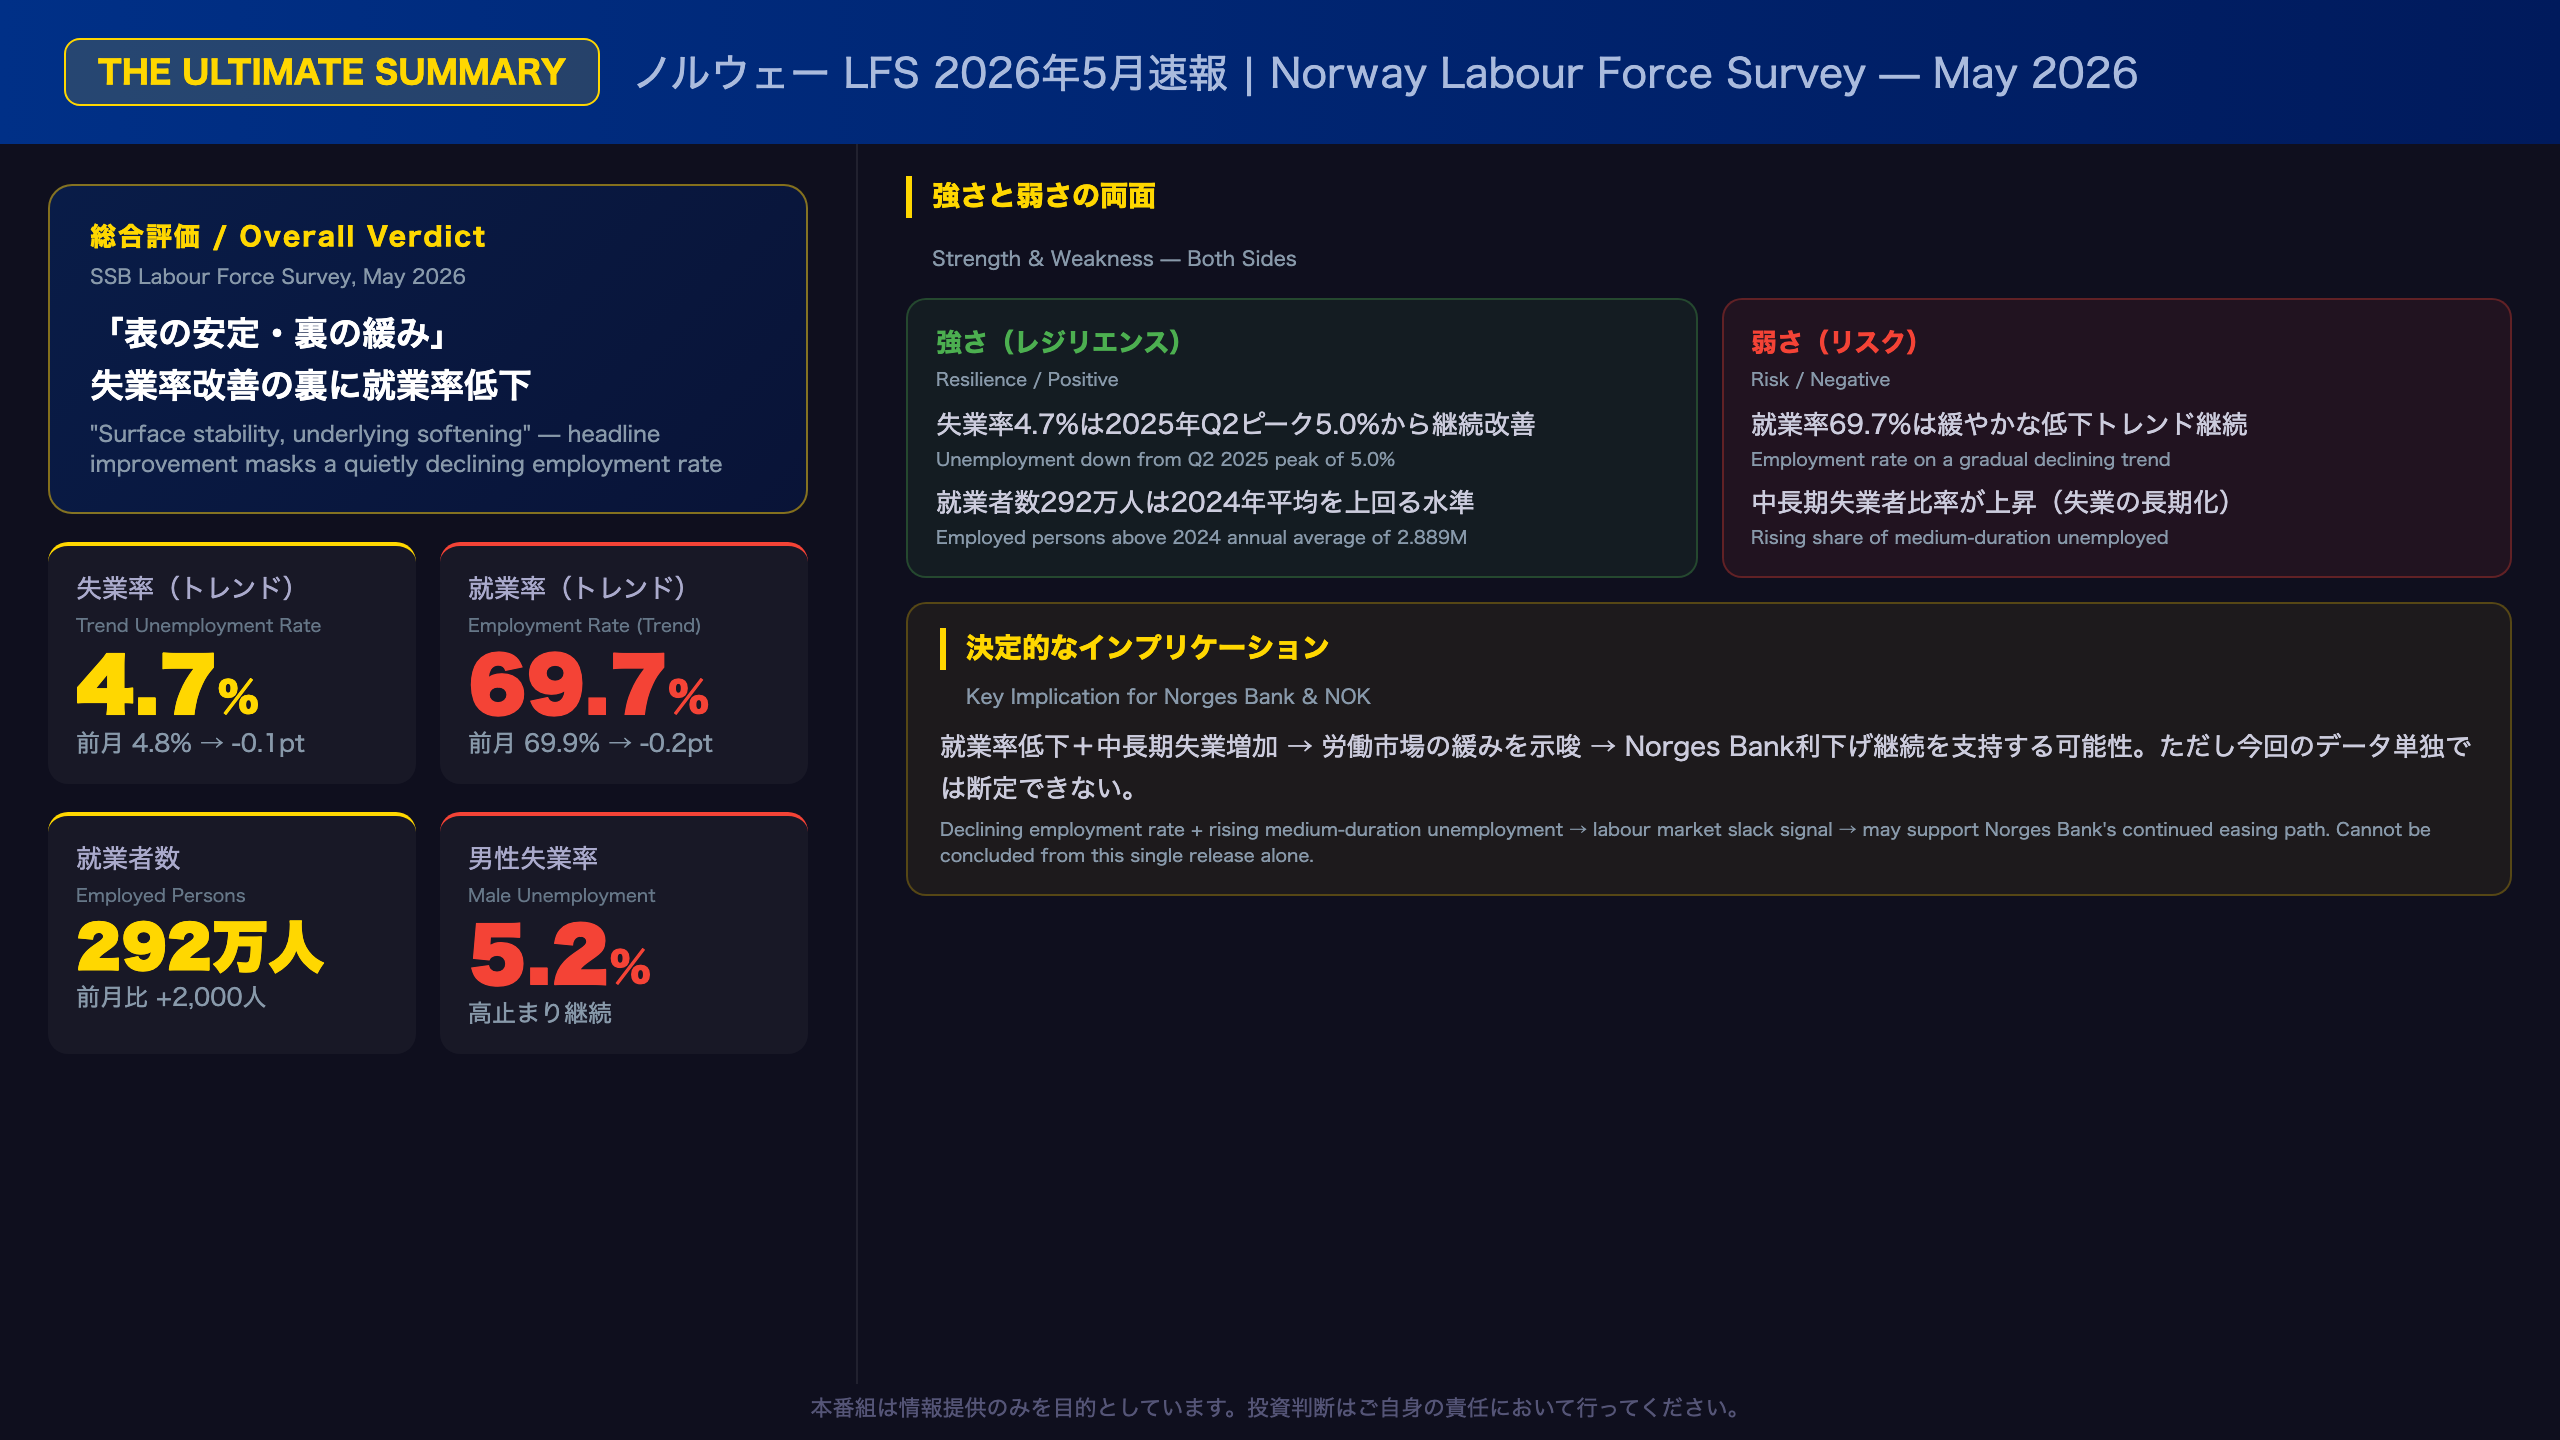
Statistics Norway (SSB) released the May 2026 Labour Force Survey on June 24, 2026. The trend unemployment rate edged down to 4.7% from 4.8%, while employed persons held at 2.92 million. However, the employment rate slipped to 69.7%, male unemployment remains elevated at 5.2%, and the share of medium-duration unemployed is rising — structural signals worth watching for Norges Bank’s rate path and NOK positioning.
The Ultimate Summary — 失業率改善の裏に潜む雇用の質の劣化
The Ultimate Summary: Surface Stability, Underlying Softening
What Is the Norwegian LFS?
The Labour Force Survey (LFS), known in Norwegian as Arbeidskraftundersøkelsen (AKU), is published monthly by Statistics Norway (SSB). It is Norway’s primary measure of employment and unemployment, aligned with ILO and EU Eurostat definitions, making it directly comparable to labour market surveys across Europe. The monthly release focuses on trend figures — three-month moving averages of seasonally adjusted data — which SSB recommends as the most reliable indicator of underlying labour market conditions.
Headline Numbers at a Glance
| Indicator | May 2026 | April 2026 | Change |
|---|---|---|---|
| Trend unemployment rate | 4.7% | 4.8% | -0.1pp |
| Employed persons (trend) | 2.920M | 2.923M | -3,000 |
| Employment rate (trend) | 69.7% | 69.9% | -0.2pp |
The Positive Case
The 0.1 percentage point decline in the trend unemployment rate continues a gradual improvement from the cycle peak of 5.0% recorded in Q2 2025. Employed persons remain well above the 2024 annual average of 2.889 million, demonstrating genuine labour market resilience.
The Concern
The employment rate — employed persons as a share of the working-age population — has slipped to 69.7%, down from 70.0% in Q2 2025. This divergence between the unemployment rate (improving) and the employment rate (declining) suggests that labour force participation dynamics or population growth may be masking underlying softness.
Key Implication for Norges Bank
Norges Bank, Norway’s central bank, has been on a gradual easing path. Labour market slack — as evidenced by a declining employment rate and rising medium-duration unemployment — is generally considered disinflationary, which would support continued rate cuts. However, this single monthly data point is insufficient to draw firm conclusions about the policy trajectory.
Deep Dive ① — ヘッドライン数値の構造分析:失業率と就業率の乖離
Unemployment Rate vs. Employment Rate: Why They’re Diverging
Understanding the Divergence
Two key indicators moved in opposite directions in the May 2026 LFS release:
– Trend unemployment rate: 4.7% (improved from 4.8%)
– Trend employment rate: 69.7% (declined from 69.9%)
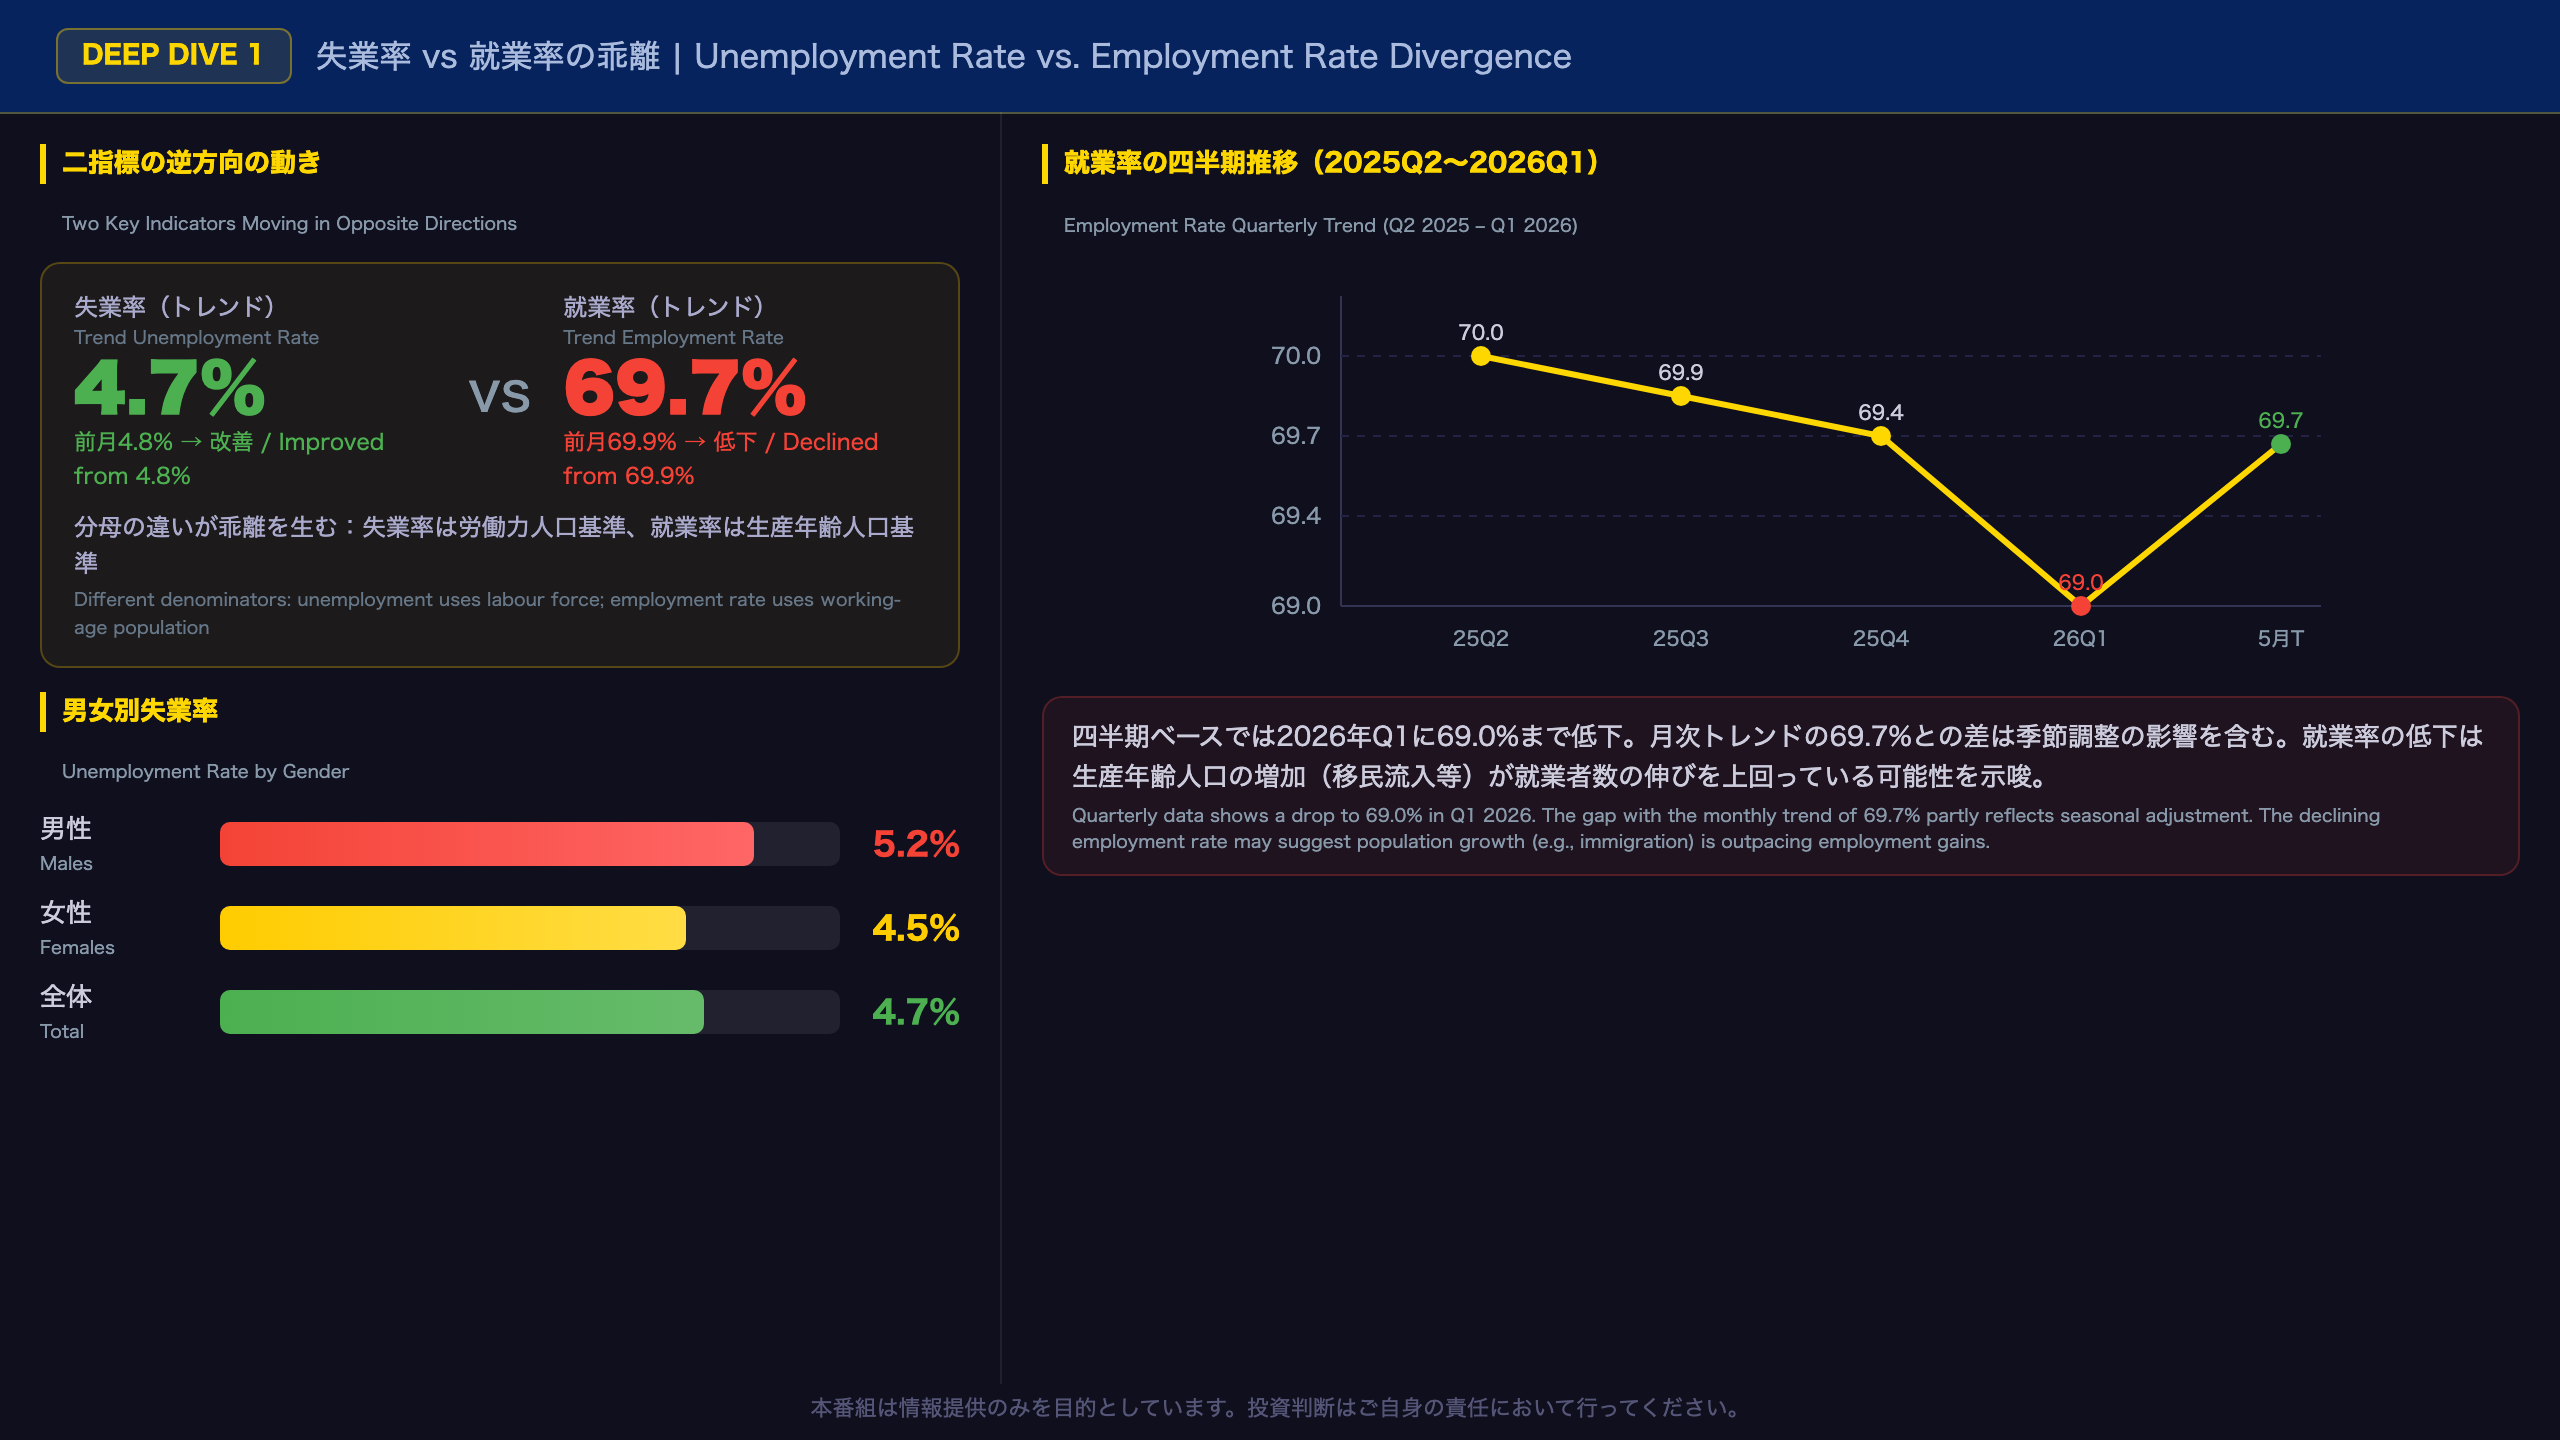
This divergence is not a contradiction — it reflects the different denominators used in each calculation. The unemployment rate uses the labour force (employed + unemployed) as its base, while the employment rate uses the entire working-age population (ages 15-74). If the working-age population grows faster than employment — for example, due to immigration — the employment rate can fall even as the unemployment rate improves.
Norway’s Immigration Context
Norway has experienced sustained net immigration, which continuously expands the working-age population base. This is a structural feature of the Norwegian labour market that can mechanically depress the employment rate over time, independent of cyclical conditions.
Quarterly Employment Rate Trend
| Period | Employment Rate |
|---|---|
| 2024 Annual Average | 69.7% |
| Q2 2025 | 70.0% |
| Q3 2025 | 69.9% |
| Q4 2025 | 69.4% |
| Q1 2026 | 69.0% |
| May 2026 (trend) | 69.7% |
The quarterly figures show a more pronounced decline than the monthly trend, partly reflecting seasonal adjustment differences. The Q1 2026 reading of 69.0% is notably weak.
Gender Asymmetry
Male unemployment at 5.2% significantly exceeds female unemployment at 4.5%, a gap that has widened from the 2025 annual averages (4.9% male, 4.1% female). This asymmetry may reflect sectoral concentration in cyclically sensitive industries, though sector-level data is not available in this release to confirm.
What to Watch Next
The next LFS release on July 21, 2026 will be critical for assessing whether the employment rate stabilizes at 69.7% or resumes its quarterly declining trend.
Deep Dive ② — 失業の長期化シグナル:求職期間別構成比の変化
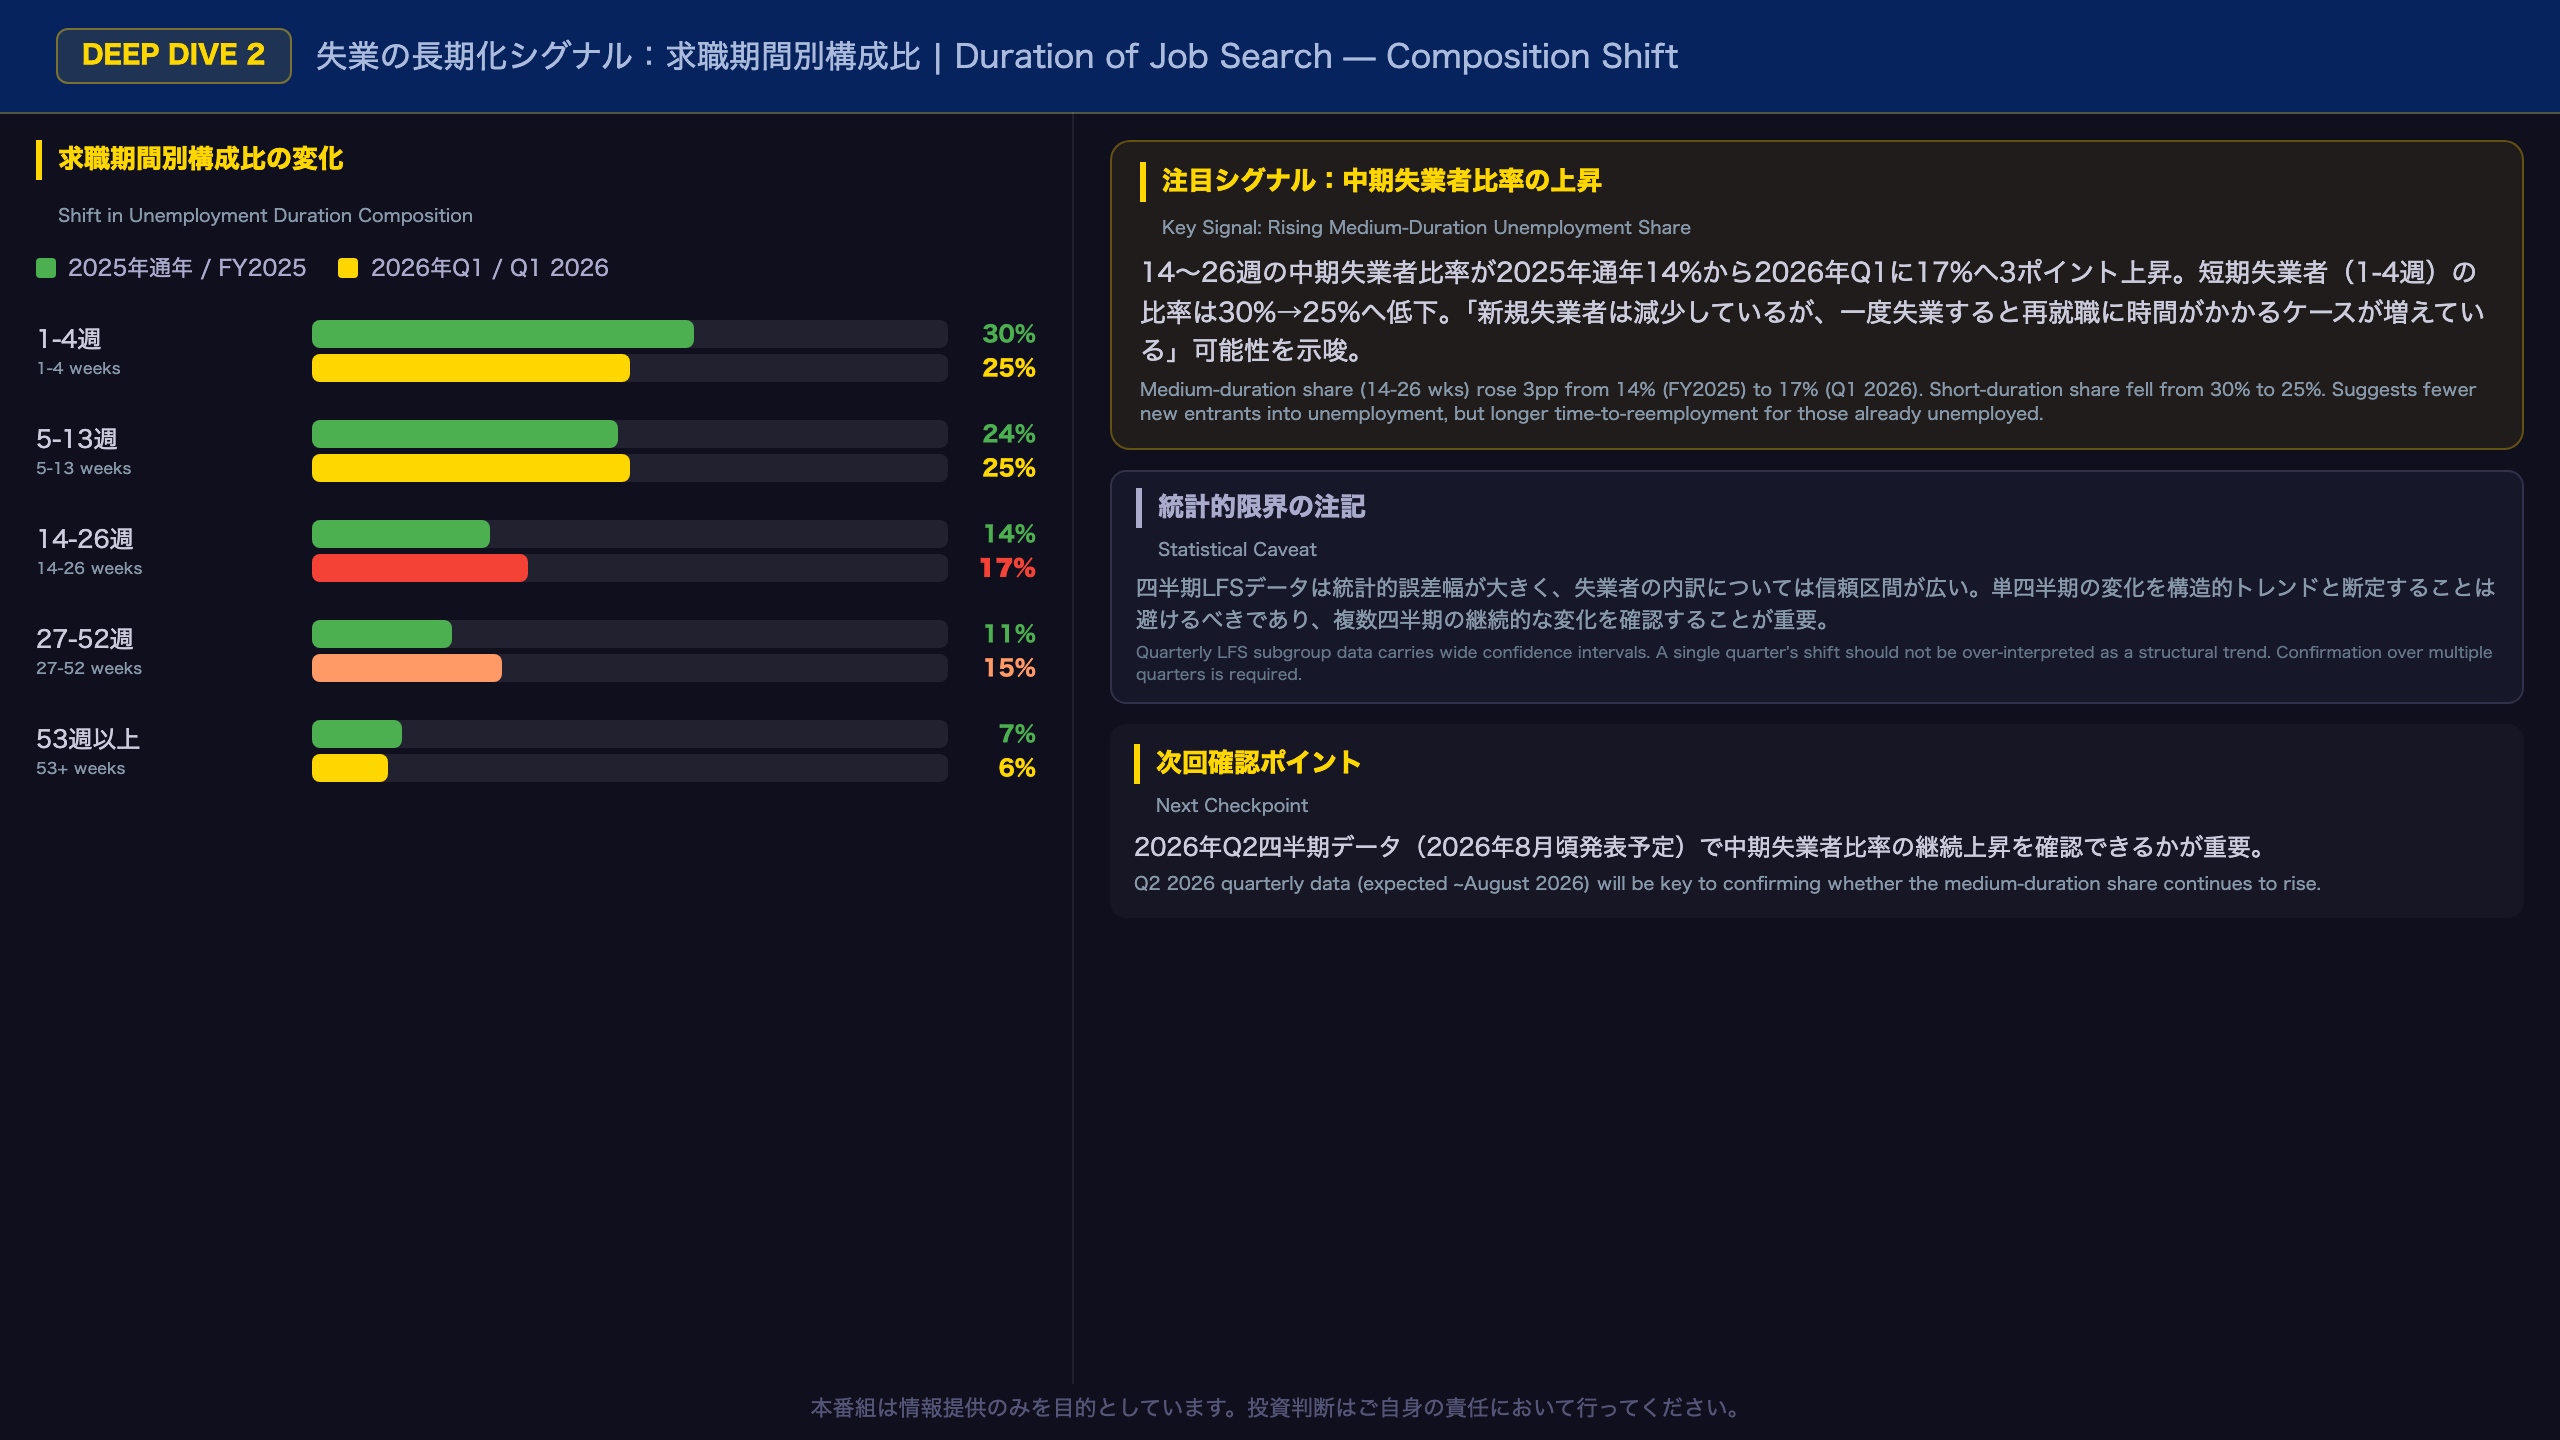
Rising Medium-Duration Unemployment: A Hidden Signal Worth Watching
Duration Composition Shift
The most analytically significant finding in this release is the shift in the composition of unemployment by duration of job search. The table below compares the 2025 annual average with Q1 2026:
| Duration | 2024 Annual | 2025 Annual | Q1 2026 | Change |
|---|---|---|---|---|
| 1-4 weeks | 31% | 30% | 25% | -5pp |
| 5-13 weeks | 26% | 24% | 25% | +1pp |
| 14-26 weeks | 12% | 14% | 17% | +3pp |
| 27-39 weeks | 4% | 4% | 5% | +1pp |
| 40-52 weeks | 9% | 7% | 10% | +3pp |
| 53+ weeks | 7% | 7% | 6% | -1pp |
What This Means
The decline in the short-duration share (1-4 weeks: 30% → 25%) combined with the rise in the medium-duration share (14-26 weeks: 14% → 17%) suggests a structural shift in the nature of unemployment. Fewer people are entering unemployment (positive), but those who are unemployed are taking longer to find work (negative). This pattern is consistent with rising labour market mismatch — a situation where available jobs and available workers do not align well in terms of skills, location, or sector.
Why This Matters for Norges Bank
Rising medium-duration unemployment is a leading indicator of potential structural unemployment. If this trend persists, it could signal that the natural rate of unemployment (NAIRU) is drifting higher, which would complicate Norges Bank’s inflation and labour market assessments. However, given the statistical uncertainty inherent in quarterly LFS subgroup data, this should be treated as a signal to monitor rather than a confirmed structural shift.
Statistical Caveat
SSB explicitly notes that quarterly LFS figures carry wider confidence intervals than annual averages. The margin of error for unemployment subgroup data is substantial, and a single quarter’s shift should not be over-interpreted.
インプリケーション — Norges Bank・NOK・クローネ債への示唆
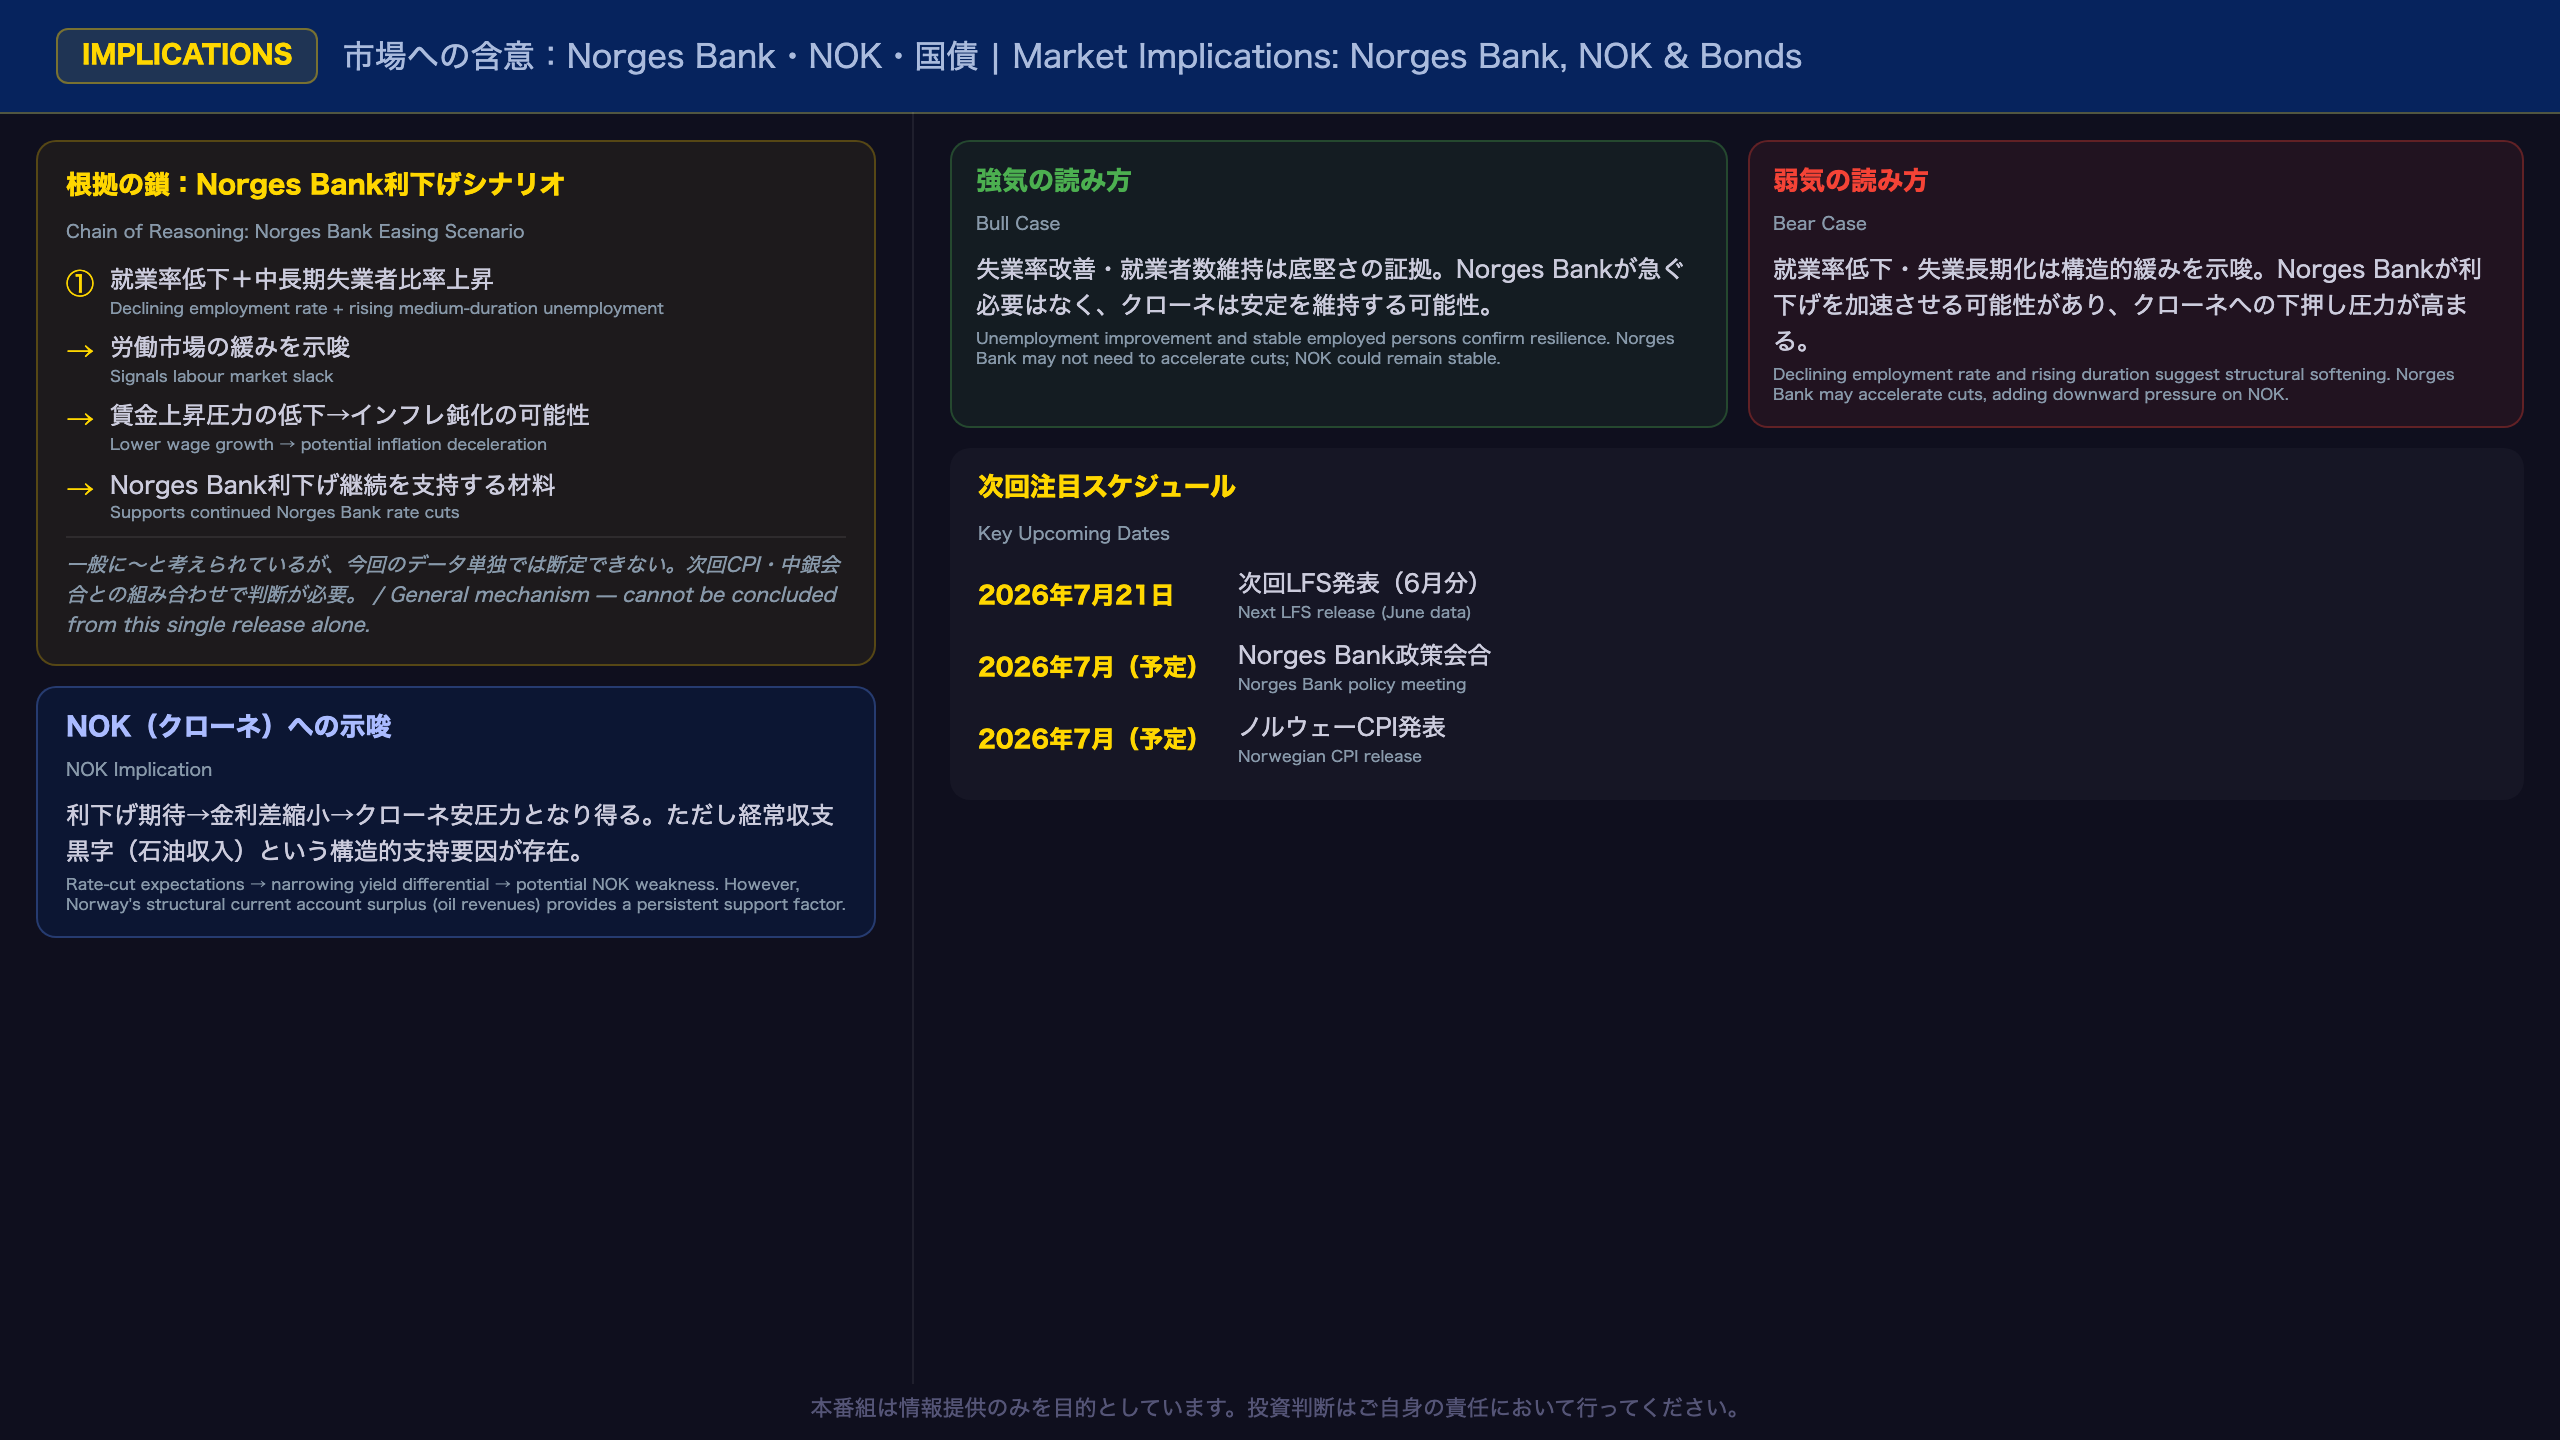
Market Implications: Norges Bank, NOK, and Norwegian Bonds
The Chain of Reasoning
Norges Bank Rate Cut Scenario:
Declining employment rate (69.7%) + rising medium-duration unemployment share → labour market slack signal → potential for lower wage growth → reduced inflationary pressure → supports continued Norges Bank easing.
Caveat: This chain relies on general economic mechanisms. The link between labour market slack and inflation is not mechanical and depends on wage-setting dynamics, productivity, and import prices. This single data release cannot confirm the full chain.
NOK (Norwegian Krone) Implication:
Rising rate-cut expectations → narrowing interest rate differential → potential downward pressure on NOK.
Caveat: Norway’s structural current account surplus, driven by petroleum revenues, provides a persistent support factor for the krone. The simple “rate cuts = weaker currency” equation may not hold in Norway’s case.
Norwegian Government Bonds:
Labour market softening → potential inflation deceleration → downward pressure on long-term yields → supportive for Norwegian government bond prices.
Bull vs. Bear Case
Bull Case: The improvement in the unemployment rate and the stability of employed persons demonstrate Norwegian labour market resilience. Norges Bank may not need to accelerate its easing pace, supporting NOK stability.
Bear Case: The declining employment rate trend and rising medium-duration unemployment suggest structural softening. Norges Bank may accelerate cuts, adding downward pressure on NOK.
Key Upcoming Dates
- July 21, 2026: Next LFS release
- July 2026 (scheduled): Norges Bank policy meeting
- July 2026 (scheduled): Norwegian CPI release
The combination of these three data points will be critical for forming a more complete view of the Norwegian macro outlook.
Disclaimer: This article is for informational purposes only. All investment decisions are made solely at your own risk.