📺 Watch the Full Video Analysis
This article was automatically generated by the NFC Market Live AI analysis system. (Updated: 2026-10-27 21:25 JST)
📦 A balanced look at UPS’s 3Q 2026 results.
📈 Revenue rose 6.7% year over year to $22.9B, with growth in all segments, and the full-year revenue outlook was raised to about $92.6B.
📉 Adjusted EPS was $1.69 versus $1.74 a year earlier; GAAP EPS was $1.37 versus $1.55.
💡 U.S. Domestic was driven by yield (revenue per piece +6.1%). In Supply Chain Solutions, a prior-year sale-leaseback gain and this quarter’s goodwill impairment complicate the profit comparison.
⚠️ Next focus: the company’s 4Q outlook (revenue about $25.7B, adjusted operating profit about $3.3B).
UPS 7-9月期決算:増収と見通し引き上げ、利益は伸び悩み
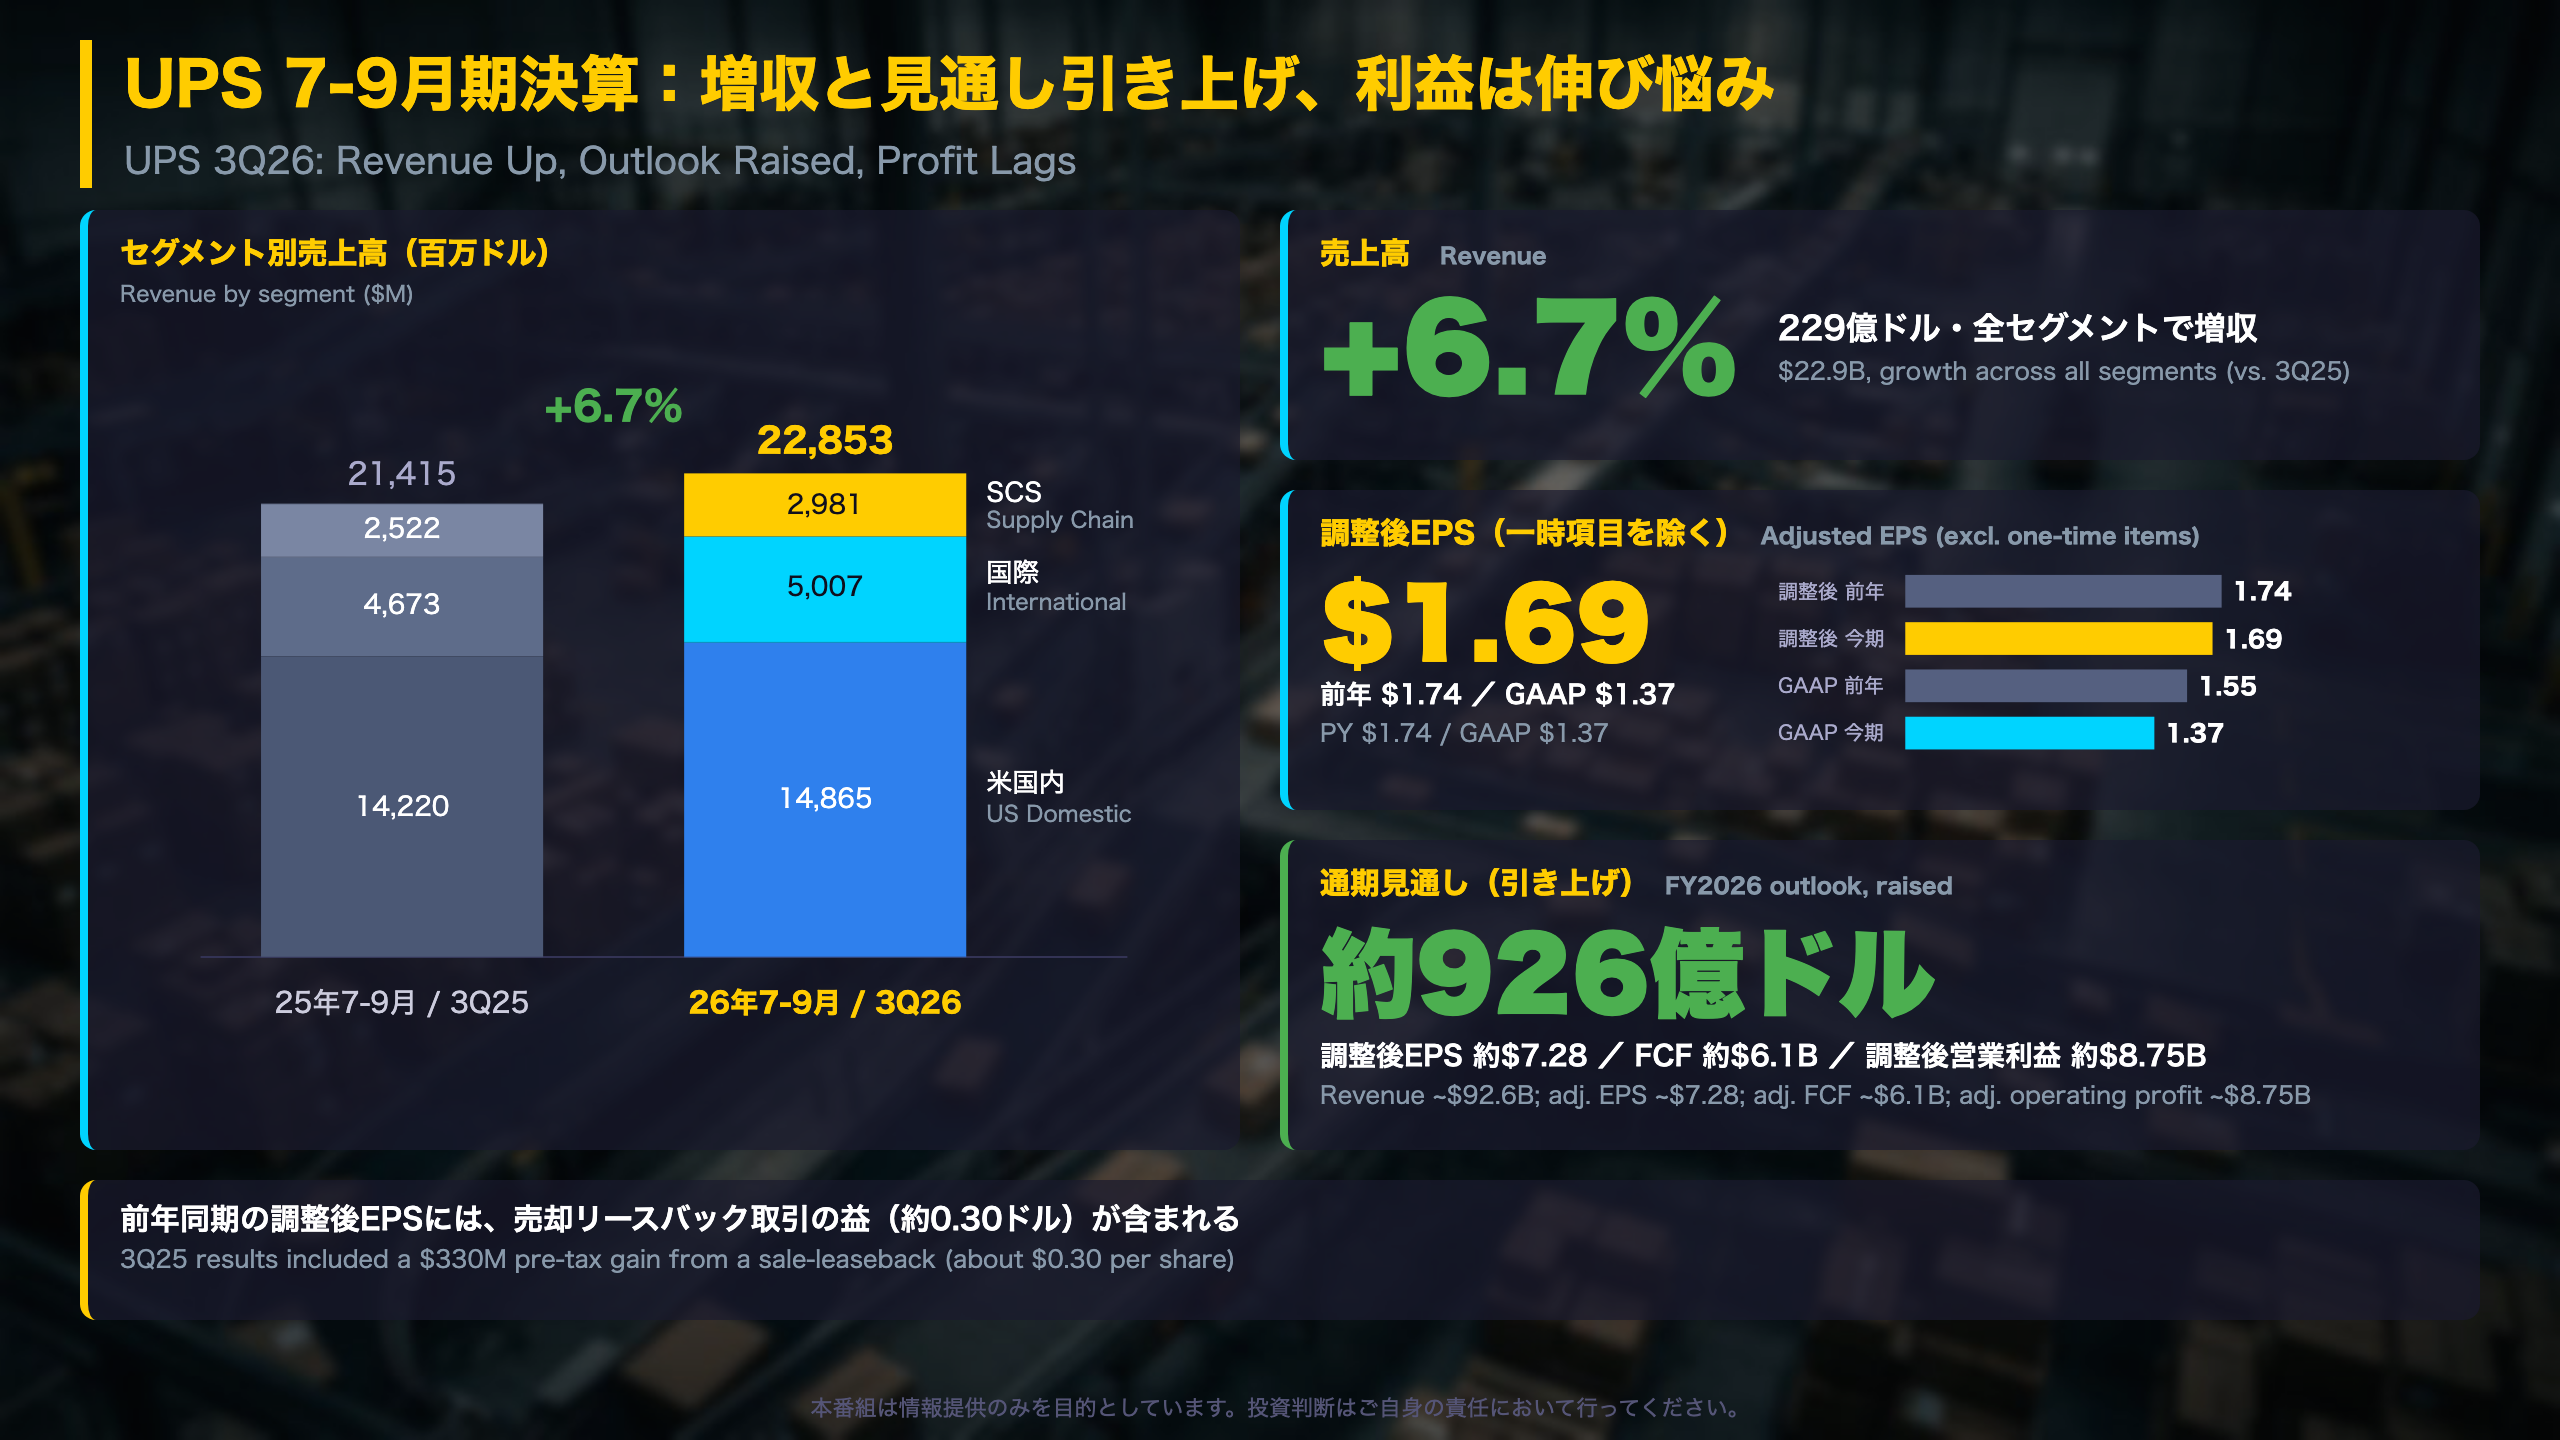
UPS 3Q26 at a glance
UPS (NYSE: UPS) is one of the world’s largest package and logistics companies, with 2025 revenue of $88.7 billion. It reports three groups: U.S. Domestic Package, International Package and Supply Chain Solutions (SCS).
Why two EPS numbers?
GAAP follows accounting rules. UPS also publishes a ‘non-GAAP adjusted’ figure that excludes restructuring costs, impairments and asset-sale gains. In 3Q26 the gap was $0.32 per share: $0.15 of transformation costs and $0.21 of goodwill impairment, partly offset by $0.04 of asset-sale gains.
| Metric | 3Q25 | 3Q26 |
|---|---|---|
| GAAP operating margin | 8.4% | 7.6% |
| Adjusted operating margin | 10.0% | 9.0% |
| GAAP EPS | $1.55 | $1.37 |
| Adjusted EPS | $1.74 | $1.69 |
Nine-month context
Adjusted EPS for the first nine months was $4.52 versus $4.78, and GAAP EPS was $3.09 versus $4.46, mostly because restructuring costs rose to about $1.4B from $0.46B.
Comparison with U.S. peers
Like other U.S. parcel carriers, UPS is balancing network cost cuts against softer package counts. Its fiscal year is the calendar year, so its quarters line up directly with U.S. macro data.
What to watch
The company says 3Q25 included a $330M pre-tax sale-leaseback gain in SCS (about $0.30 per share), which makes the year-over-year profit comparison harder. The next checkpoint is actual 4Q26 results versus the company’s own outlook of about $25.7B in revenue and about $3.3B in adjusted operating profit. The next earnings date is not stated in this release.
米国内事業:荷物は減少、単価と利益率が改善
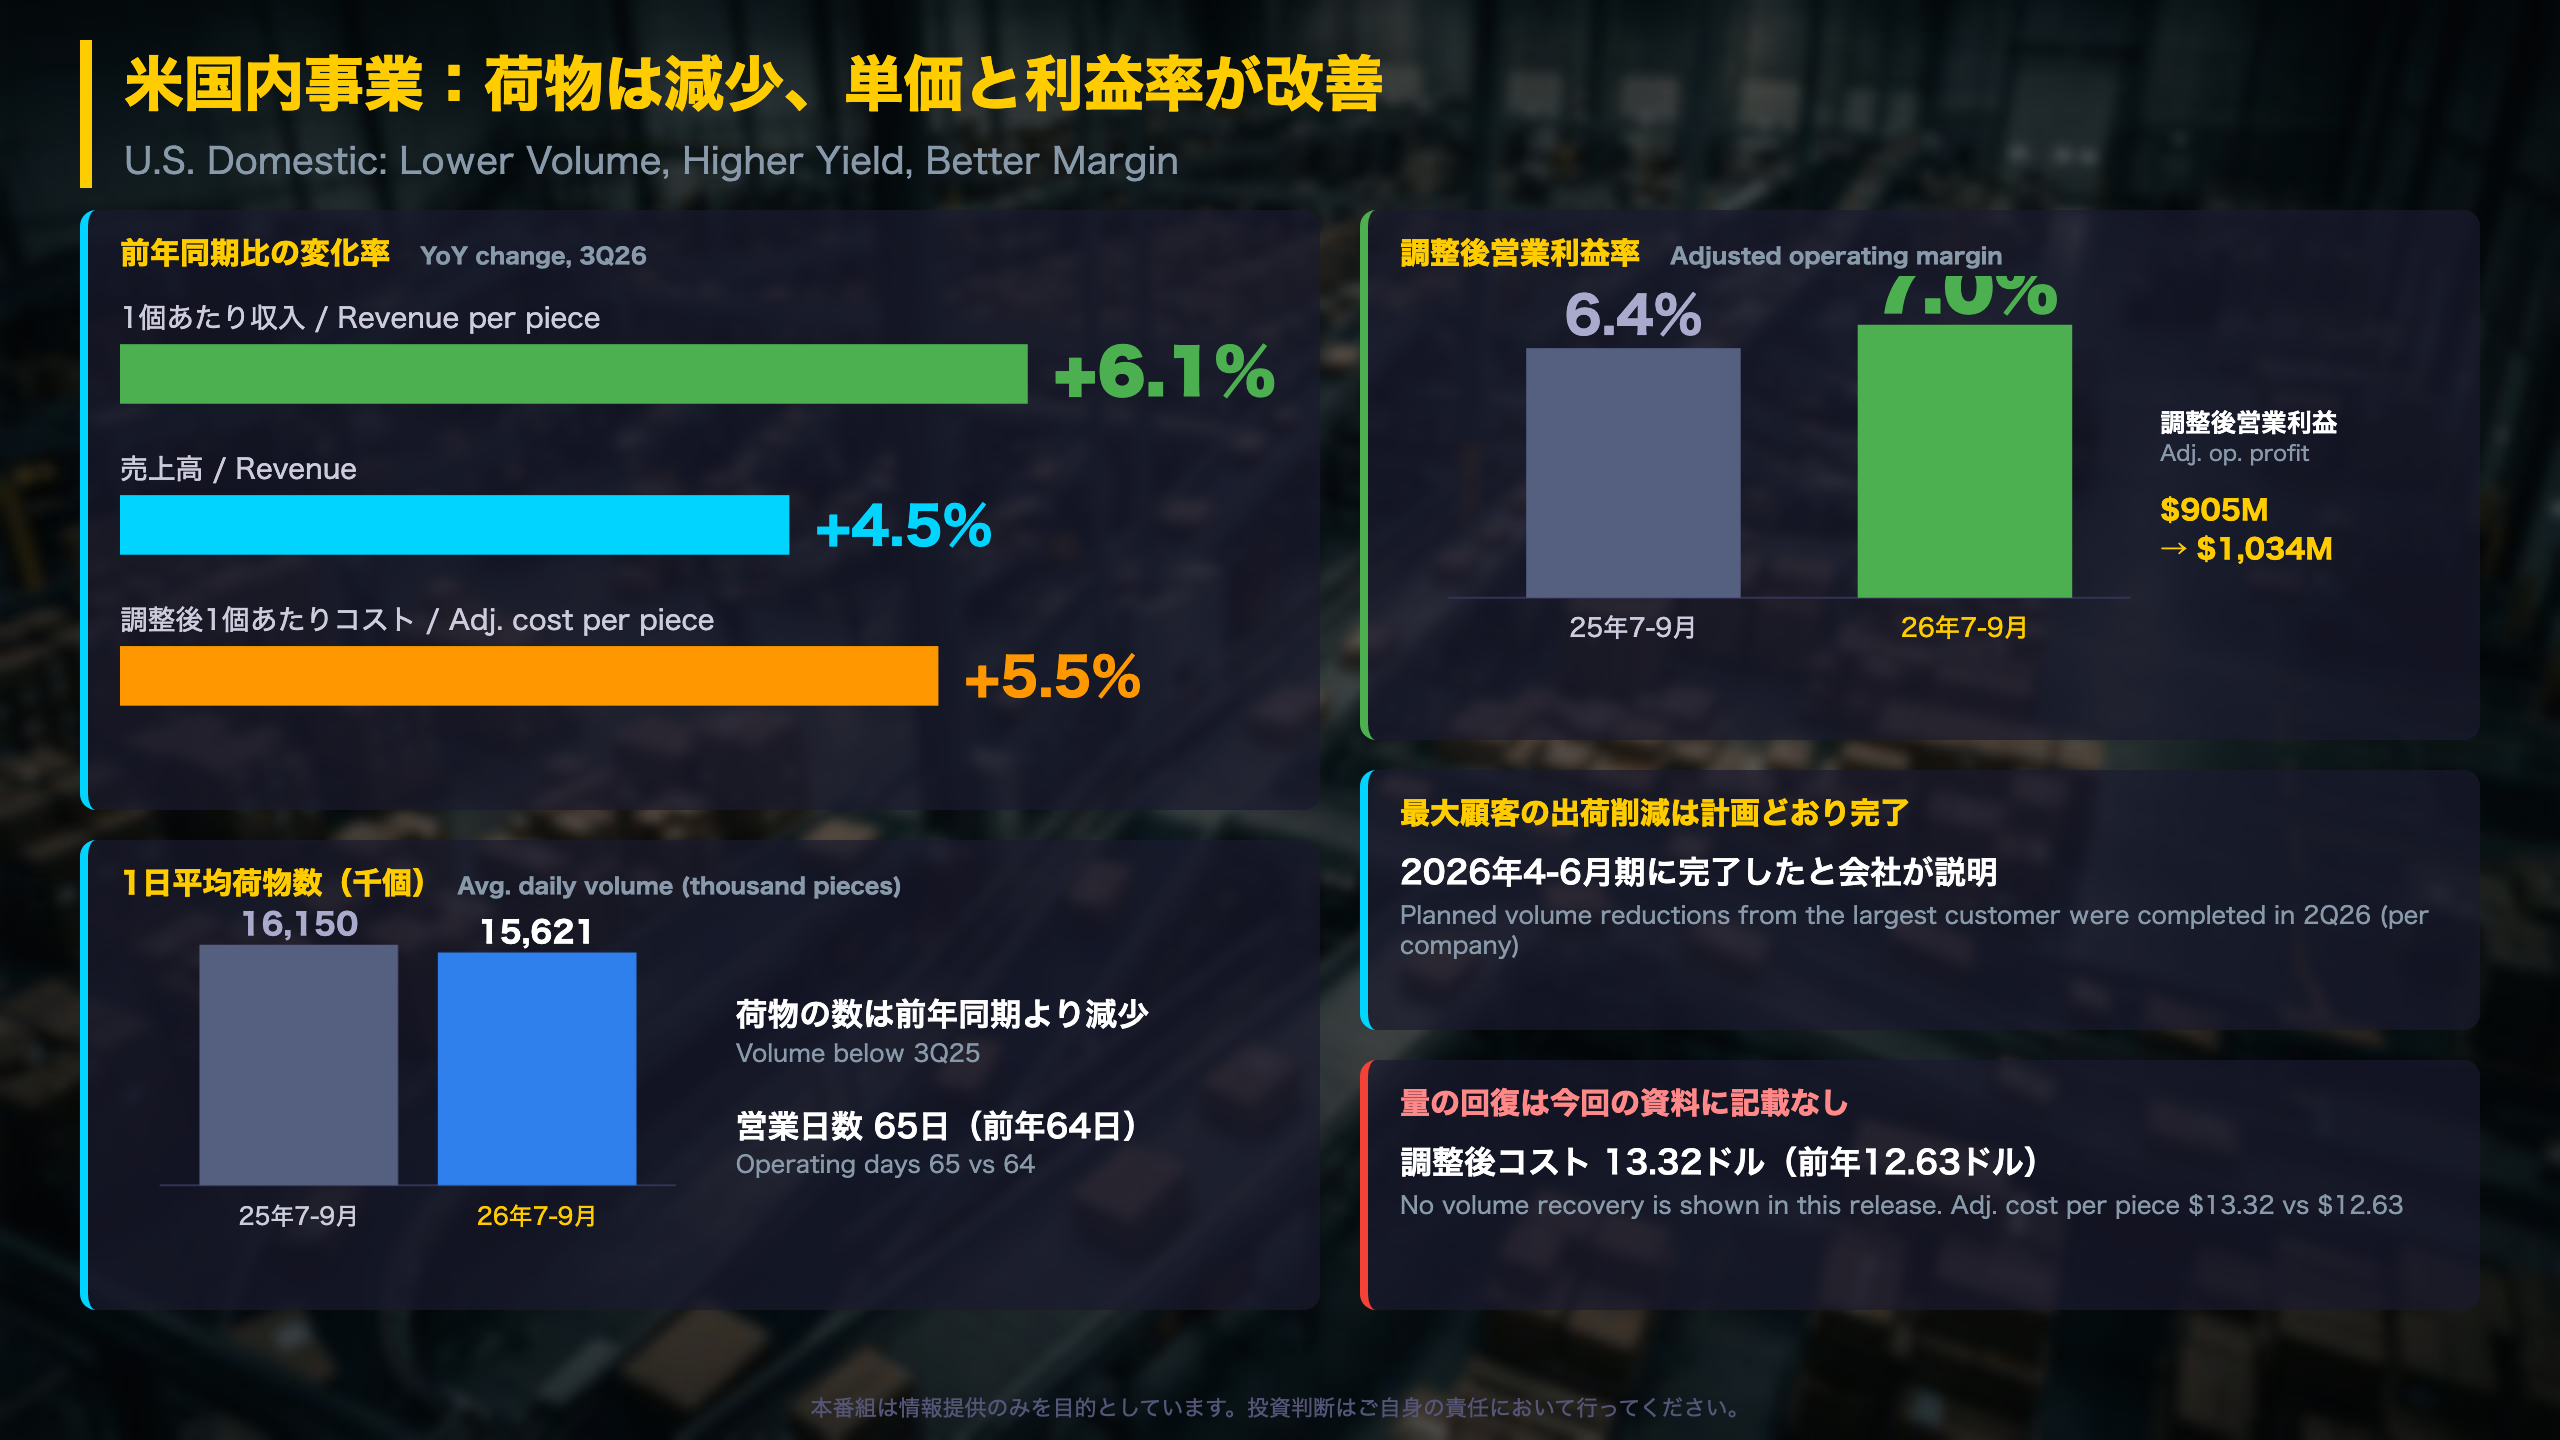
U.S. Domestic Package: yield over volume
The U.S. Domestic segment is UPS’s largest, generating $14.9B of the quarter’s revenue. Its economics are best read through three per-piece measures: revenue per piece, cost per piece and daily volume.
| Metric | 3Q25 | 3Q26 |
|---|---|---|
| Revenue | $14,220M | $14,865M |
| Adjusted operating profit | $905M | $1,034M (+14.3%) |
| Adjusted cost per piece | $12.63 | $13.32 (+5.5%) |
| Avg. daily volume | 16.15M | 15.62M |
| Operating days | 64 | 65 |
Details that matter
There was one more operating day this year, which can lift reported revenue. Restructuring costs inside this segment fell to $171M from $302M, which helps the GAAP margin (6.1% versus 4.2%), but the adjusted margin of 7.0% versus 6.4% already excludes those costs.
Nine-month contrast
Over nine months, adjusted operating profit fell 3.8% to $2,787M and the adjusted margin was 6.3% versus 6.8%. Adjusted cost per piece rose 7.7%. So 3Q26 looks better than the year-to-date trend, though one quarter is not enough to call a turning point.
Context for global readers
UPS says planned volume reductions from its largest customer ended in 2Q26, so the volume decline is partly deliberate. Compared with the U.S. CPI or retail sales data we cover elsewhere, company figures like these show how parcel pricing and network efficiency translate into margins.
What to watch
The gap between revenue growth per piece and cost growth per piece, and whether daily volume stabilises. The company’s 4Q outlook is the next reference point.
サプライチェーン部門:売上拡大、利益は前年の益で比較が難しい
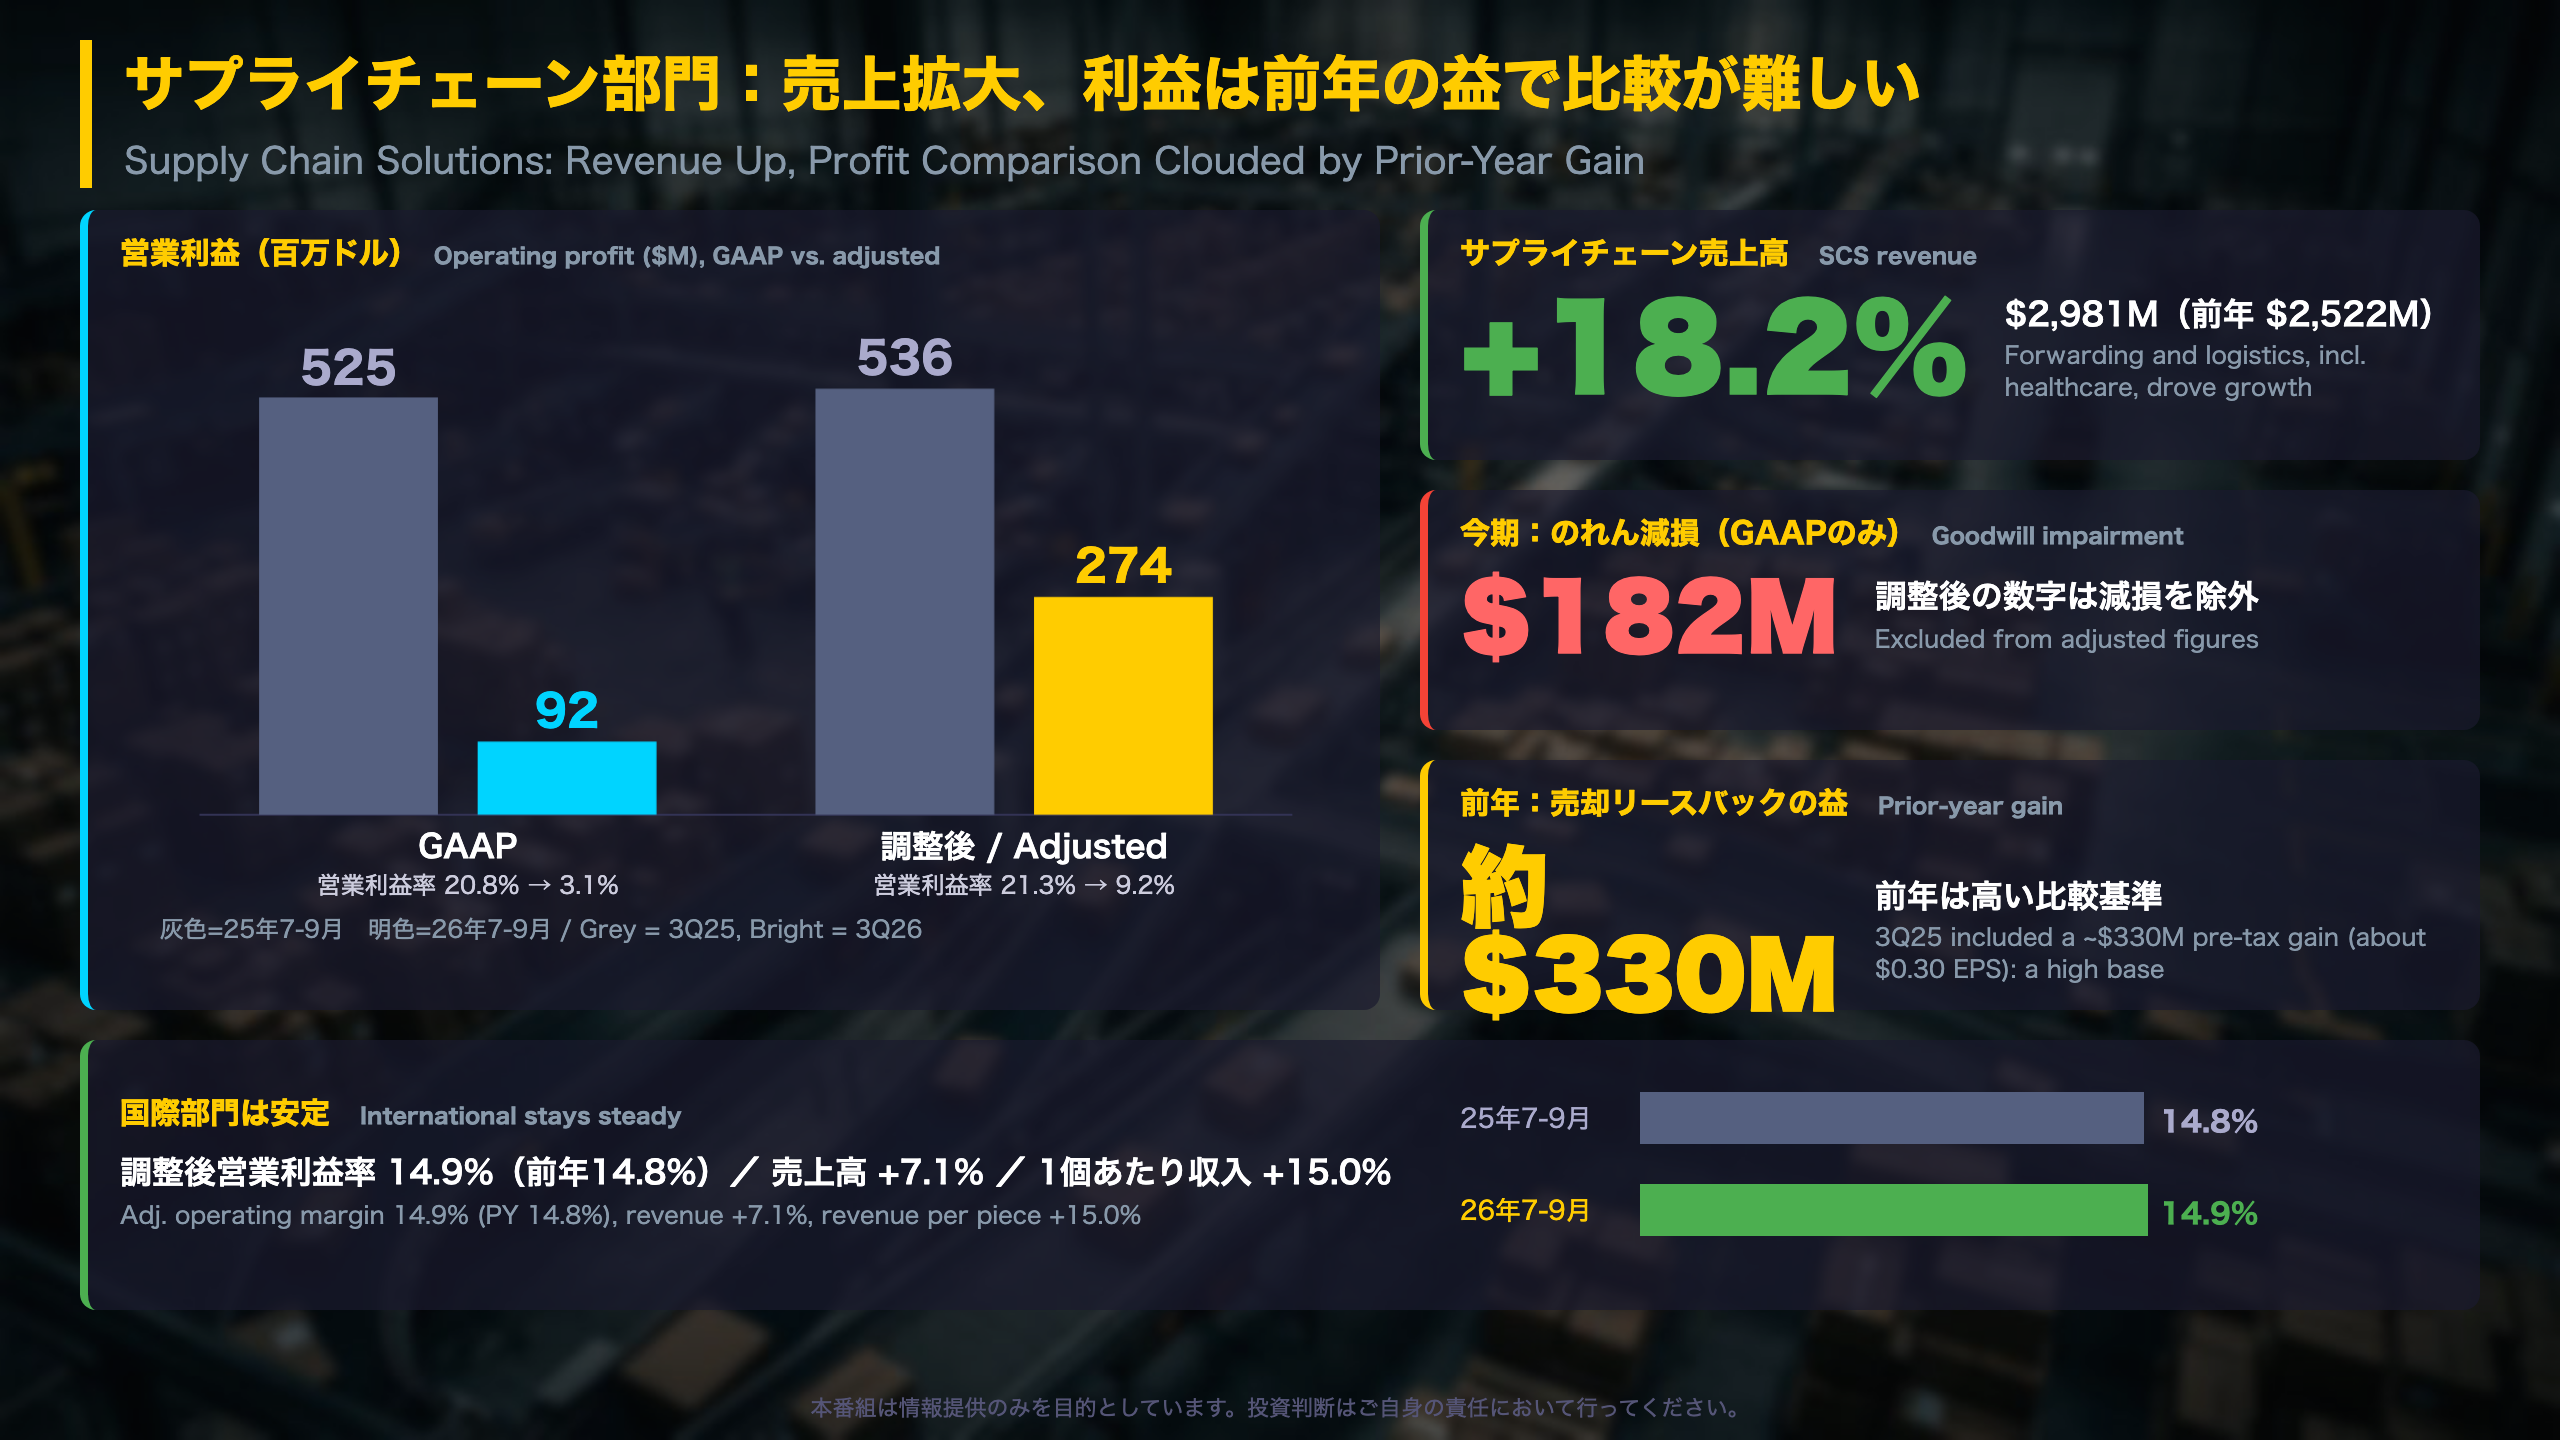
Supply Chain Solutions: reading the profit line
SCS covers freight forwarding, logistics and healthcare logistics. It is not a reportable segment under ASC 280, so UPS groups it separately from the two package segments.
| Metric | 3Q25 | 3Q26 |
|---|---|---|
| Revenue | $2,522M | $2,981M (+18.2%) |
| GAAP operating profit | $525M | $92M |
| Adjusted operating profit | $536M | $274M (-48.9%) |
| Adjusted operating expense | $1,986M | $2,707M (+36.3%) |
| Adjusted margin | 21.3% | 9.2% |
The base-effect issue
UPS discloses that 3Q25 included a $330M pre-tax gain from a sale-leaseback (about $0.30 EPS). This quarter, GAAP includes a $182M goodwill impairment in one SCS reporting unit, which adjusted figures exclude. The company has not said the 3Q25 gain was removed from last year’s adjusted number, so the adjusted comparison is not like for like.
Nine-month check
Adjusted SCS operating profit is $771M for nine months versus $846M, and the adjusted margin is 9.2% versus 10.7%. Subtracting 3Q26’s $274M implies about $497M for the first half, so 3Q26 is above the first-half quarterly average. That supports reading last year’s quarter as unusually high.
International
Revenue grew 7.1% on a 15.0% rise in revenue per piece, with a 14.9% adjusted margin (14.8% a year ago). On a nine-month view the adjusted margin is 13.2% versus 15.0%, so the stable quarter is better than the year-to-date trend.
Why it matters
Global investors often compare UPS with other freight and logistics names. Here the key point is that headline profit comparisons need the one-off items stripped out on both sides. We make no forecast; the next reference is the 4Q26 outlook and the next results release, whose date is not stated.
質疑で深める:構造改革の効果・費用とキャッシュ
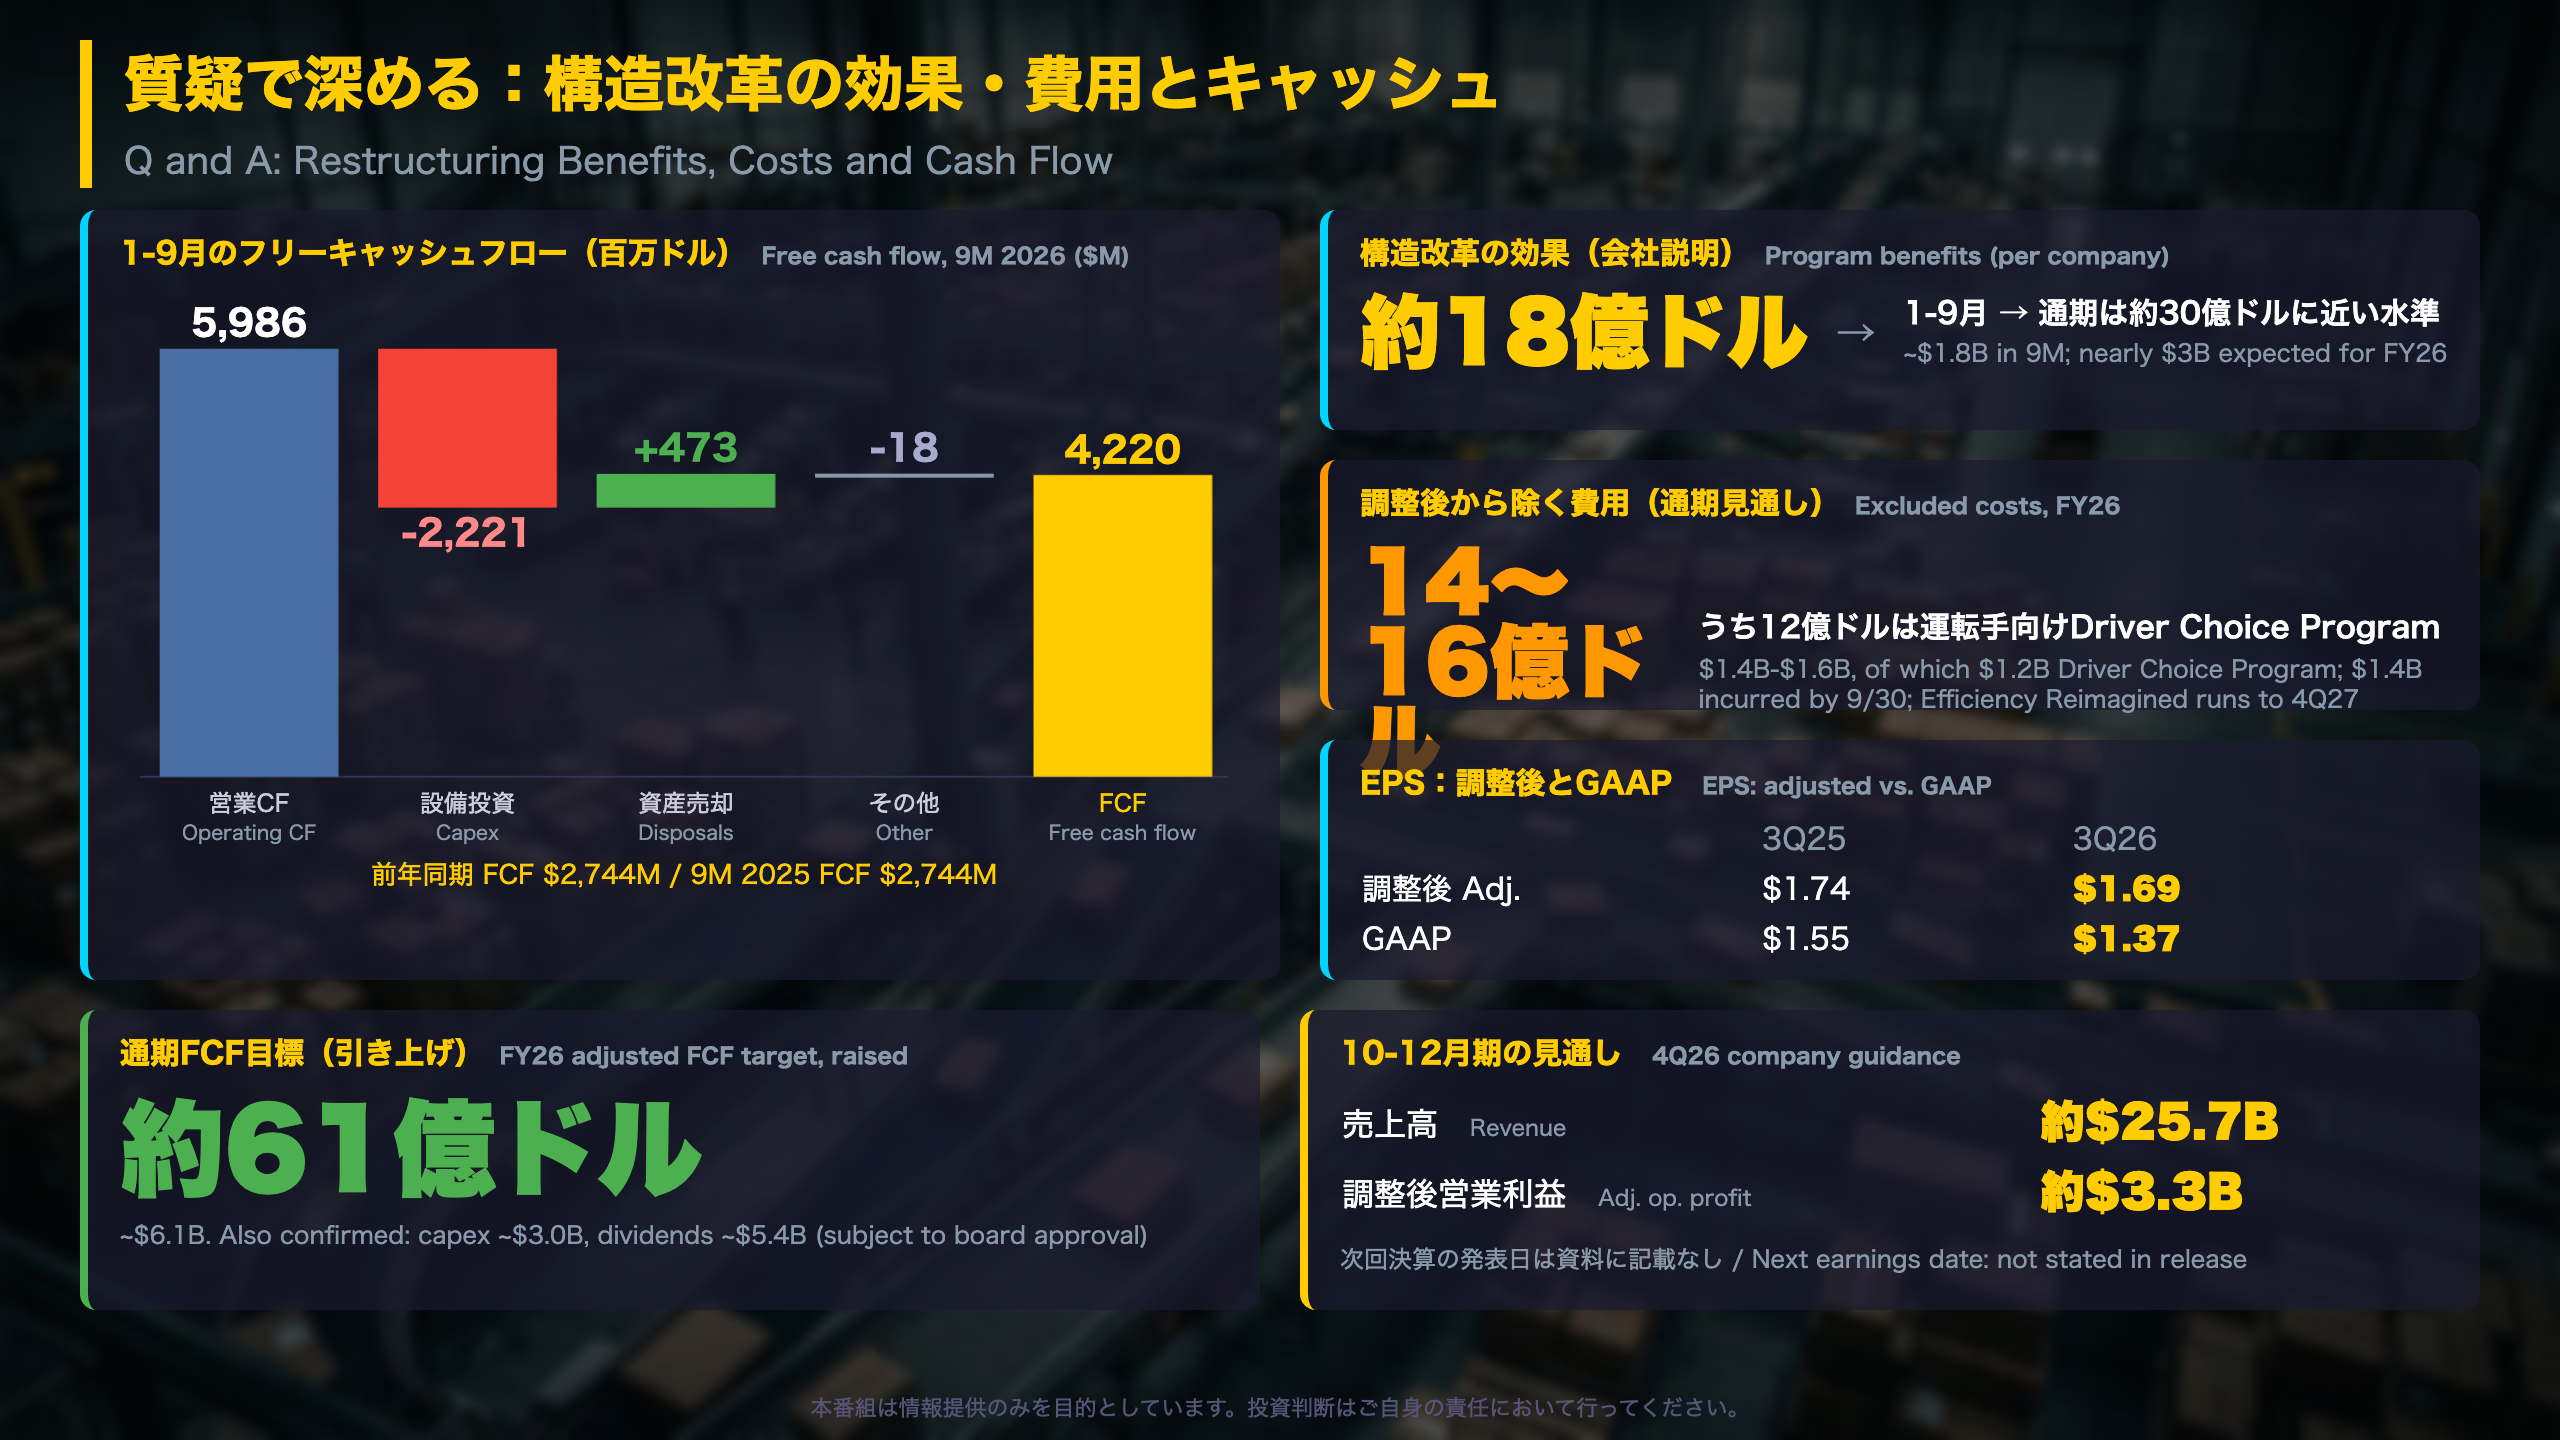
Restructuring: benefits, costs and cash
UPS is running a multi-year program (Network of the Future, Network Reconfiguration and Efficiency Reimagined) to automate sorting, consolidate facilities and cut its workforce as volume from its largest customer is reduced. The company also refers to its 2023 labor negotiations as one factor behind past diversions of volume.
| Item | Figure |
|---|---|
| Program benefits, first nine months | about $1.8B |
| Expected FY26 benefits | nearly $3B |
| Costs excluded from adjusted results, FY26 | $1.4B to $1.6B ($1.2B Driver Choice Program) |
| Incurred through September 30 | $1.4B in 2026; $1.9B cumulative |
Cash flow, nine months ($M)
Operating cash flow was $5,986 (PY $5,148), capital expenditure $2,221 (PY $2,969), disposal proceeds $473, giving free cash flow of $4,220 versus $2,744. UPS also confirmed capex of about $3.0B, dividends of about $5.4B (subject to board approval), a tax rate near 23% and $1.3B of pension contributions. The adjusted FCF target is about $6.1B.
Why GAAP and adjusted both matter
Adjusted figures strip out costs that UPS calls non-ordinary, but those costs are real cash and expense, and Efficiency Reimagined runs until the fourth quarter of 2027. GAAP EPS was $1.37 versus $1.55 while adjusted EPS was $1.69 versus $1.74.
Balanced view
Positive: benefits are being realised and cash generation is ahead of last year. Cautionary: costs continue for several more quarters and GAAP earnings sit below adjusted earnings.
What to watch
Actual 4Q26 results versus the company’s outlook (revenue about $25.7B, adjusted operating profit about $3.3B). The next release date is not stated in this document.
Disclaimer: This article is for informational purposes only. All investment decisions are made solely at your own risk.