📺 Watch the Full Video Analysis
This article was automatically generated by the NFC Market Live AI analysis system. (Updated: 2026-06-25 10:38 JST)
📄 Primary Source
Australian Bureau of Statistics
https://www.abs.gov.au/statistics/labour/employment-and-unemployment/labour-force-australia/latest-release
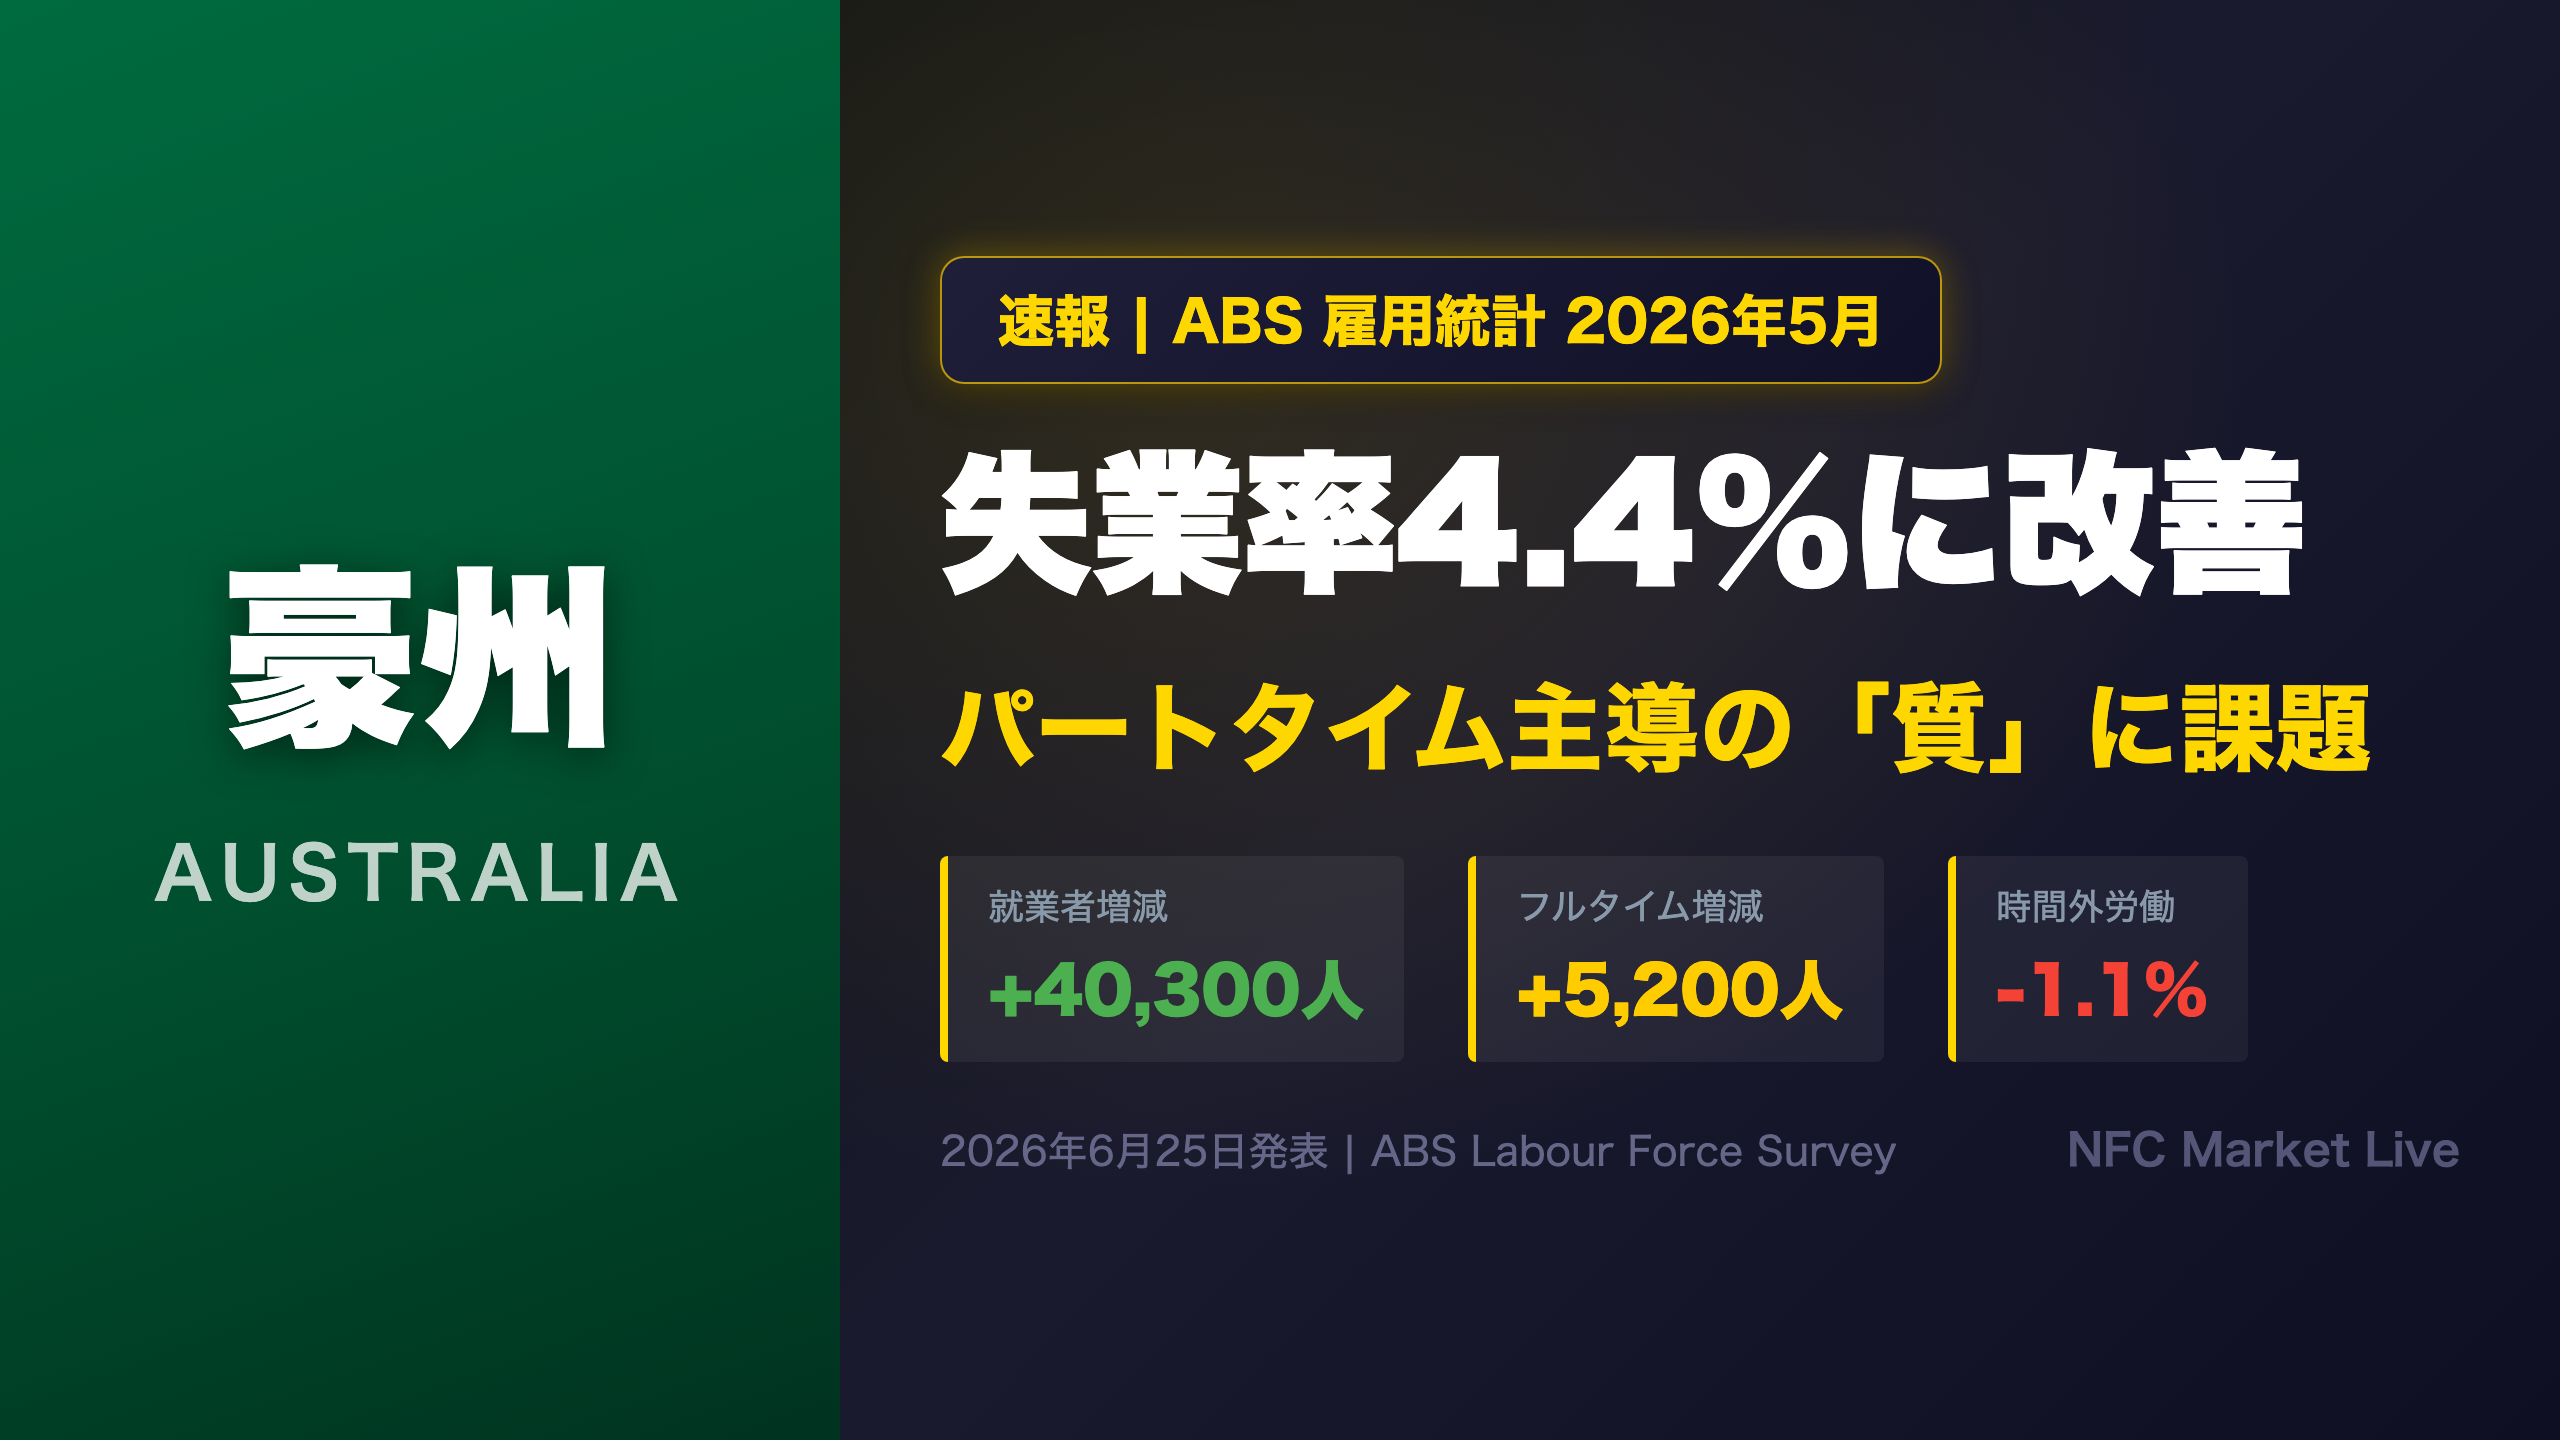
Deep dive into Australia’s May 2026 Labour Force data (ABS). Headline employment surged +40,300 but 87% came from part-time jobs (+35,200 vs full-time +5,200). Unemployment fell to 4.4% seasonally adjusted, yet the trend rate ticked up to 4.4%. Hours worked dropped 1.1% despite employment gains. We analyze what this mixed picture means for the RBA’s rate cut trajectory and the AUD.
The Ultimate Summary:5月雇用統計の決定的インプリケーション
Australia May 2026 Labour Force: The Quantity-Quality Divergence
What the ABS Reported
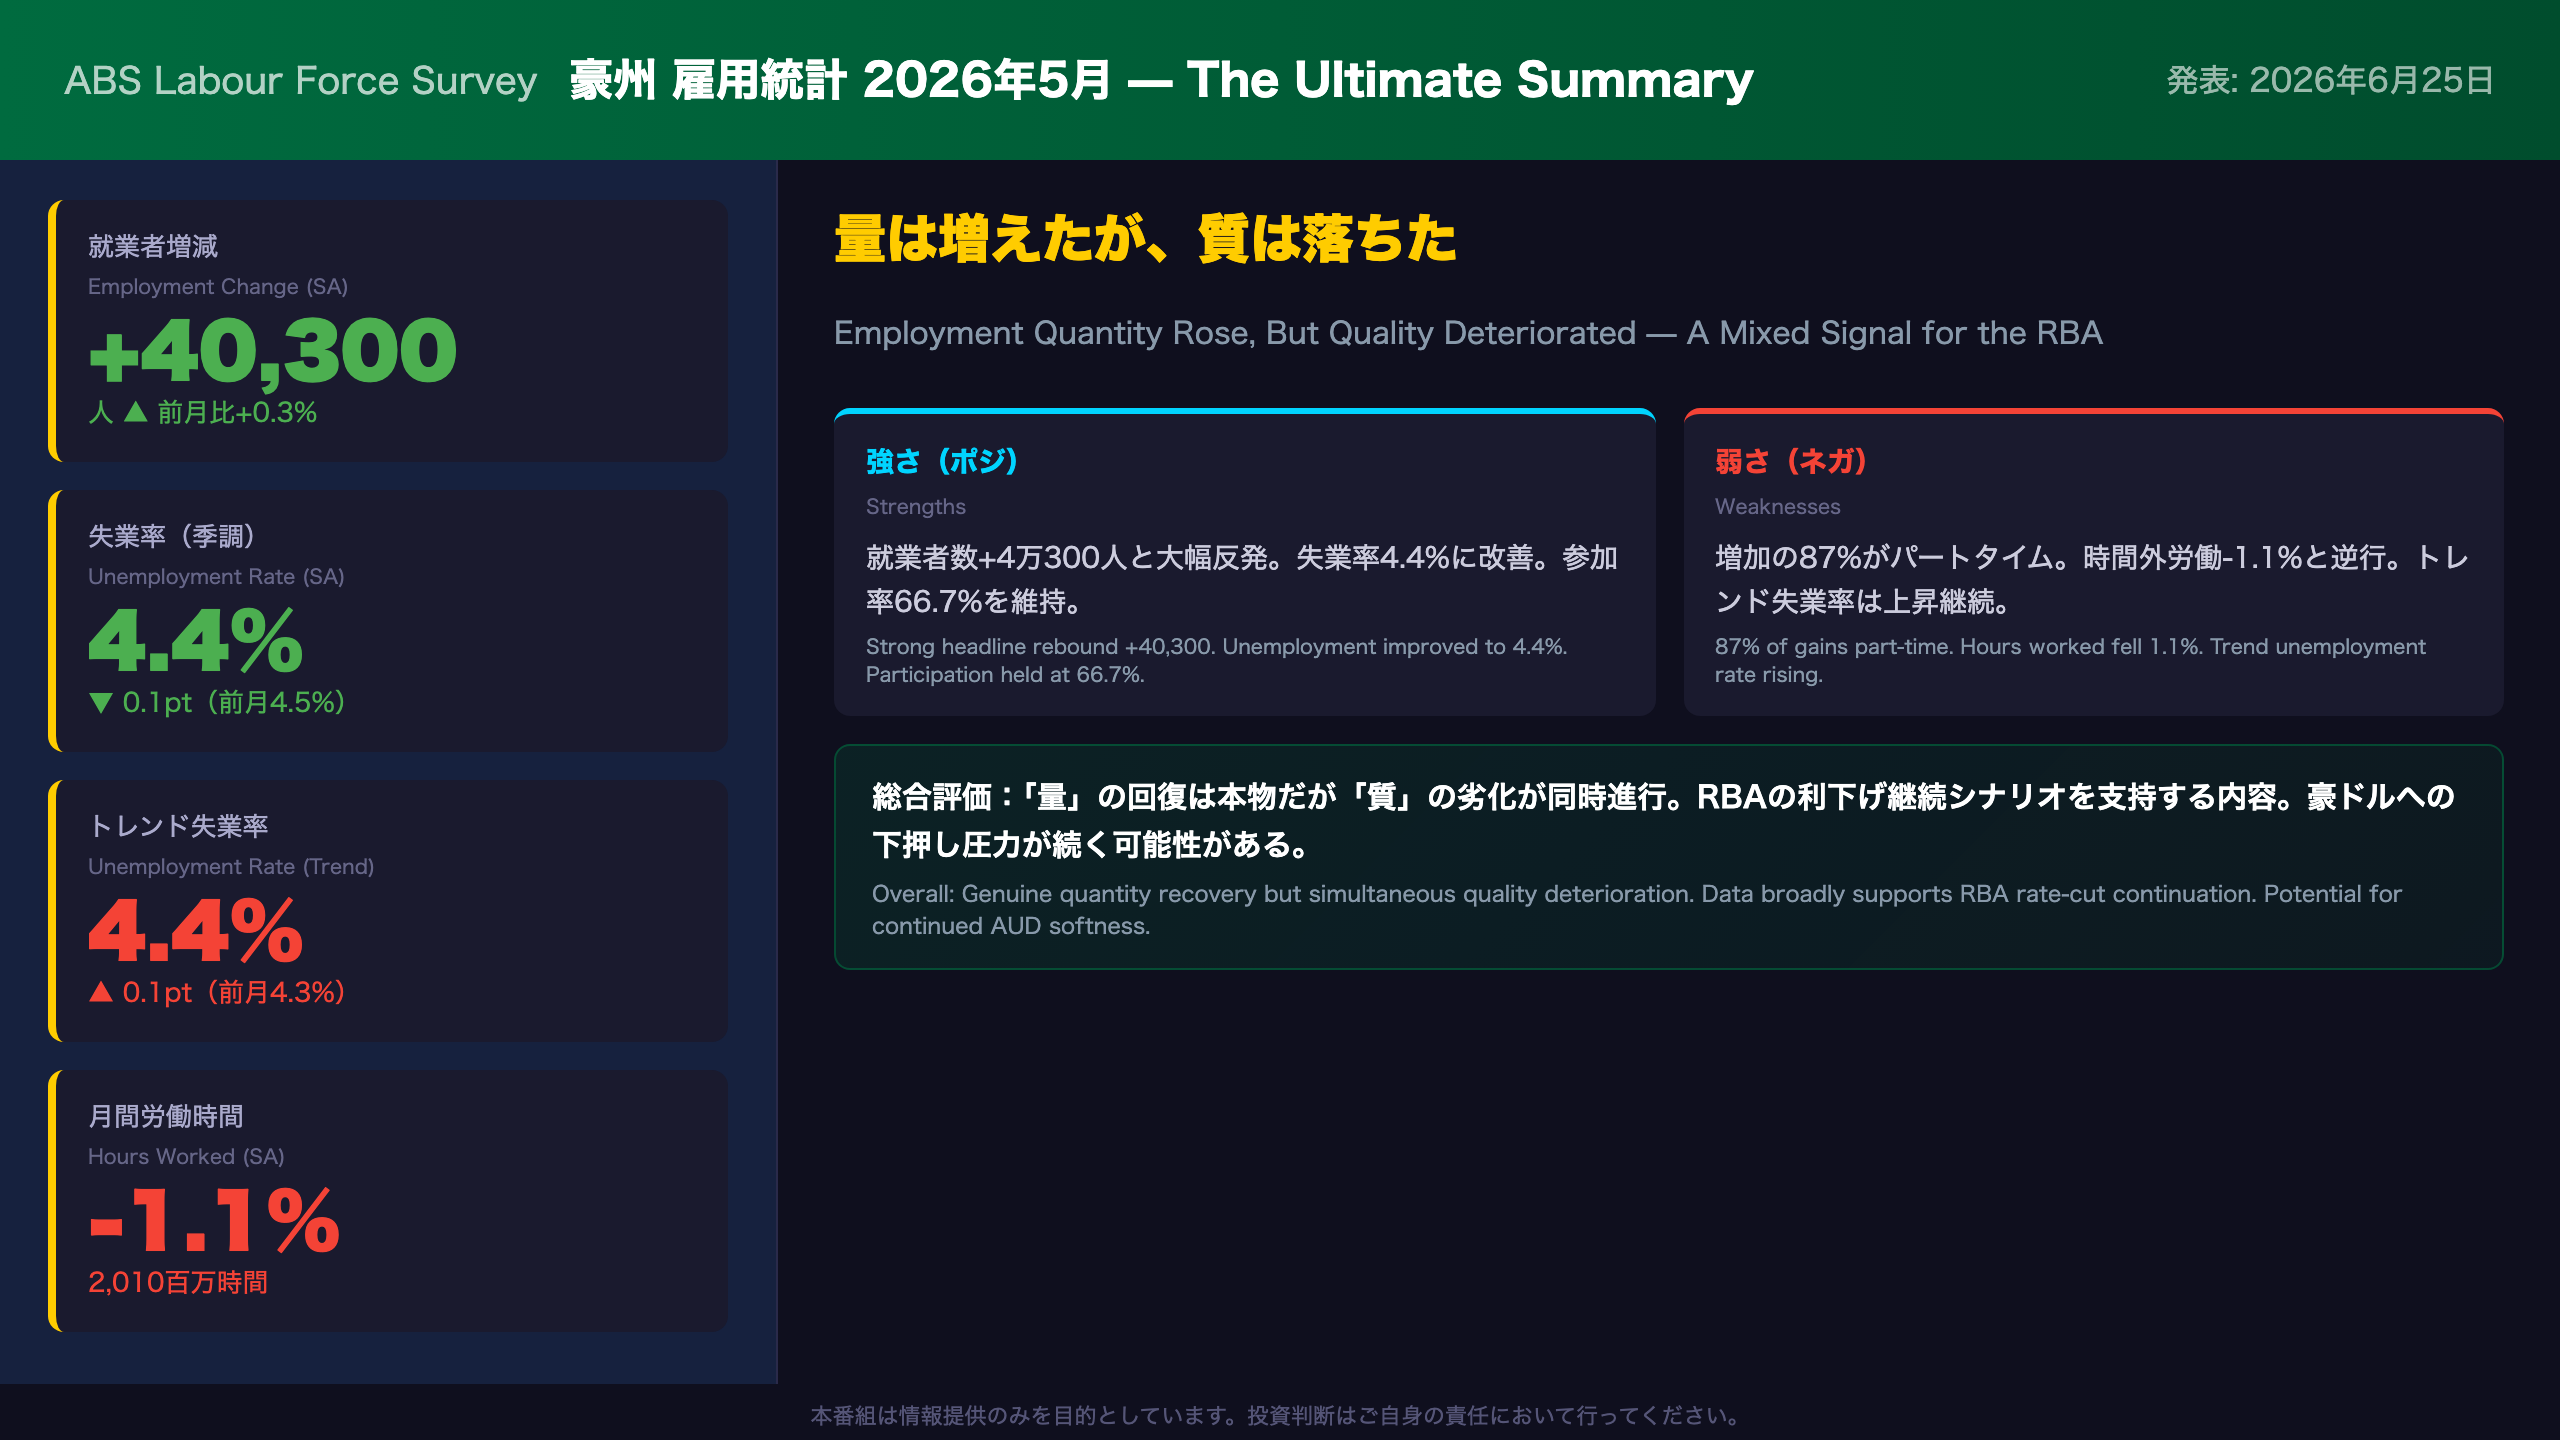
The Australian Bureau of Statistics (ABS) releases the Labour Force Survey monthly, providing the most comprehensive snapshot of Australia’s employment conditions. The May 2026 release, published on June 25, showed a headline employment gain of +40,300 persons (seasonally adjusted), reversing April’s decline of -18,600. The unemployment rate improved by 0.1 percentage point to 4.4%.
The Critical Decomposition: Full-Time vs Part-Time
The headline number masks a significant quality concern:
- Full-time employment: +5,200 (only 13% of total gains)
- Part-time employment: +35,200 (87% of total gains)
This part-time dominance is notable. In a genuinely tight labour market, employers typically add full-time workers first. The skew toward part-time suggests businesses may be cautious about committing to permanent headcount expansion — though one month of data is insufficient to confirm a structural shift.
Hours Worked: The Contradictory Signal
Perhaps the most striking data point: monthly hours worked fell 1.1% (-21.5 million hours) to 2,010 million hours, even as employment rose 0.3%. This divergence implies average hours per worker declined — consistent with the part-time-heavy composition of new jobs. The employment-hours index (June 2022 = 100) shows employment at 108.5 while hours worked fell back to 108.4, erasing the gap that had opened in April.
Trend Data: The Underlying Story
The ABS recommends trend data as the best measure of underlying labour market behaviour. Key trend readings for May 2026:
– Unemployment rate: 4.4% (up from 4.3% in April) — a meaningful uptick
– Employment: +20,200 (steady, moderate growth)
– Underemployment rate: 5.8% (trend, stable)
The trend unemployment rate rising to 4.4% is significant: it confirms that the gradual softening of labour market conditions is not a statistical artifact but a genuine underlying trend.
RBA Policy Implications
The Reserve Bank of Australia (RBA) has been in a rate-cutting cycle. This report broadly supports continuation:
1. Easing wage pressure: Part-time dominance + falling hours → reduced aggregate labour income growth → lower inflationary pressure from wages
2. Rising trend unemployment: Gradual loosening of the labour market reduces the risk of a wage-price spiral
3. Counterpoint: The headline employment gain of +40,300 is strong and could give the RBA pause about cutting too aggressively
AUD Implications
Softer-than-expected labour quality data → sustained RBA rate cut expectations → potential downward pressure on AUD/USD. However, the strong headline number may limit the immediate AUD downside. The net effect is likely modest and data-dependent.
Next Release
June 2026 Labour Force data is scheduled for release on July 23, 2026. Key thresholds to watch: trend unemployment approaching 4.5%, and whether full-time employment recovers.
雇用の「質」を解剖:フルタイム vs パートタイムの内訳
Dissecting Employment Quality: Full-Time vs Part-Time in May 2026
The Composition Problem
When the ABS reports employment changes, it distinguishes between full-time and part-time workers — a distinction that matters enormously for assessing the health of the labour market. Full-time employment (35+ hours per week) provides stable income, benefits, and is typically associated with higher productivity. Part-time work, while valuable, often reflects either worker preference for flexibility or employer caution about committing to permanent headcount.
May 2026 Breakdown
Of the +40,300 total employment gain:
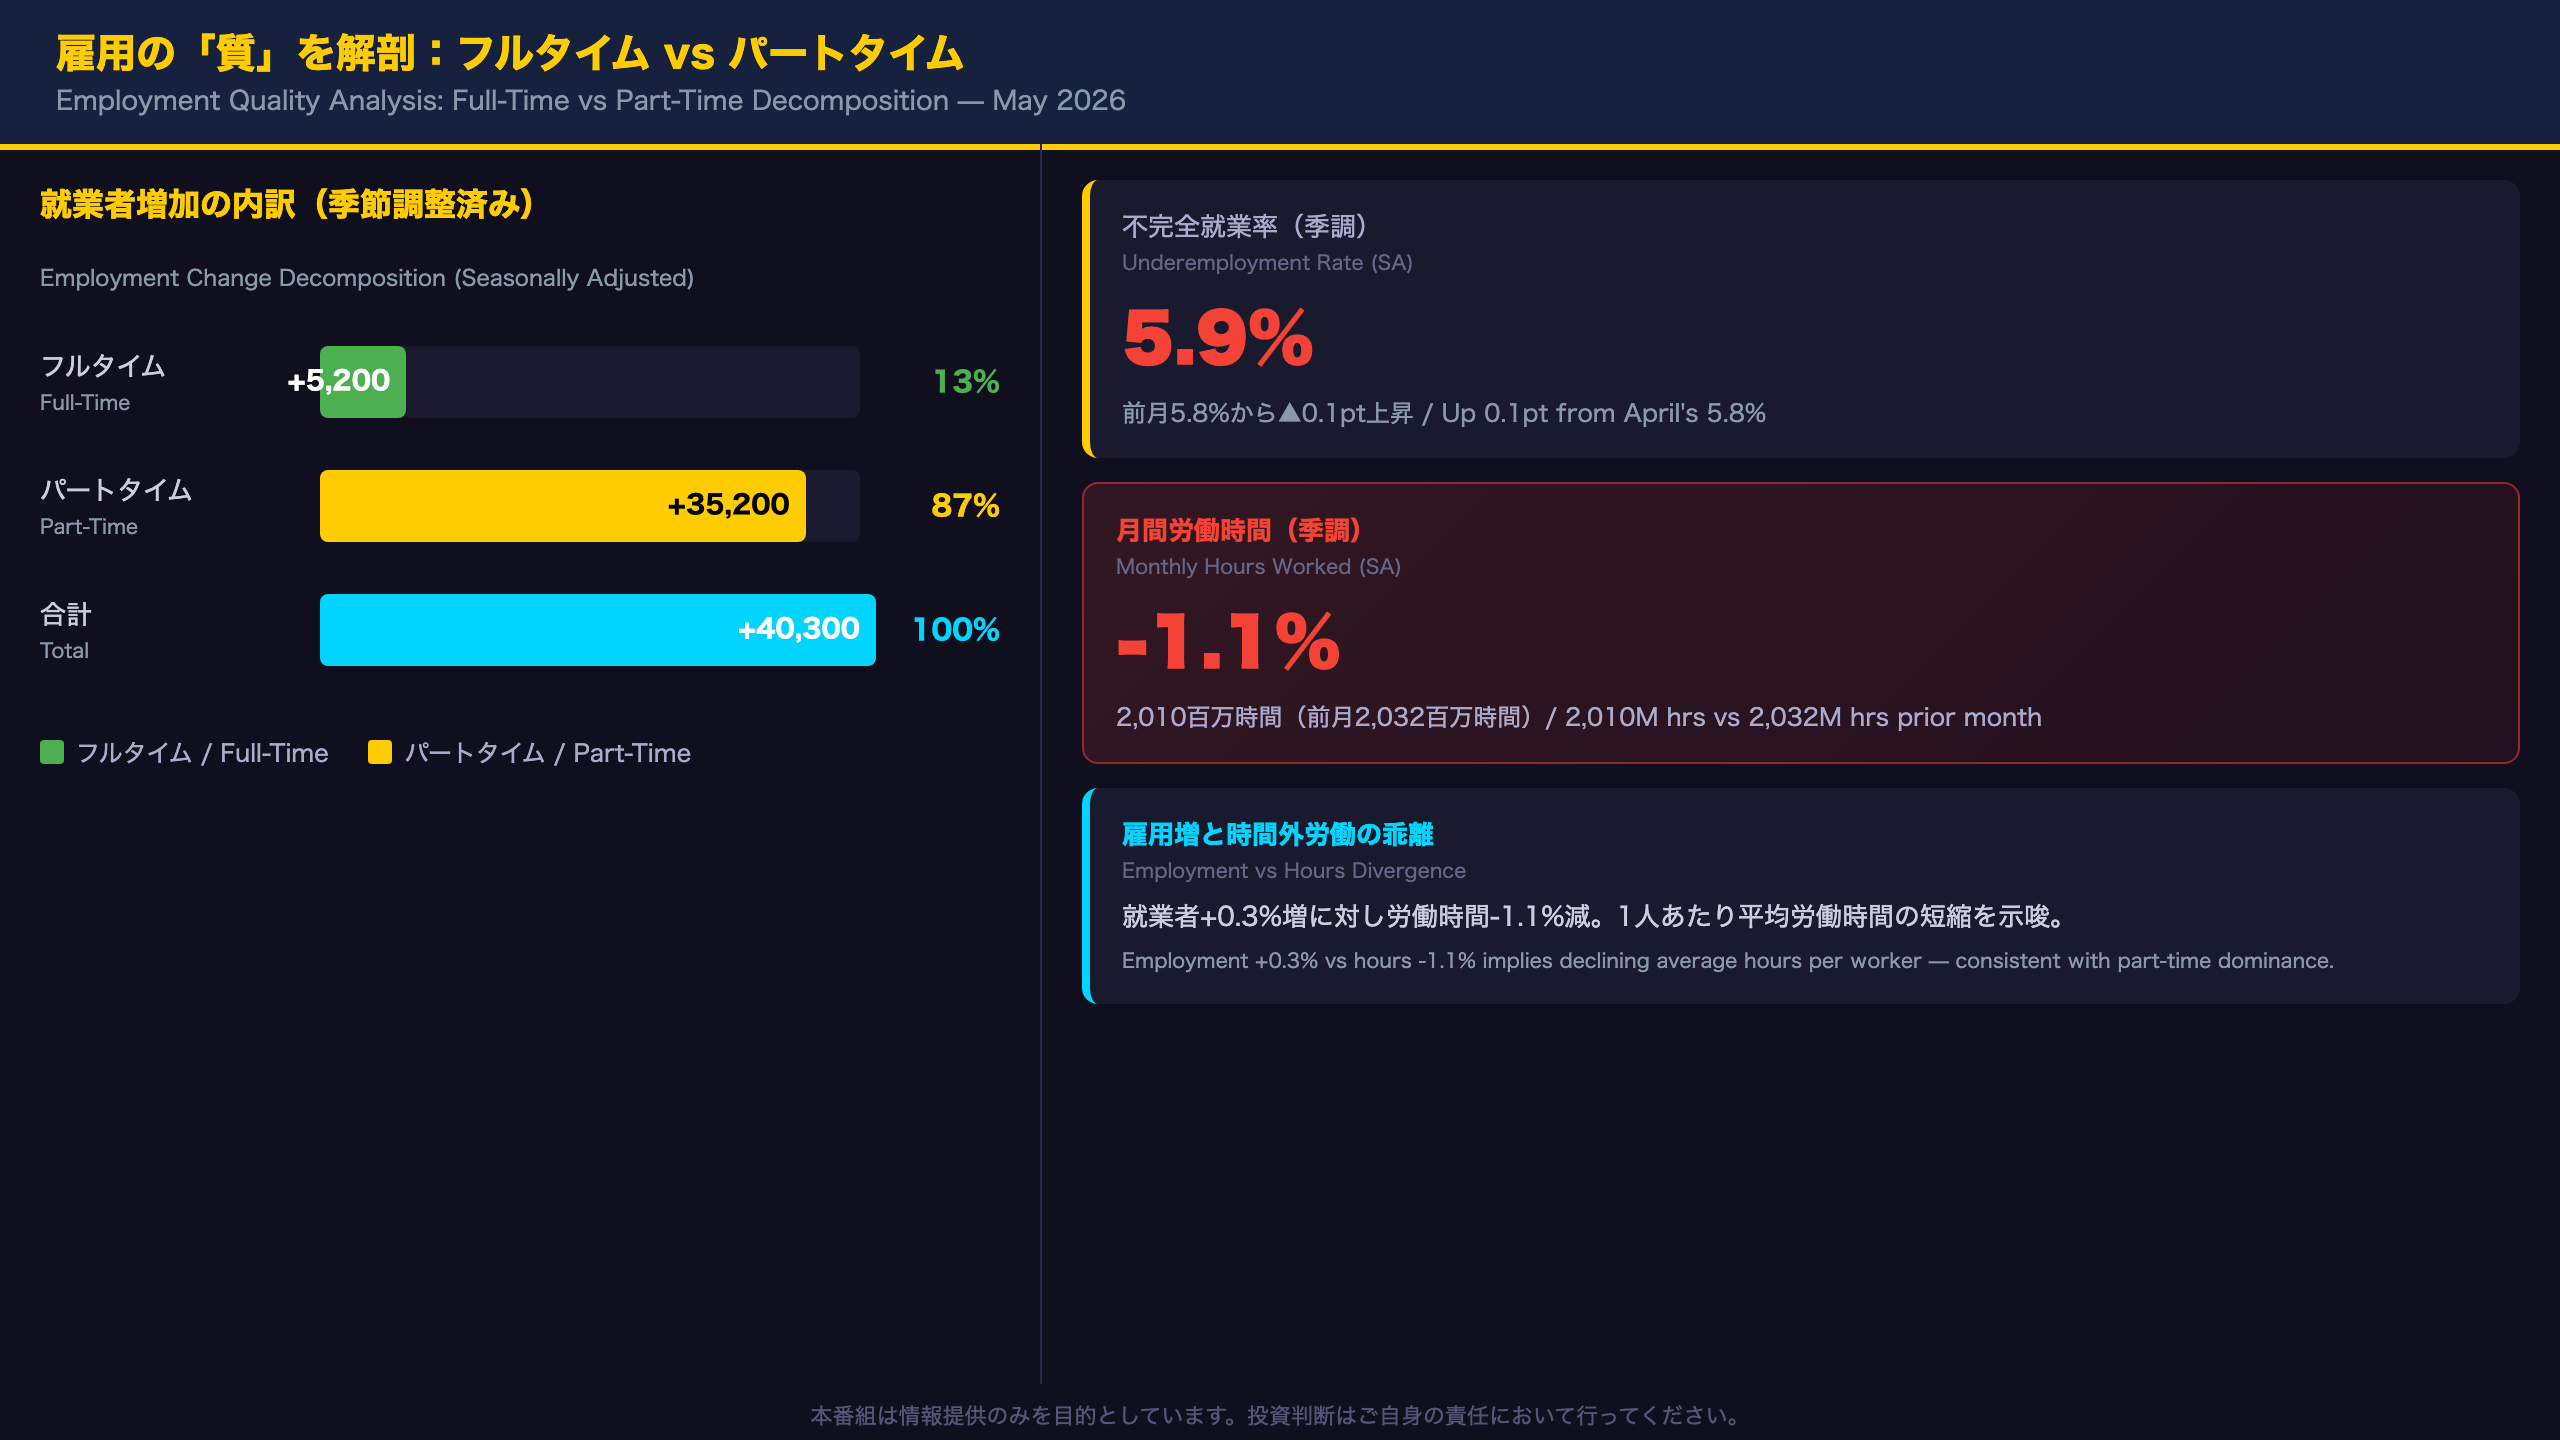
– Full-time: +5,200 persons (13% of total)
– Part-time: +35,200 persons (87% of total)
This is a notably skewed composition. For comparison, in periods of strong labour market tightness (e.g., 2022-2023), full-time employment typically drove a larger share of monthly gains.
The Hours Worked Divergence
The most striking data point is the divergence between employment and hours worked. While employment rose +0.3%, monthly hours worked fell -1.1% to 2,010 million hours. This implies average hours per worker declined — directly consistent with the part-time-heavy composition of new jobs.
The employment-hours index (June 2022 = 100) illustrates this clearly:
– Employment index: 108.5 (May 2026)
– Hours worked index: 108.4 (May 2026, down from 109.6 in April)
The gap between employment and hours that had opened in April has now closed, suggesting the April hours surge was partly a one-off.
Underemployment: The Hidden Slack
The underemployment rate rose 0.1 percentage point to 5.9% (seasonally adjusted). Underemployed workers are those who are employed but want and are available to work more hours. A rising underemployment rate alongside rising part-time employment is internally consistent — more workers are in part-time roles but would prefer full-time work.
The underutilisation rate (unemployment + underemployment) fell marginally to 10.2%, but remains elevated relative to the 2022 trough of approximately 9.5%.
Bull vs Bear Interpretation
Bull case: Part-time growth may reflect structural shifts in workforce preferences (students, caregivers, semi-retired workers) rather than employer caution. The stable participation rate of 66.7% supports this.
Bear case: Stagnant full-time employment + rising part-time + falling hours = employers are managing costs cautiously, consistent with a softening demand environment. Single-month data cannot confirm this, but the trend warrants monitoring.
失業率・参加率・不完全就業率:トレンドが語る真実
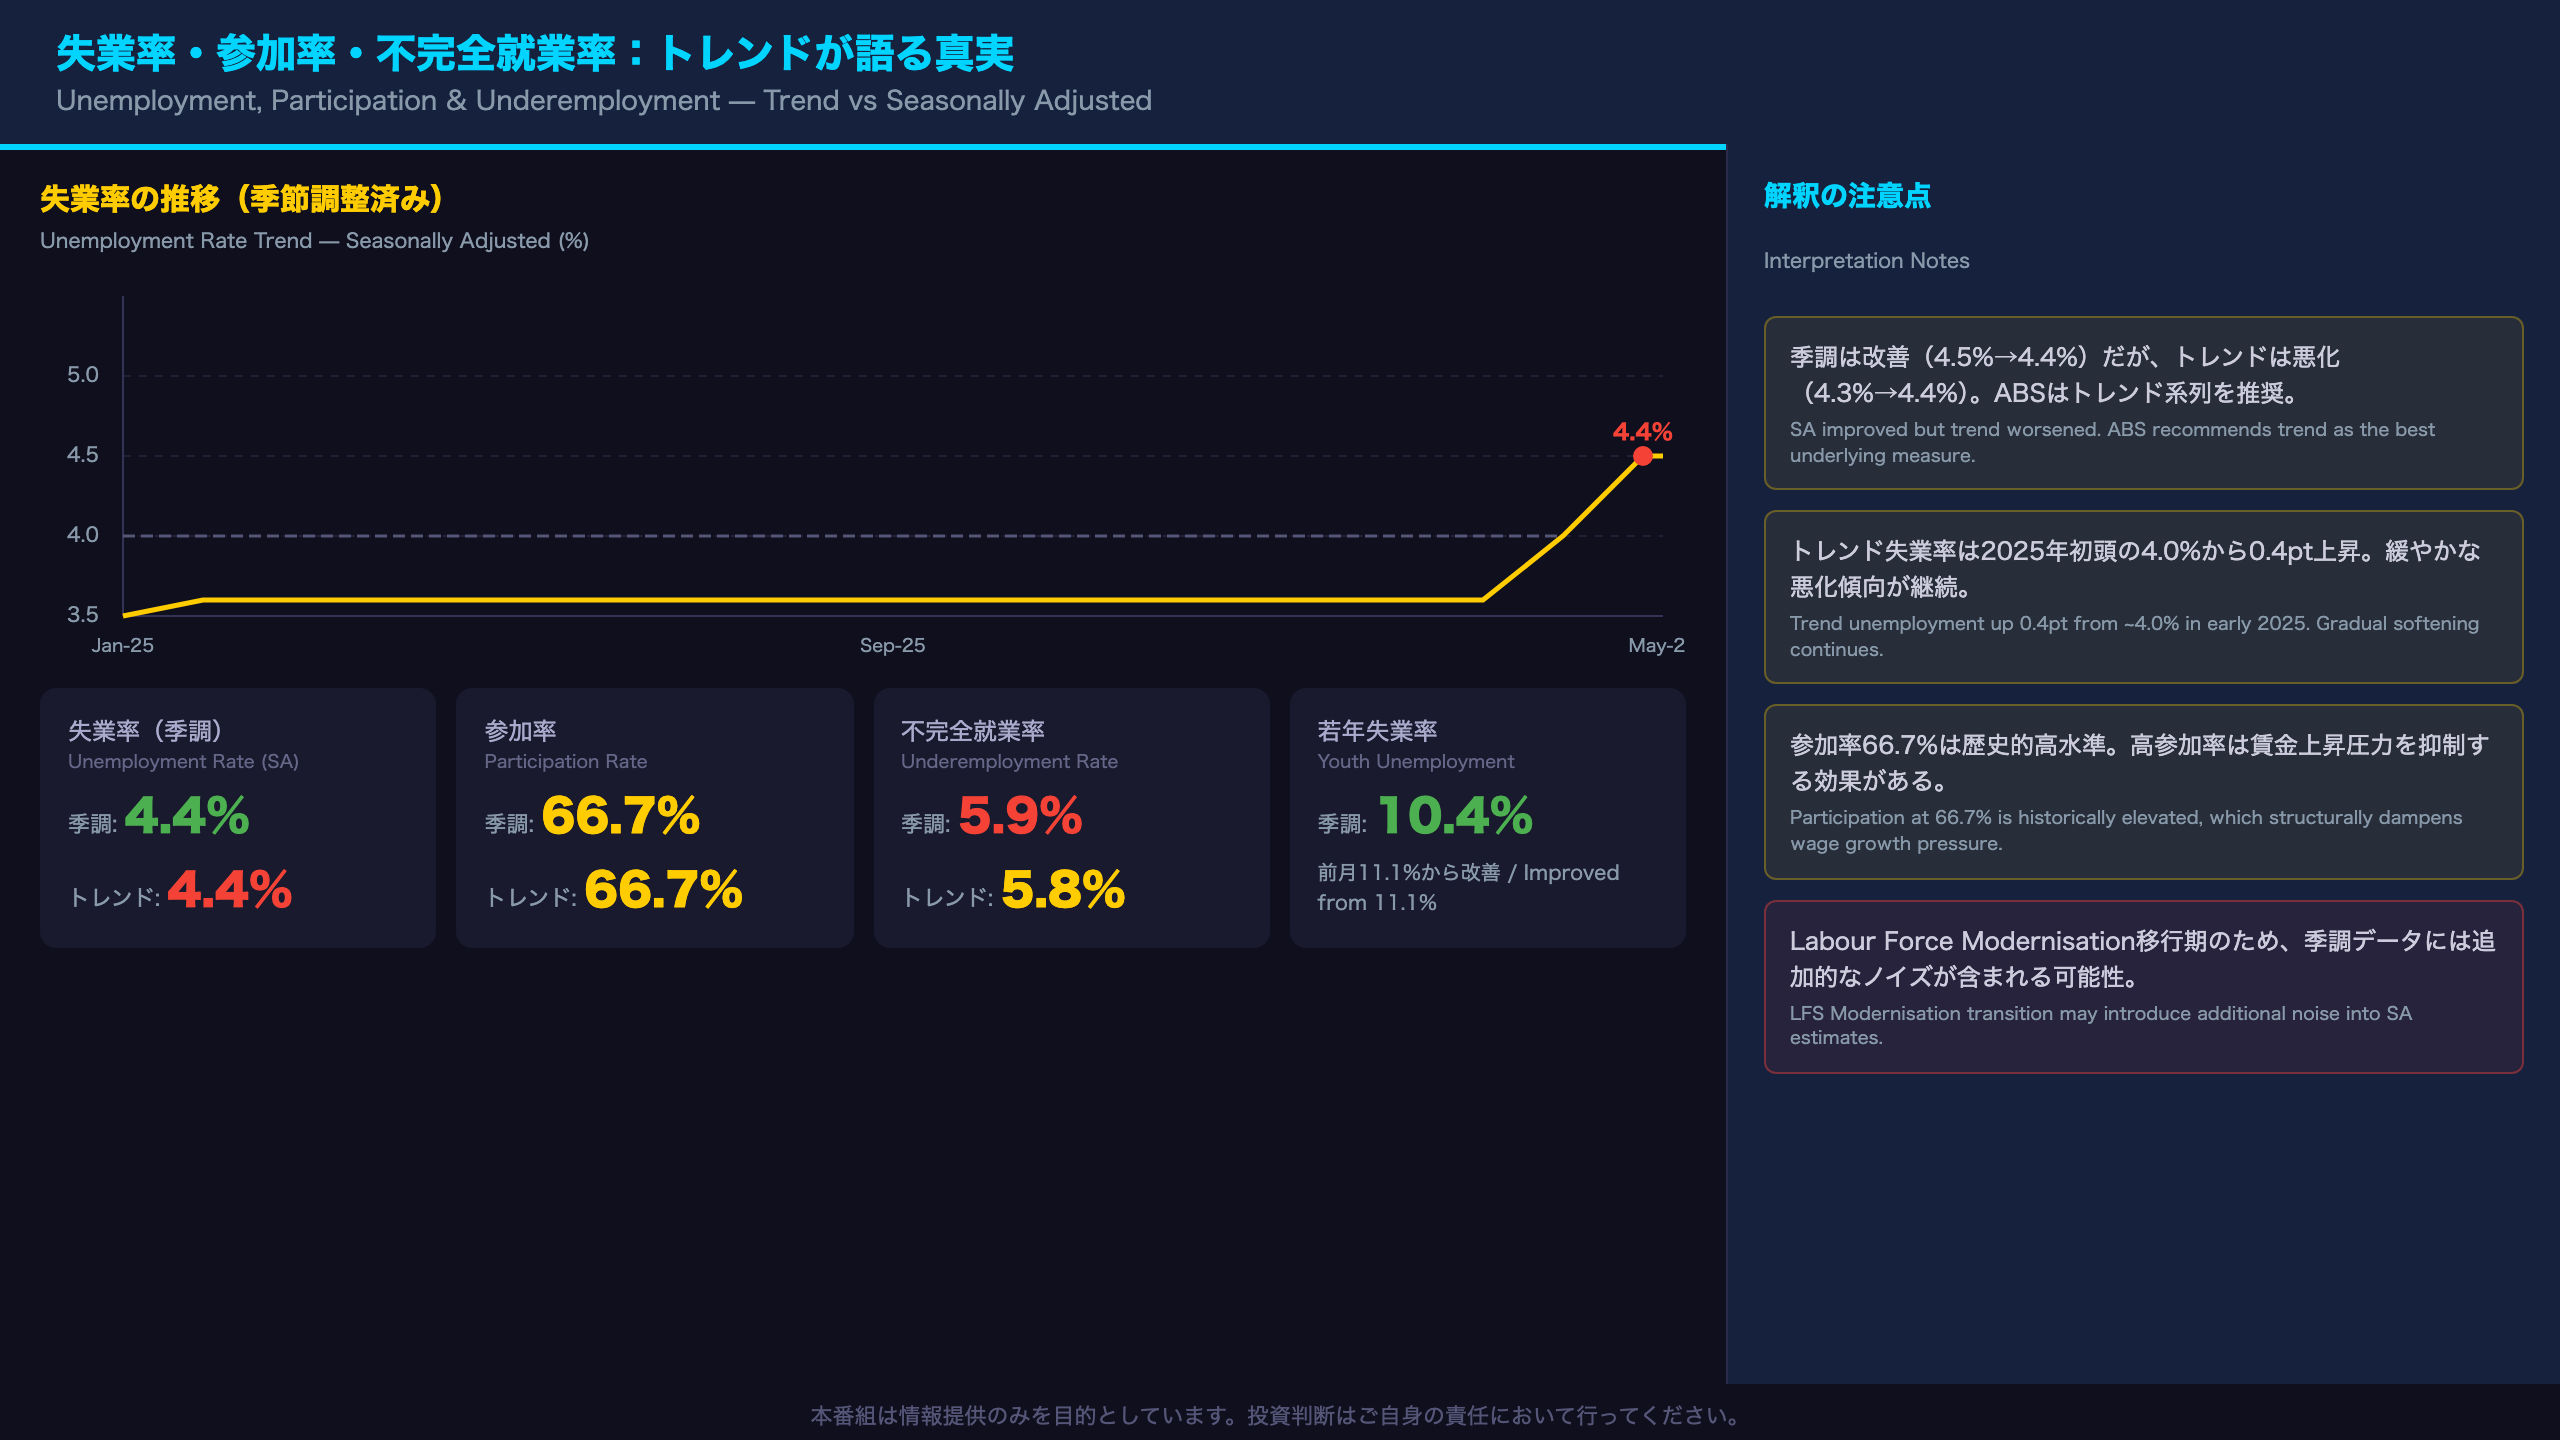
Unemployment, Participation, and Underemployment: A Multi-Dimensional Labour Market Assessment
The SA vs Trend Divergence
The ABS explicitly recommends trend data as the best measure of underlying labour market behaviour, as it removes month-to-month volatility. This distinction is particularly important during the current Labour Force Modernisation transition, where rotation group changes can introduce additional noise into seasonally adjusted estimates.
For May 2026:
– Seasonally adjusted unemployment: 4.4% (improved from 4.5%)
– Trend unemployment: 4.4% (deteriorated from 4.3%)
The trend series is telling a different story from the headline: the underlying direction of the labour market is toward gradual softening.
The Trend Unemployment Trajectory
The trend unemployment rate has risen from approximately 4.0% in early 2025 to 4.4% in May 2026 — a 0.4 percentage point increase over roughly 16 months. This is a gradual but consistent upward drift. The RBA’s estimate of the Non-Accelerating Inflation Rate of Unemployment (NAIRU) is generally thought to be around 4.5%, meaning the current rate is approaching that threshold.
Participation Rate: Historically Elevated
At 66.7%, Australia’s participation rate remains near multi-decade highs. For context, the rate was around 64.9% in 2016. The sustained elevation reflects:
1. Immigration-driven labour force expansion: Australia’s strong net overseas migration has added workers across age groups
2. Female participation gains: Women’s participation has risen structurally over the past decade
3. Older worker retention: Superannuation incentives and health improvements have kept older Australians in the workforce longer
High participation is a double-edged sword: it supports economic output but also means more workers competing for jobs, which can dampen wage growth.
Underemployment: The Hidden Slack Indicator
The underemployment rate rose to 5.9% (SA) in May, up from 5.8% in April. Underemployed workers — those who are employed but want and are available to work more hours — represent a form of hidden labour market slack. The underutilisation rate (unemployment + underemployment) fell marginally to 10.2%, but remains well above the 2022 trough of approximately 9.5%.
Youth Unemployment
Youth unemployment (15-24 years) improved to 10.4% from 11.1% in April. However, youth employment is highly seasonal (school/university cycles), and single-month improvements should be interpreted cautiously. The rate remains more than double the headline unemployment rate.
州別・地域別の分散:豪州労働市場の「二極化」
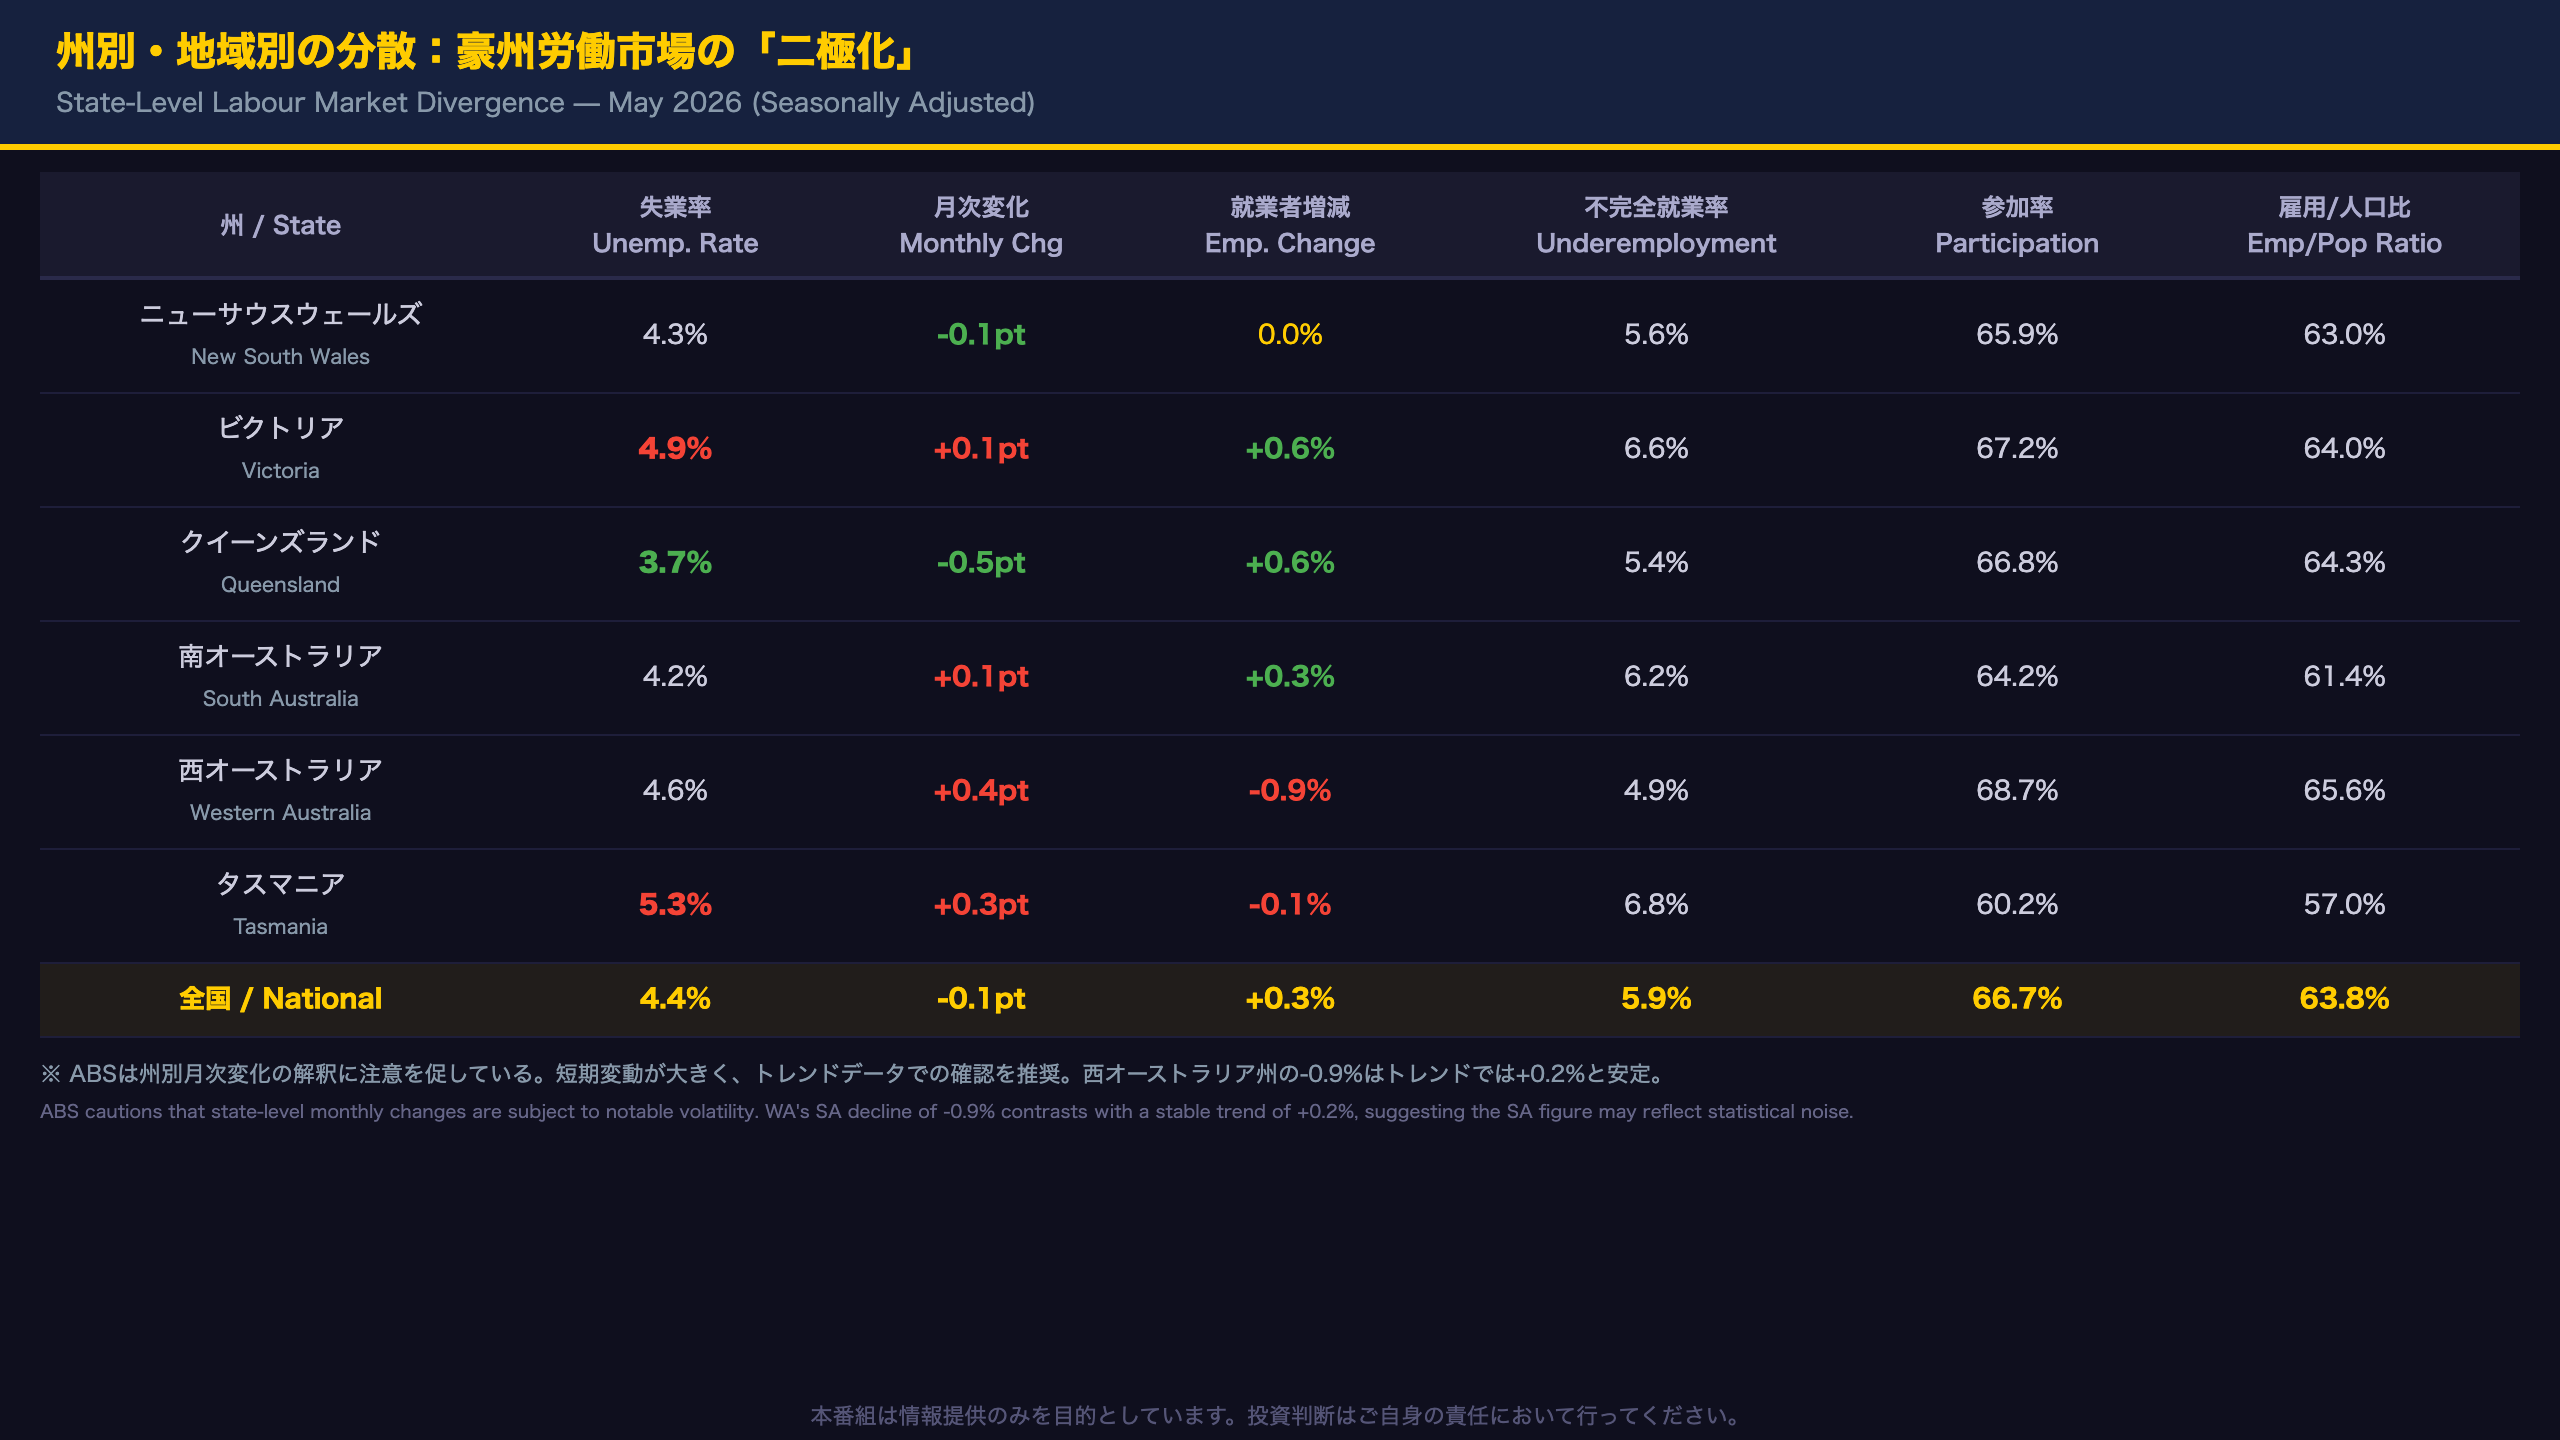
State-by-State Labour Market: Reading Australia’s Regional Divergence
The Geographic Patchwork
Australia’s labour market is not a single entity — it is a collection of distinct regional economies with very different industrial structures, population dynamics, and cyclical positions. The May 2026 state-level data reveals significant divergence.
Key State Metrics (May 2026, Seasonally Adjusted)
| State | Unemployment | Monthly Change | Employment Change | Participation |
|---|---|---|---|---|
| New South Wales | 4.3% | -0.1pt | 0.0% | 65.9% |
| Victoria | 4.9% | +0.1pt | +0.6% | 67.2% |
| Queensland | 3.7% | -0.5pt | +0.6% | 66.8% |
| South Australia | 4.2% | +0.1pt | +0.3% | 64.2% |
| Western Australia | 4.6% | +0.4pt | -0.9% | 68.7% |
| Tasmania | 5.3% | +0.3pt | -0.1% | 60.2% |
| National | 4.4% | -0.1pt | +0.3% | 66.7% |
Western Australia: Resource Sector Sensitivity
WA’s employment fell -0.9% month-on-month — the sharpest state-level decline. Western Australia’s economy is heavily concentrated in iron ore, LNG, and other resource exports, making it acutely sensitive to Chinese demand and global commodity prices. However, the ABS explicitly cautions that “state and territory estimates can be subjected to notable month-to-month movements” and recommends trend data for underlying assessment. The WA trend employment change was +0.2%, suggesting the SA decline is likely statistical noise rather than a structural shift.
Victoria: Persistent Weakness
Victoria’s 4.9% unemployment rate (both SA and trend) is the highest among major states. The state experienced Australia’s longest COVID-19 lockdowns, and the structural adjustment of its manufacturing and services sectors continues. The fact that both SA and trend measures show elevated unemployment suggests this is a genuine underlying condition rather than a monthly artifact.
Queensland: The Standout Performer
Queensland’s 3.7% unemployment rate (SA) is the national low. The state benefits from a diversified economic base — tourism, agriculture, resources — and is receiving significant infrastructure investment ahead of the 2032 Brisbane Olympics. The trend rate of 3.9% is slightly higher, but Queensland remains the strongest major state labour market.
Implications for National Policy
The state divergence complicates the RBA’s task. A single national interest rate must serve both Victoria’s relatively weak labour market and Queensland’s tight conditions. This geographic heterogeneity is one reason the RBA focuses on national trend data rather than state-level volatility.
RBA・豪ドル・市場へのインプリケーション
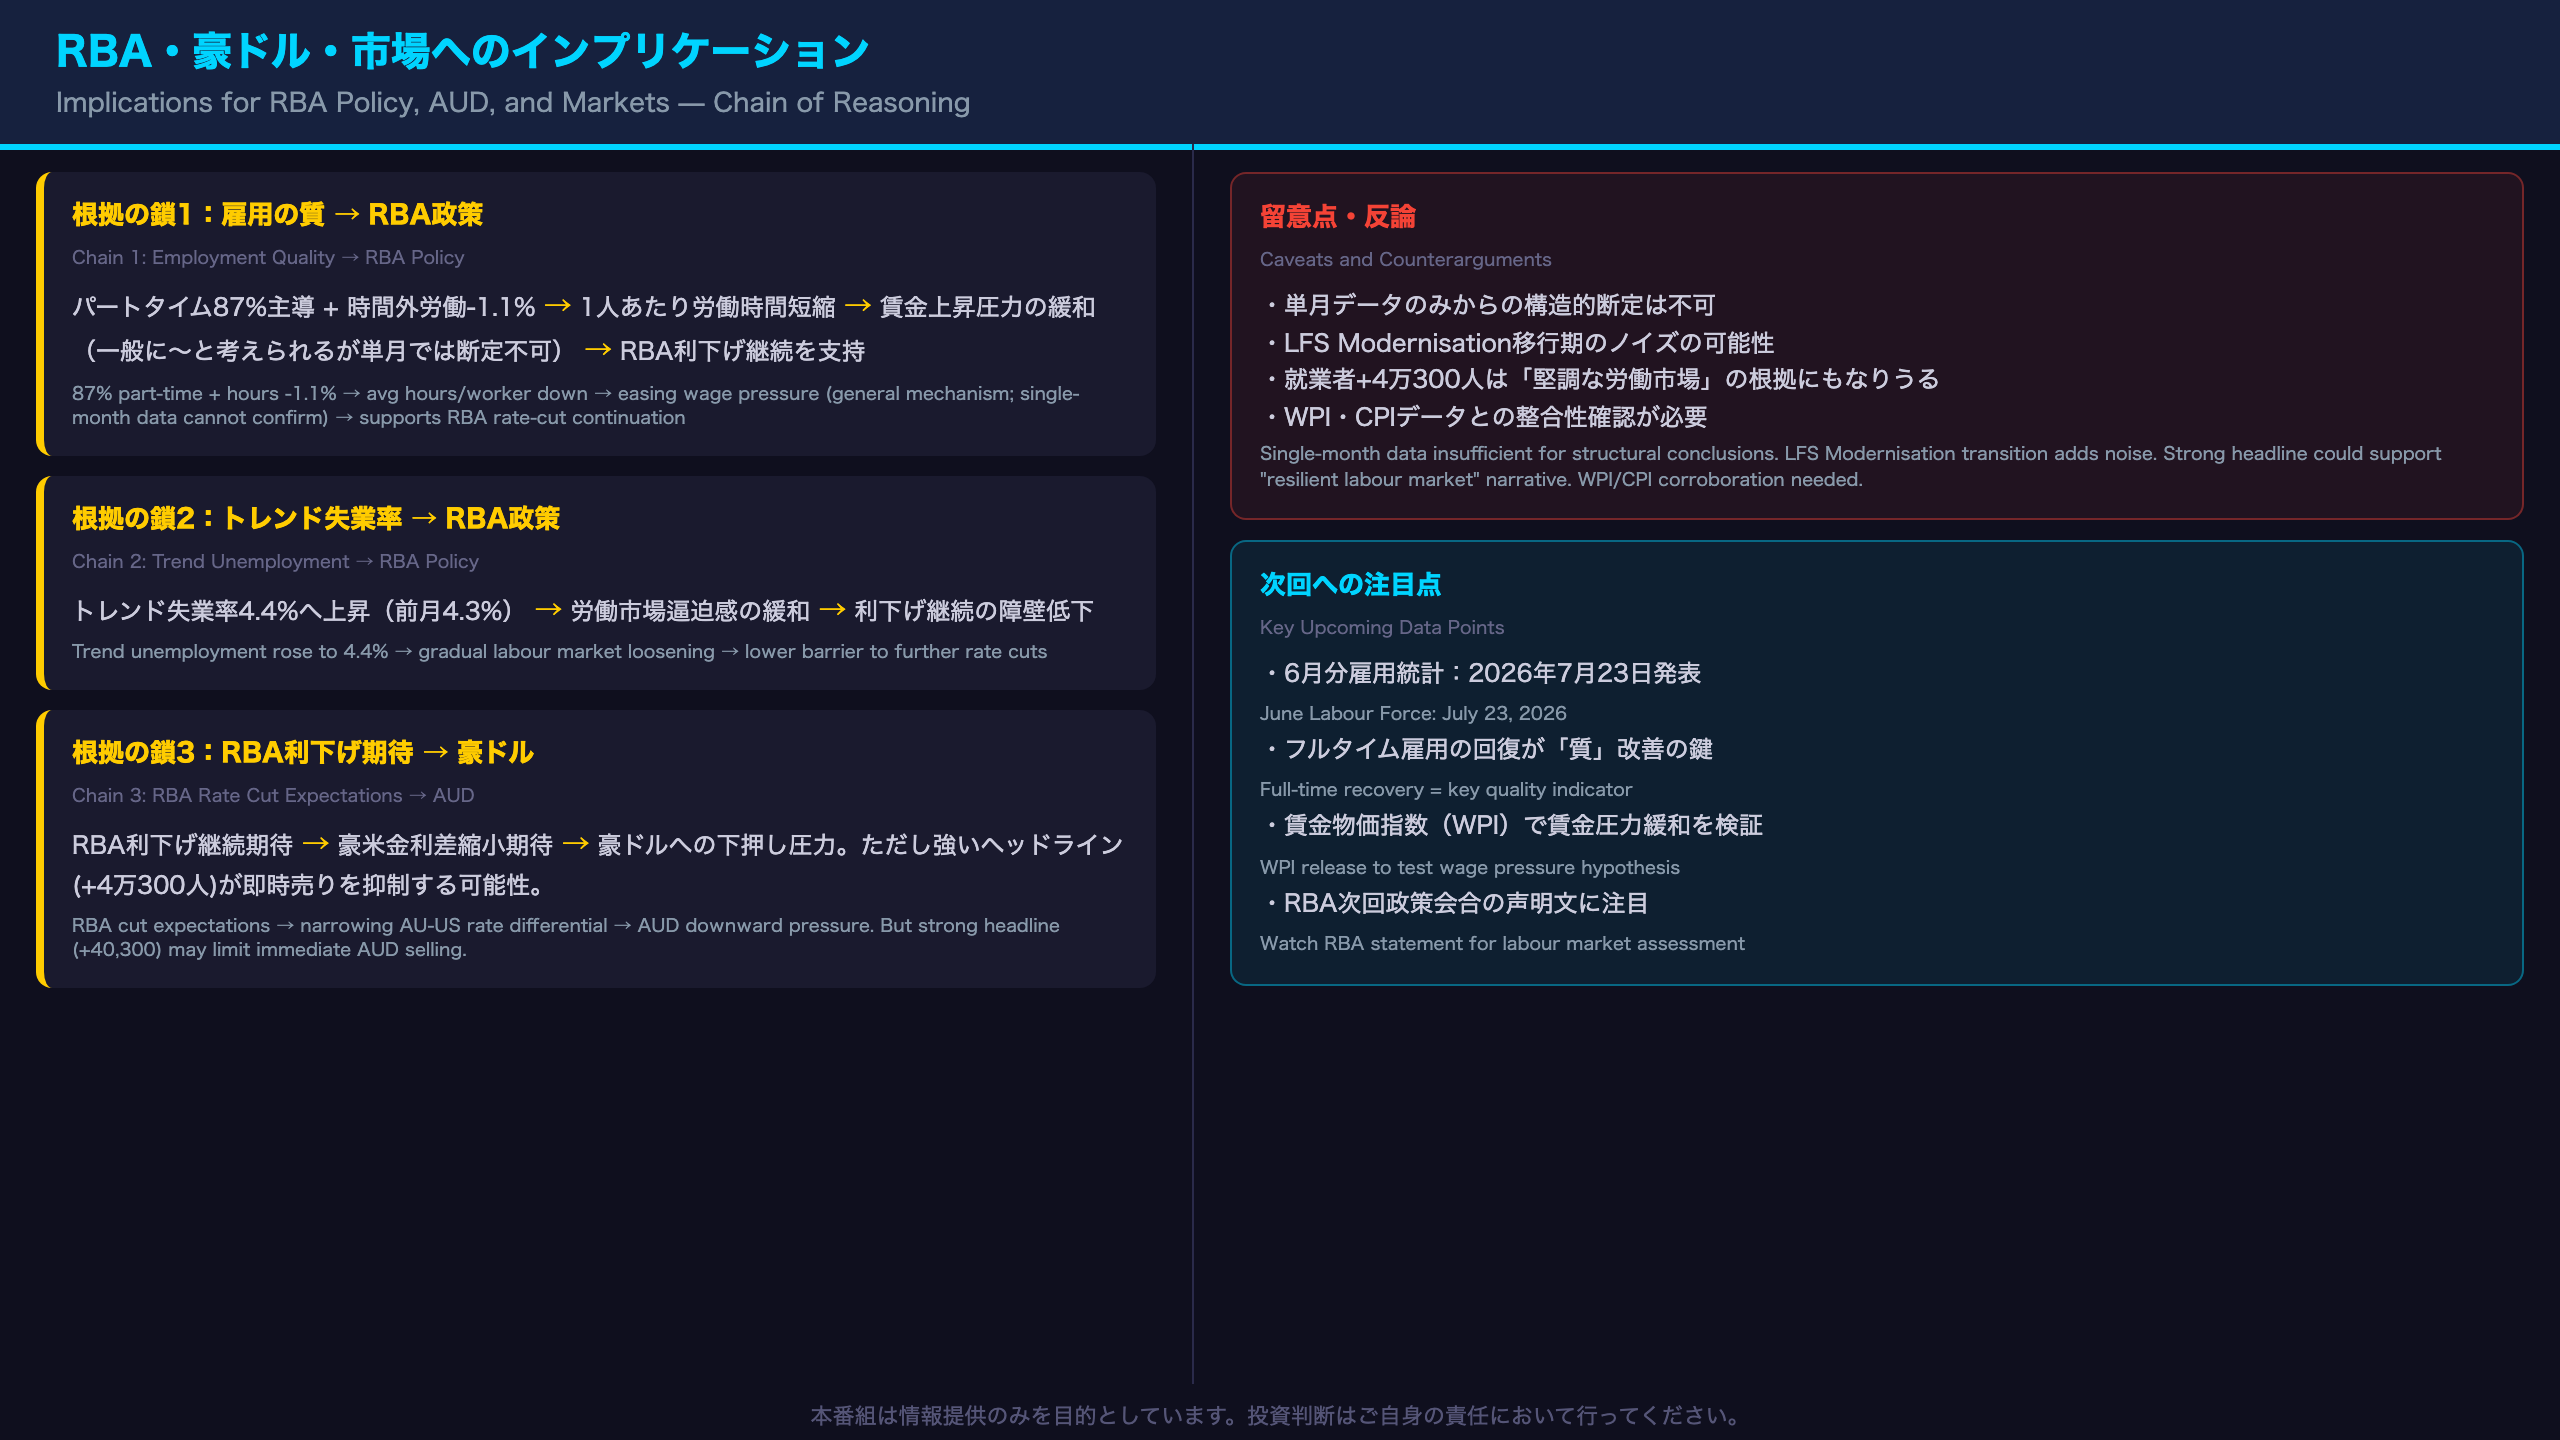
RBA, AUD, and Market Implications: Following the Chain of Reasoning
The Reserve Bank of Australia (RBA) Context
The RBA is Australia’s central bank, equivalent to the Federal Reserve in the US or the Bank of England in the UK. It sets the cash rate (policy interest rate) with a dual mandate of price stability (2-3% inflation target) and full employment. The RBA has been in a rate-cutting cycle following the post-COVID tightening phase.
Chain of Reasoning: Data → Mechanism → Market Implication
Chain 1: Employment Quality → Wage Pressure → RBA Policy
87% of employment gains were part-time (+35,200) + monthly hours worked fell 1.1%
→ Average hours per worker declined → aggregate labour income growth likely subdued
→ Easing wage-push inflationary pressure (this is a general mechanism; single-month data cannot confirm it definitively)
→ Supports continued disinflation → reinforces RBA rate-cut continuation
Chain 2: Trend Unemployment → Labour Market Slack → RBA Policy
Trend unemployment rate rose to 4.4% (from 4.3%)
→ Additional evidence of gradual labour market loosening
→ Reduces the RBA’s concern about a wage-price spiral
→ Lowers the barrier to further rate cuts
Chain 3: RBA Rate Cuts → Interest Rate Differential → AUD
Sustained RBA rate cut expectations
→ Narrowing Australia-US interest rate differential
→ Downward pressure on AUD/USD
However: the strong headline employment number (+40,300) may limit immediate AUD selling
Counterarguments and Caveats
- Single-month limitation: The part-time dominance is a one-month observation. Structural conclusions require multiple months of consistent data.
- LFS Modernisation noise: The ABS is transitioning its survey systems. The incoming rotation group in May had a higher employment-to-population ratio than the outgoing group, which the ABS assessed as within acceptable ranges but which adds uncertainty.
- Strong headline: +40,300 employment is a genuinely strong number that could give the RBA pause about cutting too aggressively.
Key Upcoming Data Points
- June Labour Force Survey: Released July 23, 2026. Watch for full-time employment recovery as a quality indicator.
- Wage Price Index (WPI): The next WPI release will test the hypothesis that wage pressure is easing.
- RBA Policy Meeting: The next meeting’s statement will reveal how the RBA is interpreting the labour market evolution.
Disclaimer: This article is for informational purposes only. All investment decisions are made solely at your own risk.