This article was automatically generated by the NFC Market Live AI analysis system. (Updated: 2026-11-18 19:43 JST)
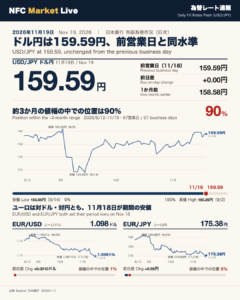
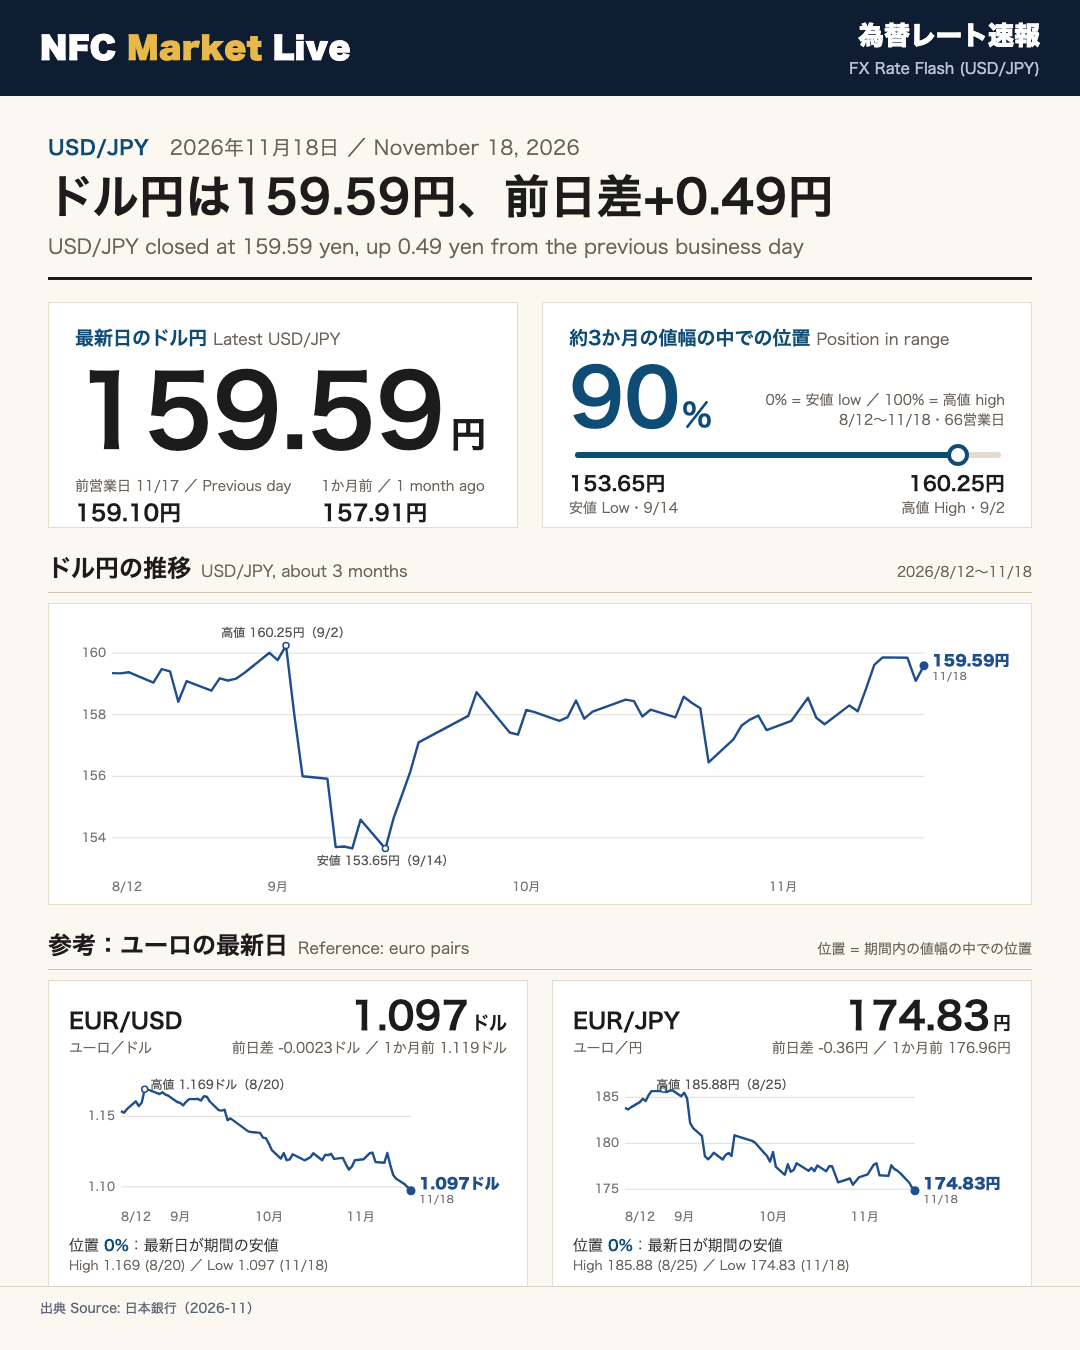
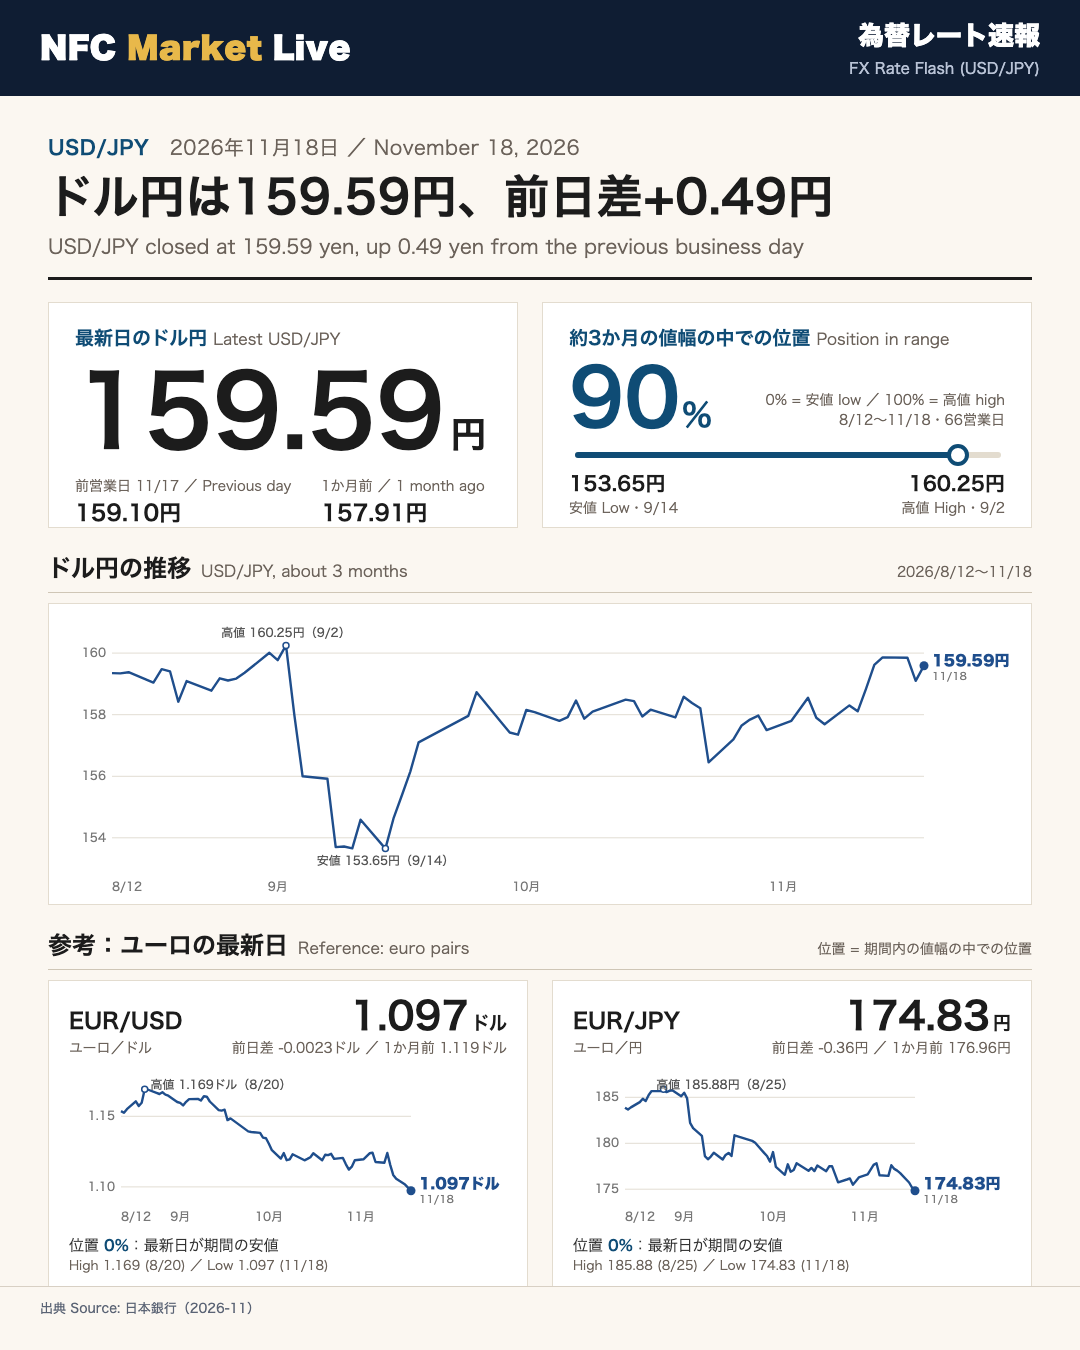
According to the Bank of Japan’s daily foreign exchange market data, USD/JPY stood at 159.59 yen on November 18, 2026. The previous business day (November 17) was 159.10 yen, a daily change of +0.49 yen. One month earlier, the rate was 157.91 yen.
Within the roughly three-month window covered by the data (August 12 to November 18, 2026; 66 business days), the high was 160.25 yen (September 2) and the low was 153.65 yen (September 14). The latest level sits at the 90% position of that range (0% = low, 100% = high).
For reference, EUR/USD was 1.097 dollars (daily change -0.0023; one month earlier 1.119) and EUR/JPY was 174.83 yen (daily change -0.36; one month earlier 176.96). Both are at the lowest level of the window, i.e. the 0% position. The window highs were 1.169 dollars for EUR/USD (August 20) and 185.88 yen for EUR/JPY (August 25).
最新日のドル円:159.59円、前日差+0.49円
USD/JPY on November 18
According to the Bank of Japan’s daily foreign exchange market data, USD/JPY stood at 159.59 yen on November 18, 2026. The previous business day (November 17) was 159.10 yen, a daily change of +0.49 yen. One month earlier, the rate was 157.91 yen.
The last five business days
| Date | USD/JPY |
|---|---|
| Nov 12 | 159.62 |
| Nov 13 | 159.86 |
| Nov 16 | 159.85 |
| Nov 17 | 159.10 |
| Nov 18 | 159.59 |
The source is the Bank of Japan’s daily FX market series, which covers 66 business days from August 12 to November 18, 2026, roughly three months. USD/JPY has stayed in the 159 yen range over the last five business days shown in the table.
約3か月の値幅の中での位置:90%
Where the latest level sits in the roughly three-month range
Within the window covered by the data (August 12 to November 18, 2026; 66 business days), USD/JPY’s high was 160.25 yen (September 2) and its low was 153.65 yen (September 14).
The latest reading of 159.59 yen sits at the 90% position of this range (0% = low, 100% = high).
Daily values from the high to the low
| Date | USD/JPY |
|---|---|
| Sep 2 | 160.25 (window high) |
| Sep 3 | 158.00 |
| Sep 4 | 156.00 |
| Sep 8 | 153.70 |
| Sep 14 | 153.65 (window low) |
| Nov 18 | 159.59 (latest) |
As the table shows, both the window high and the window low were recorded in September. The latest 159.59 yen is higher than the 157.91 yen recorded one month earlier.
参考:ユーロ(EUR/USD・EUR/JPY)の最新日
Euro pairs on the latest day
| Pair | Nov 18 | Previous day | Daily change | One month earlier |
|---|---|---|---|---|
| EUR/USD | 1.097 | 1.099 | -0.0023 | 1.119 |
| EUR/JPY | 174.83 | 175.19 | -0.36 | 176.96 |
Window high and low (August 12 to November 18)
- EUR/USD: high 1.169 dollars (August 20), low 1.097 dollars (November 18). Position: 0%
- EUR/JPY: high 185.88 yen (August 25), low 174.83 yen (November 18). Position: 0%
For both pairs, the latest level is the same as the lowest level in the window. This contrasts with USD/JPY, which sits at the 90% position of its range.
Disclaimer: This article is for informational purposes only. All investment decisions are made solely at your own risk.