This article was automatically generated by the NFC Market Live AI analysis system. (Updated: 2026-11-16 19:45 JST)
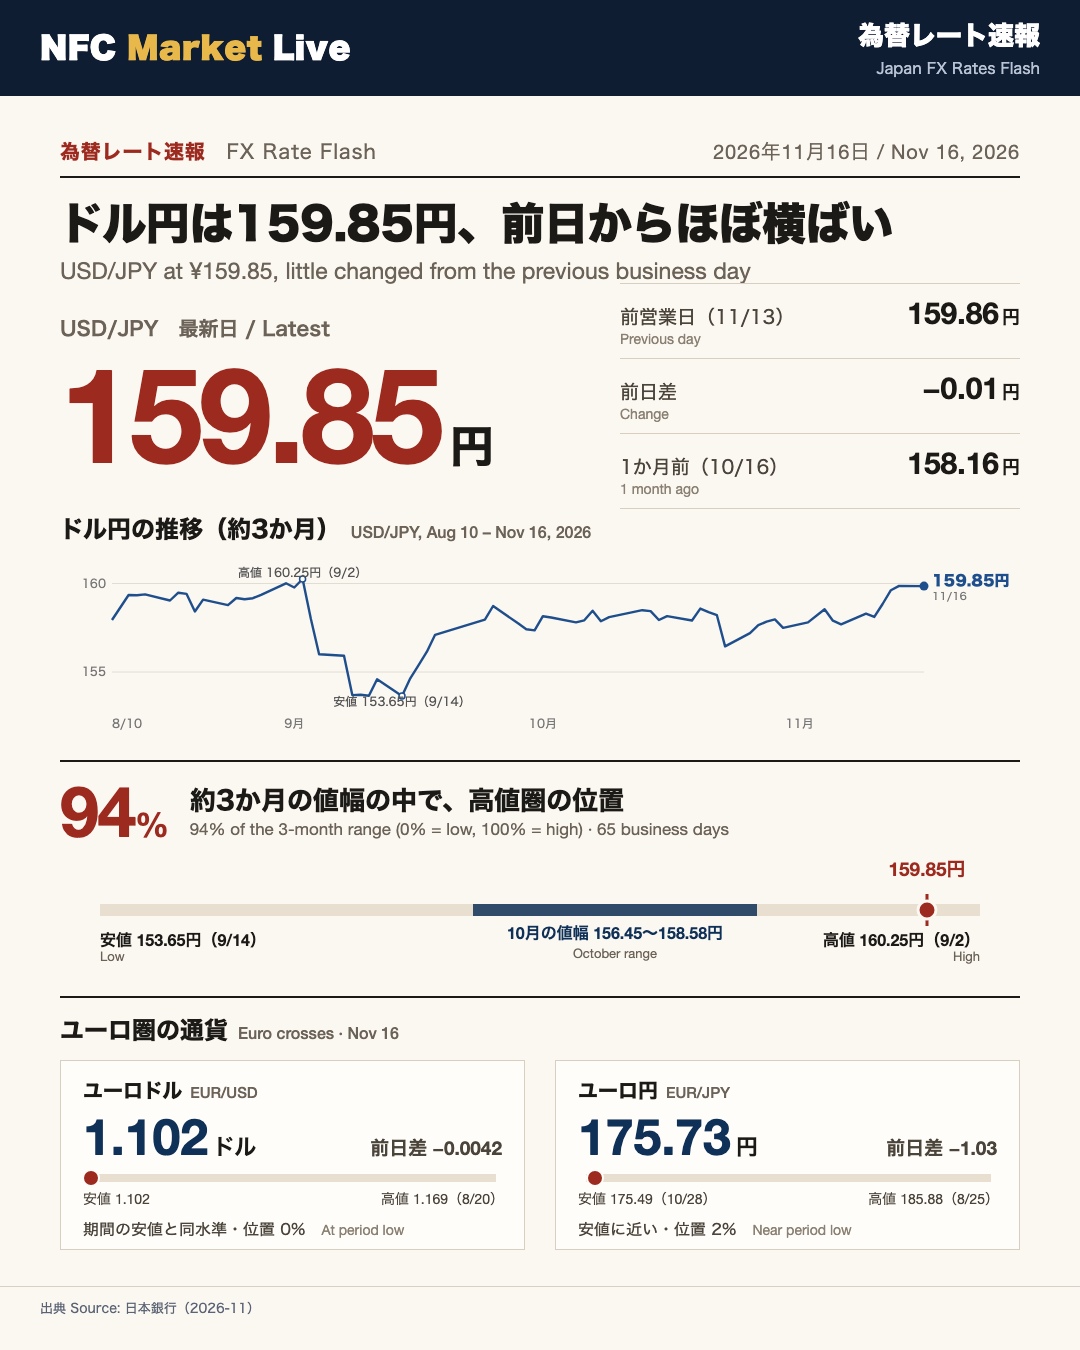
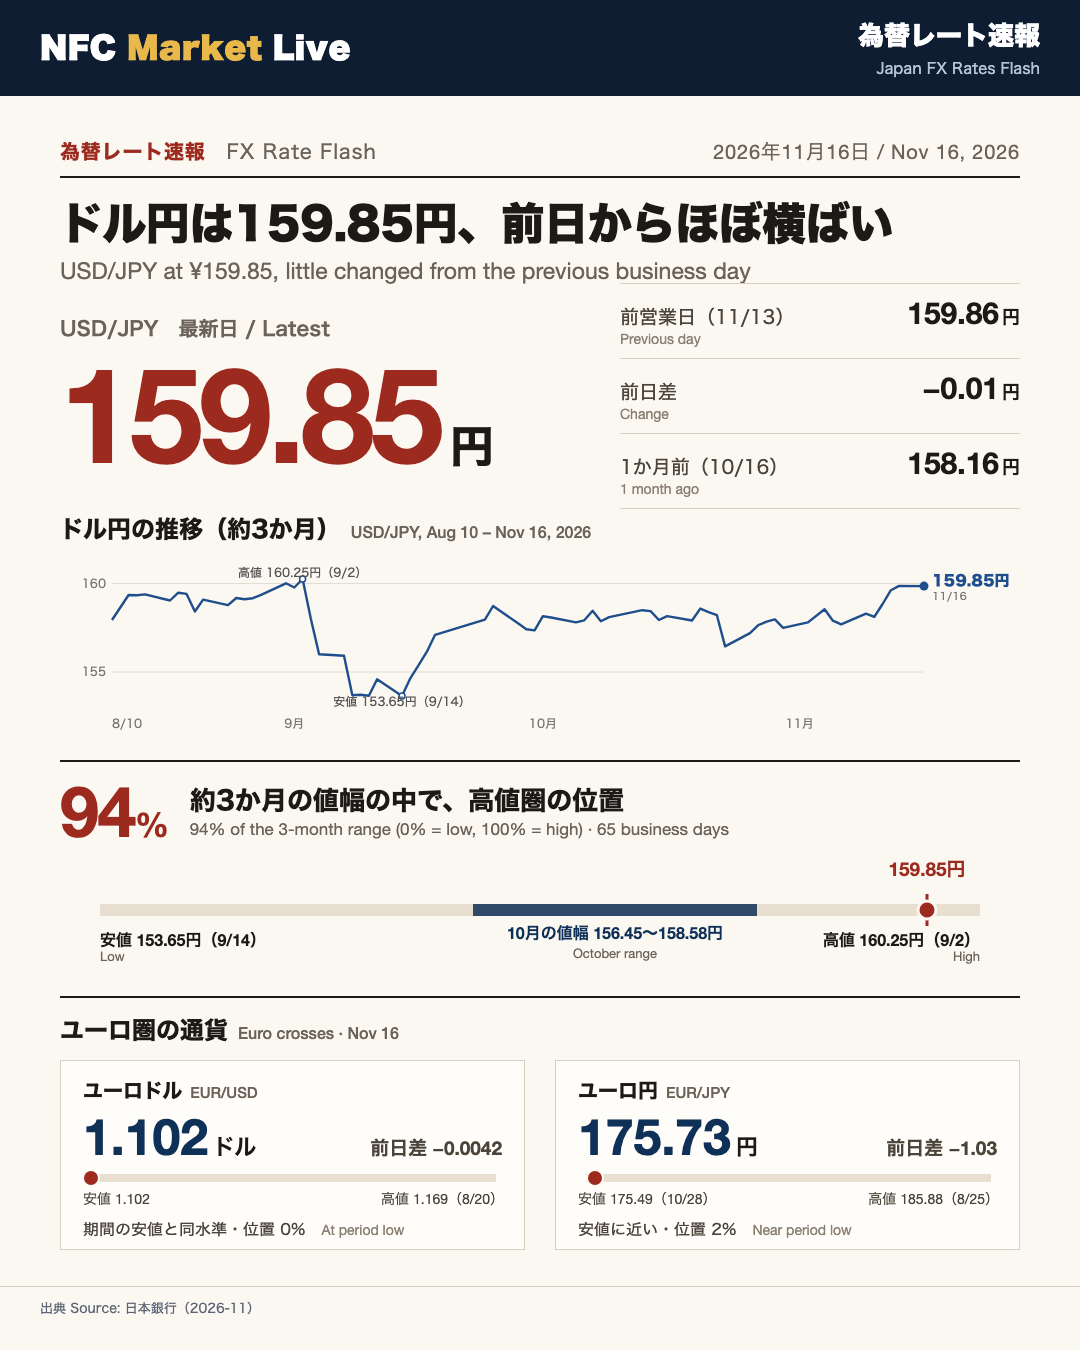
📊 FX Rates Flash (Nov 16, 2026, based on the Bank of Japan’s daily foreign exchange market data)
💴 USD/JPY closed at 159.85, down 0.01 yen from 159.86 on the previous business day (Nov 13). One month earlier (Oct 16) it stood at 158.16.
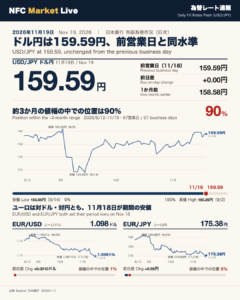
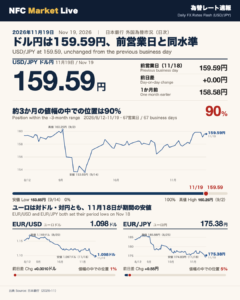
📈 Over the period covered by the data (Aug 10 to Nov 16, 65 business days), the high was 160.25 (Sep 2) and the low was 153.65 (Sep 14). The latest level sits at 94% of the range (0% = low, 100% = high), close to the top.
💶 EUR/USD was 1.102, down 0.0042 from 1.106 the day before. This matches the low of the period (1.102). The high was 1.169 (Aug 20).
💶 EUR/JPY was 175.73, down 1.03 from 176.76. The period high was 185.88 (Aug 25) and the low was 175.49 (Oct 28); the latest value sits at 2% of the range.
🔎 USD/JPY has stayed in the 159s since Nov 12.
Only figures contained in the source data are shown.
ドル円は159.85円、前日からほぼ横ばい
Latest level
According to the Bank of Japan’s daily foreign exchange market data (the BOJ is Japan’s central bank), USD/JPY stood at 159.85 on November 16, 2026. That is 0.01 yen lower than 159.86 on the previous business day (November 13), so the rate was essentially flat. One month earlier (October 16) it was 158.16.
Recent daily values
| Date | USD/JPY |
|---|---|
| Nov 9 | 158.30 |
| Nov 10 | 158.11 |
| Nov 11 | 158.84 |
| Nov 12 | 159.62 |
| Nov 13 | 159.86 |
| Nov 16 | 159.85 |
USD/JPY has stayed in the 159s for three straight business days since November 12. Among the November values in the data, the 159.86 recorded on November 13 is the highest.
Compared with October
Daily values in October ranged from 156.45 (October 23) to 158.58 (October 20). The latest 159.85 is above that range.
About the data
USD/JPY is quoted as the number of yen per US dollar, so a higher figure means a weaker yen against the dollar. The source gives daily values only and does not state reasons for the moves, so this report is limited to the numbers published. The next update will follow the Bank of Japan’s next daily release.
約3か月の値幅の中で、ドル円は94%の位置
High and low of the period
In the data covering August 10 to November 16, 2026 (65 business days), USD/JPY reached a high of 160.25 on September 2 and a low of 153.65 on September 14. The latest 159.85 sits at 94% of that range (0% = low, 100% = high), which puts it near the top of the roughly three-month window.
From the high to the low
The daily values show 160.25 on September 2, then 158.00 on September 3, 156.00 on September 4 and 153.70 on September 8, before the period low of 153.65 on September 14. The pair then recovered to 154.65 on September 15, 157.10 on September 18 and 158.73 on September 25.
October into November
October trading ran from the 156s to the 158s, with 156.45 recorded on October 23. In November the rate was 159.62 on the 12th, 159.86 on the 13th and 159.85 on the 16th, all in the 159s.
How to read the figure
The 94% reading is a relative position within this three-month window only, not a comparison with a longer history. The source provides daily values without explanations of the moves, so this article does not discuss causes.
ユーロ圏の通貨:ユーロドルは期間安値、ユーロ円も安値圏
EUR/USD
On November 16, 2026, EUR/USD was 1.102, down 0.0042 from 1.106 on the previous business day (November 13). One month earlier (October 16) it was 1.124. Over the period covered (August 10 to November 16, 65 business days), the high was 1.169 (August 20) and the low was 1.102 (November 16). The latest value equals the period low, i.e. 0% of the range.
EUR/JPY
EUR/JPY was 175.73, down 1.03 yen from 176.76 the previous business day. One month earlier it was 177.57. The period high was 185.88 (August 25) and the low was 175.49 (October 28). The latest value sits at 2% of the range, close to the bottom.
Recent daily values
EUR/JPY: 177.21 (Nov 11), 177.03 (Nov 12), 176.76 (Nov 13), 175.73 (Nov 16). EUR/USD: 1.115 (Nov 11), 1.108 (Nov 12), 1.106 (Nov 13), 1.102 (Nov 16). Both series show lower figures day by day over this stretch.
Reading the numbers
EUR/USD is quoted as US dollars per euro, and EUR/JPY as yen per euro. According to the data, USD/JPY is near the top of its three-month range while EUR/JPY is near the bottom. The source gives daily values only and no explanation of the moves, so no causes are discussed here.
Disclaimer: This article is for informational purposes only. All investment decisions are made solely at your own risk.