This article was automatically generated by the NFC Market Live AI analysis system. (Updated: 2026-11-16 13:45 JST)
📄 Primary Source
NFC Market Live
https://www.meti.go.jp/statistics/tyo/iip/result/pdf/press/b2020_202609kj.pdf, https://www.meti.go.jp/statistics/tyo/iip/result/pdf/press/b2020_202609nj.pdf
📊 A breakdown of Japan’s September 2026 Index of Industrial Production (revised), published by METI.
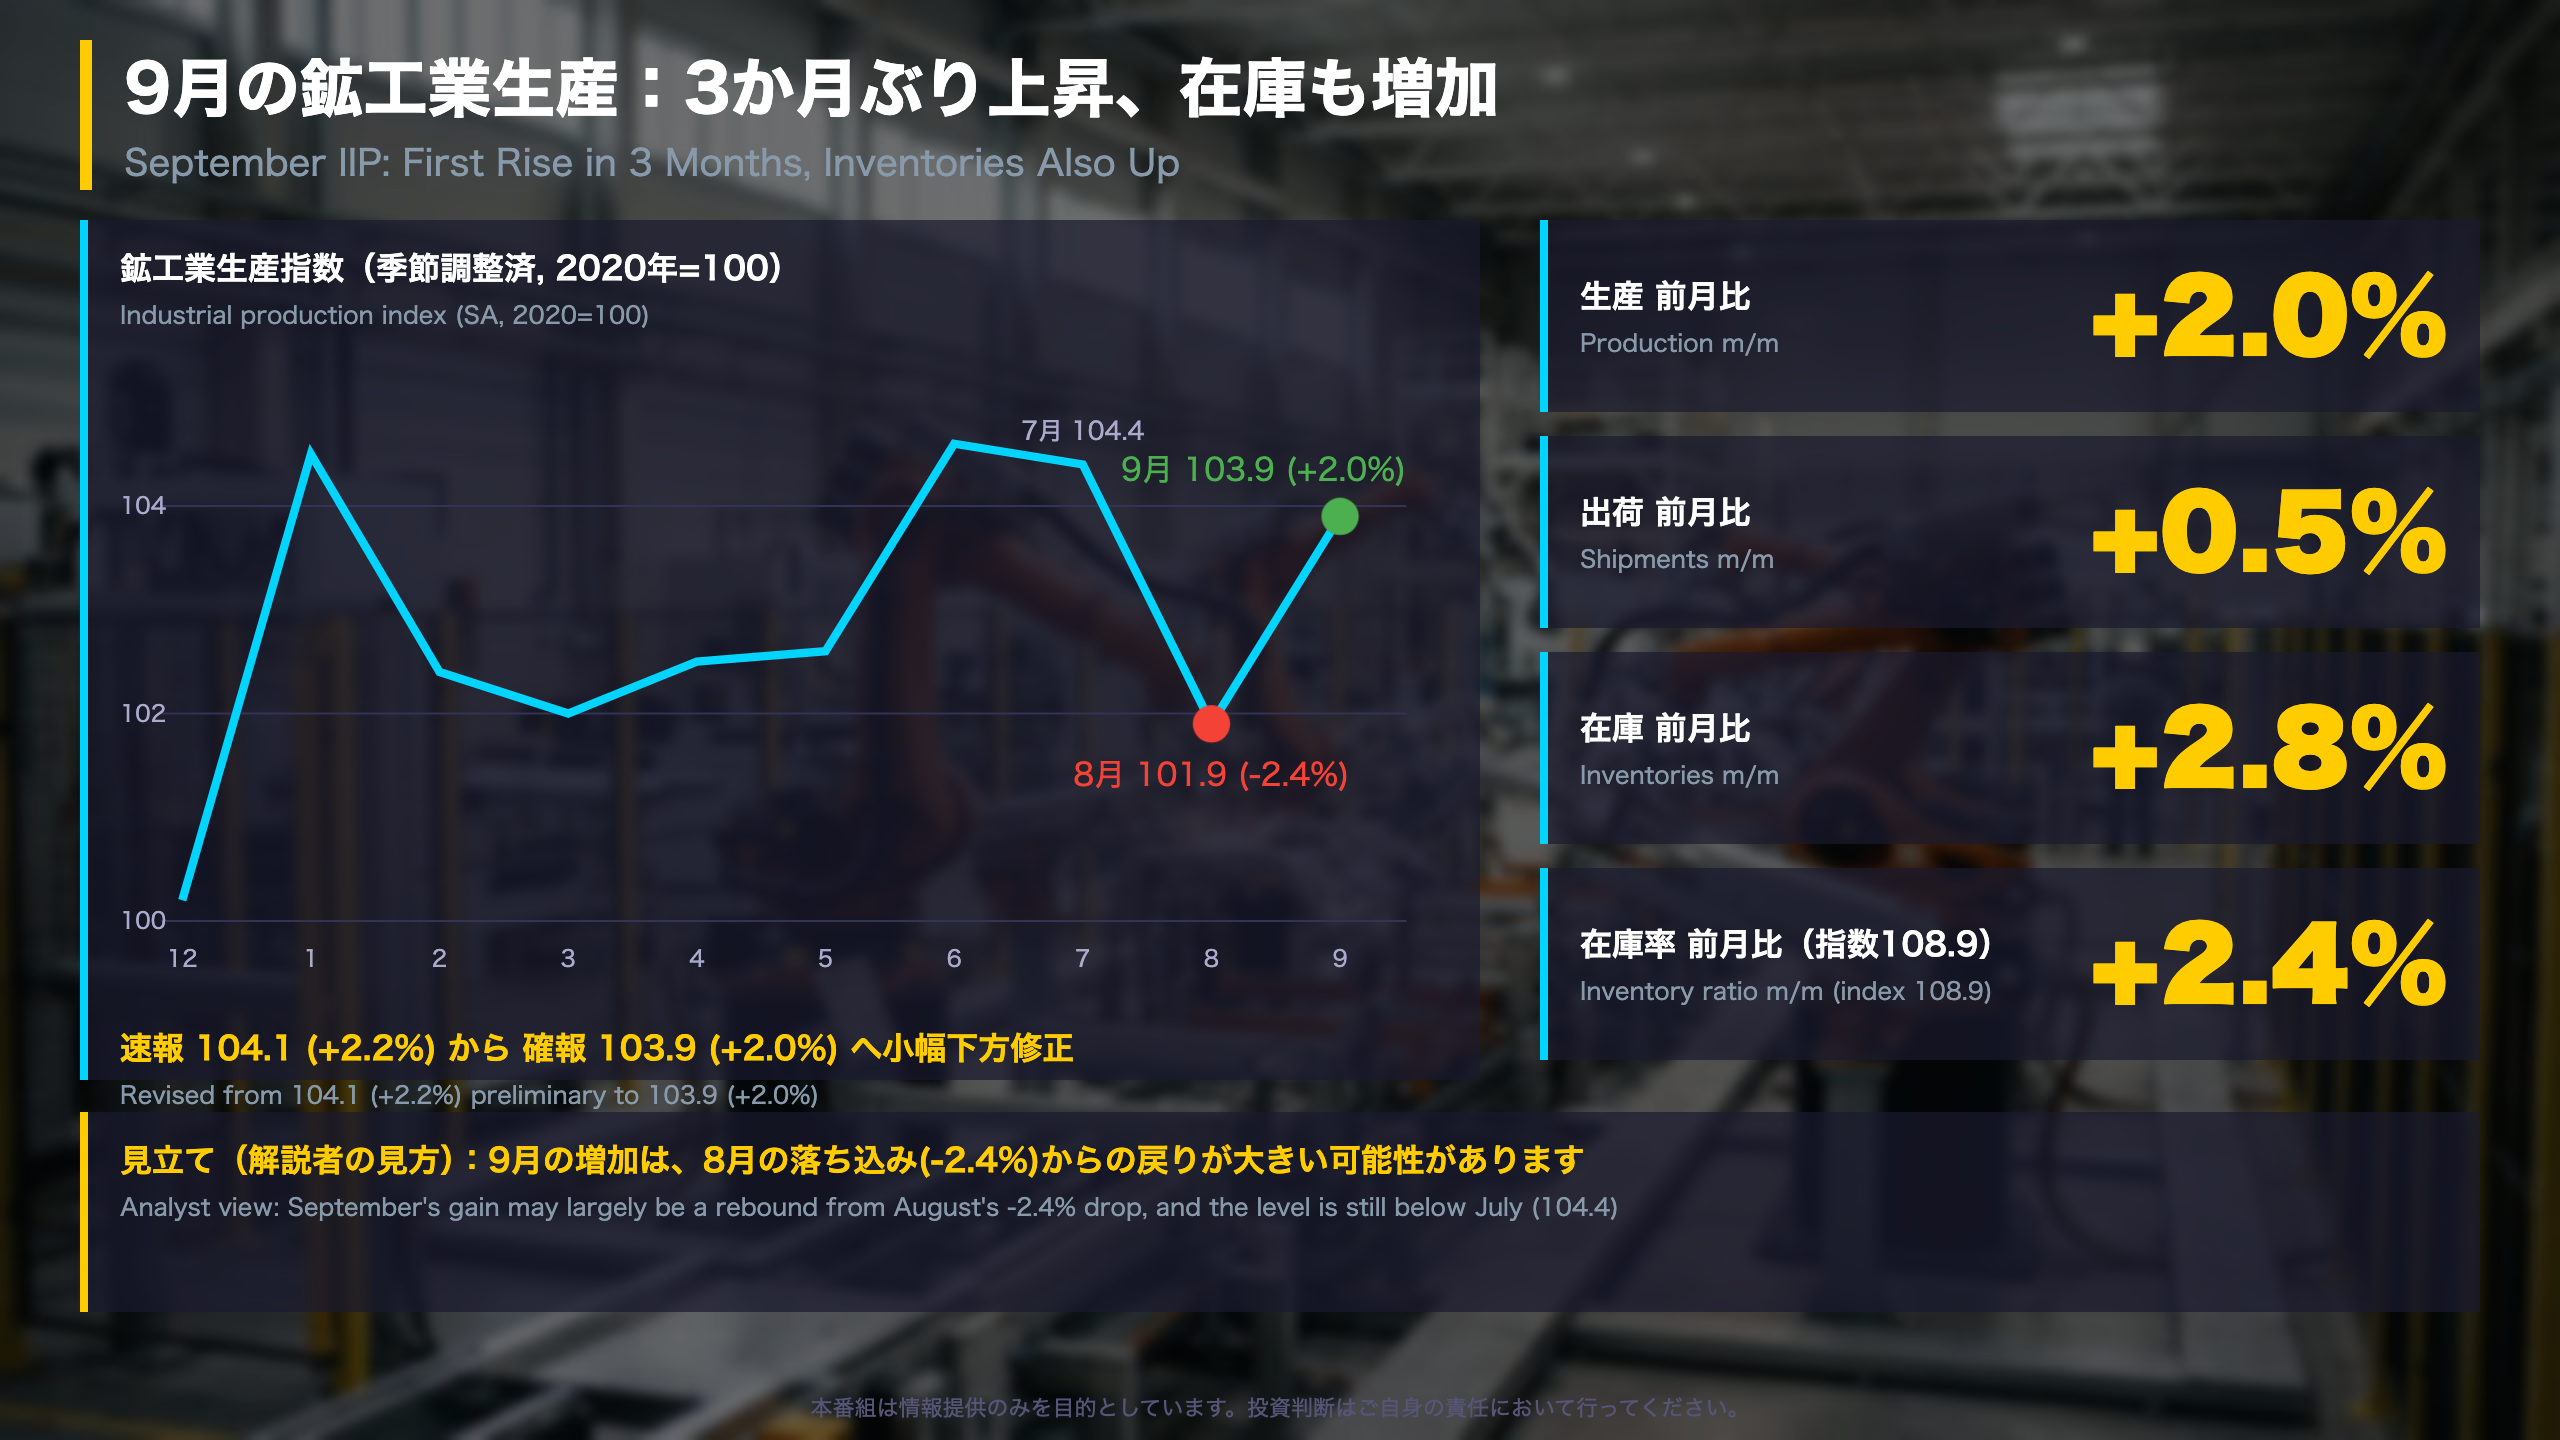
Output rose 2.0% m/m, the first gain in three months. Shipments +0.5%, inventories +2.8%, and the inventory ratio reached 108.9.
📈 Autos and production machinery led the rise, but much of it recovers August’s drop and the level is still below July.
⚠️ Inventories rose in iron and steel, autos and others. Patterns differ by industry, so one month cannot settle the cycle.
💡 METI’s forecast survey shows +5.1% for October and +0.8% for November. The October preliminary release is the next check.
9月の鉱工業生産:3か月ぶり上昇、在庫も増加
What the revised September print says
Japan’s Index of Industrial Production (IIP) is compiled monthly by METI from surveys of manufacturers, with 2020 set to 100. The revised (kakuho) report refines the earlier preliminary (sokuho) estimate with fuller survey returns. September output came in at 103.9, up 2.0% month on month, versus 104.1 (+2.2%) in the preliminary report. Shipments were revised to +0.5% and inventories to +2.8%.
Why the headline needs context
Output fell 2.4% in August, so September restores part of the lost ground, but the index still sits below its July reading of 104.4. METI’s summary of the preliminary report described production as moving sideways (isshin-ittai), a phrase the ministry has used for long stretches of the past few years.
How it compares abroad
The nearest US counterpart is the Federal Reserve’s industrial production release, which covers manufacturing, mining and utilities. Japan’s IIP bundles production, shipments, inventories and an inventory ratio in a single release, which makes it useful for judging whether stock is building faster than sales.
What to watch
METI’s forecast survey of manufacturers points to +5.1% in October and +0.8% in November. September’s actual (+2.2% preliminary) came in below the survey’s +3.2%, so the October actual is the test. This is a data summary, not a forecast of markets.
生産を動かした主役:自動車の戻りと機械類
Who moved the index
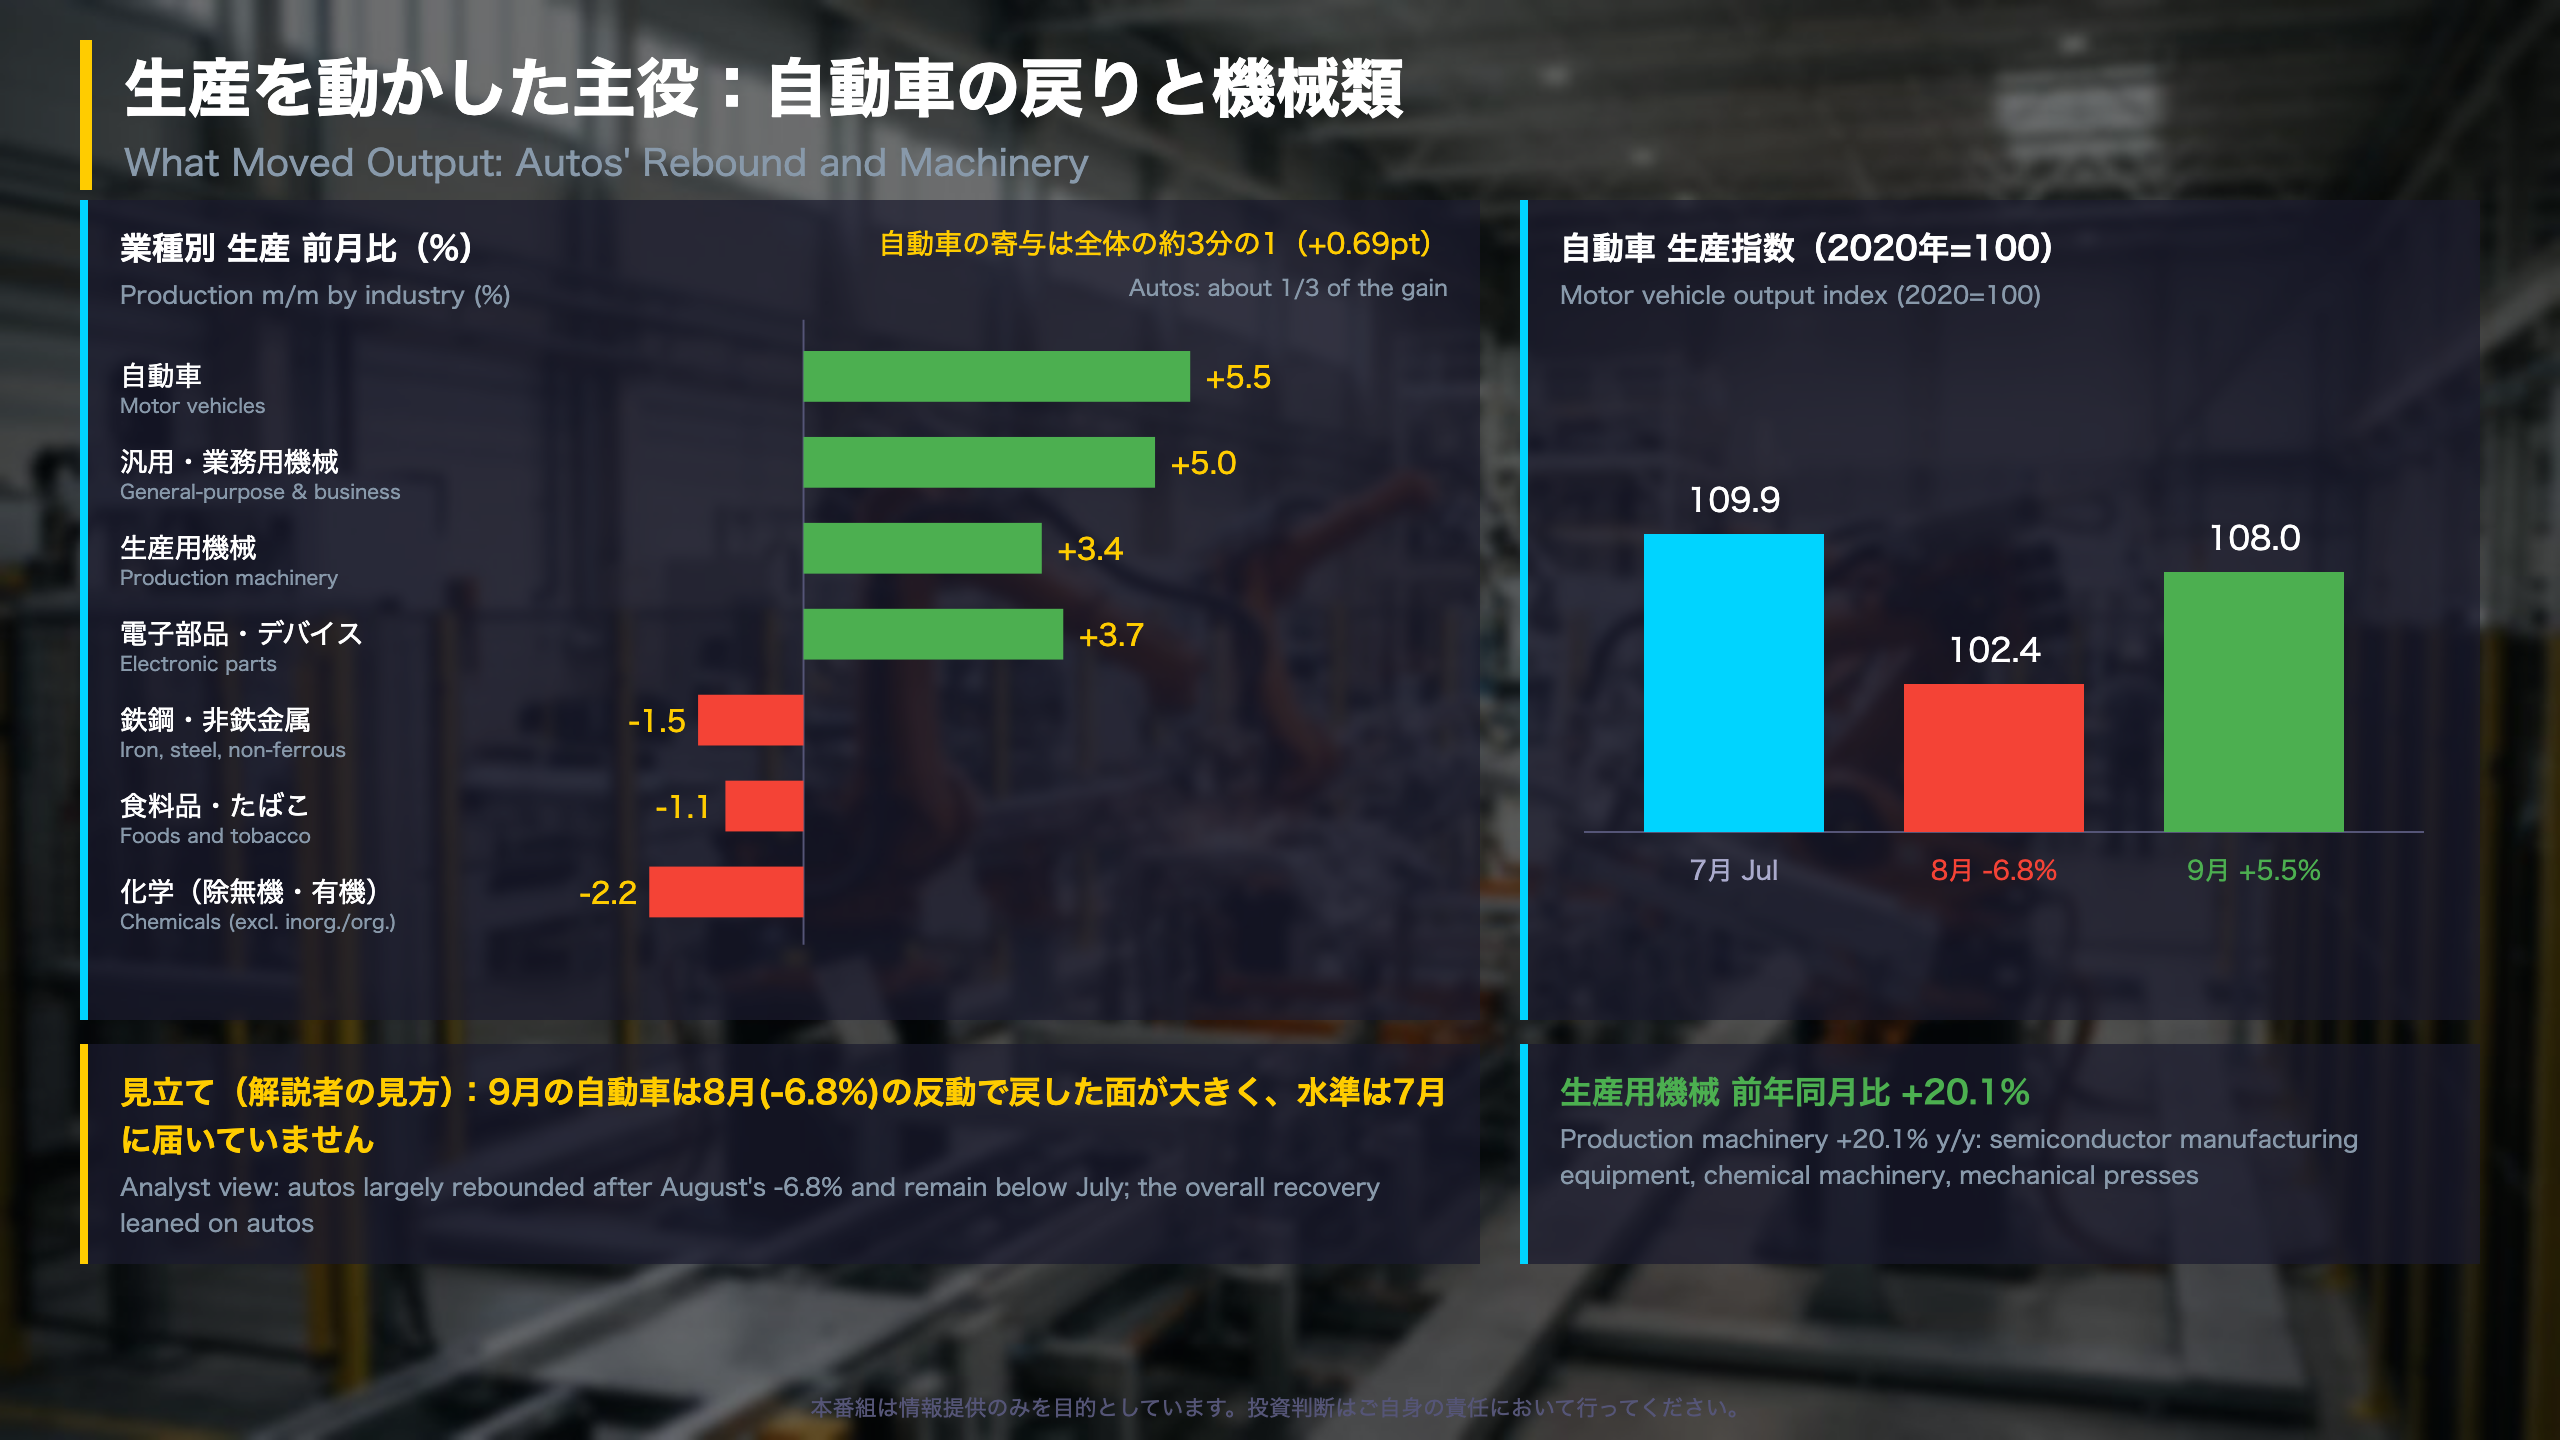
METI publishes each industry’s contribution, in percentage points, to the headline change. In September, motor vehicles contributed +0.69pt, general-purpose and business machinery +0.37pt, production machinery +0.36pt and electronic parts and devices +0.22pt. The drags were chemicals excluding inorganic and organic (-0.17pt, with pharmaceuticals, synthetic detergents and fabric softeners cited), foods and tobacco (-0.15pt) and iron, steel and non-ferrous metals (-0.09pt).
Autos: rebound, not breakout
Motor vehicle output went 109.9 in July, 102.4 in August and 108.0 in September. The September rise is real but leaves output below July, consistent with a bounce after August’s -6.8%.
Machinery: the sturdier leg
Production machinery is up 20.1% year on year, with semiconductor manufacturing equipment, chemical machinery and mechanical presses named by METI. This line is often read as a gauge of capital-spending demand, though one month does not establish a trend.
Two readings
- Constructive: machinery strength is broad, with general-purpose and business machinery up 5.0% m/m.
- Cautious: the pharmaceutical-driven revision shows how single items can swing the headline.
Note for non-Japanese readers: METI’s IIP uses seasonally adjusted indices for month-on-month changes and original, unadjusted indices for year-on-year comparisons.
在庫の中身:どこで積み上がり、どこが前向きか
Inventory cycle diagnosis
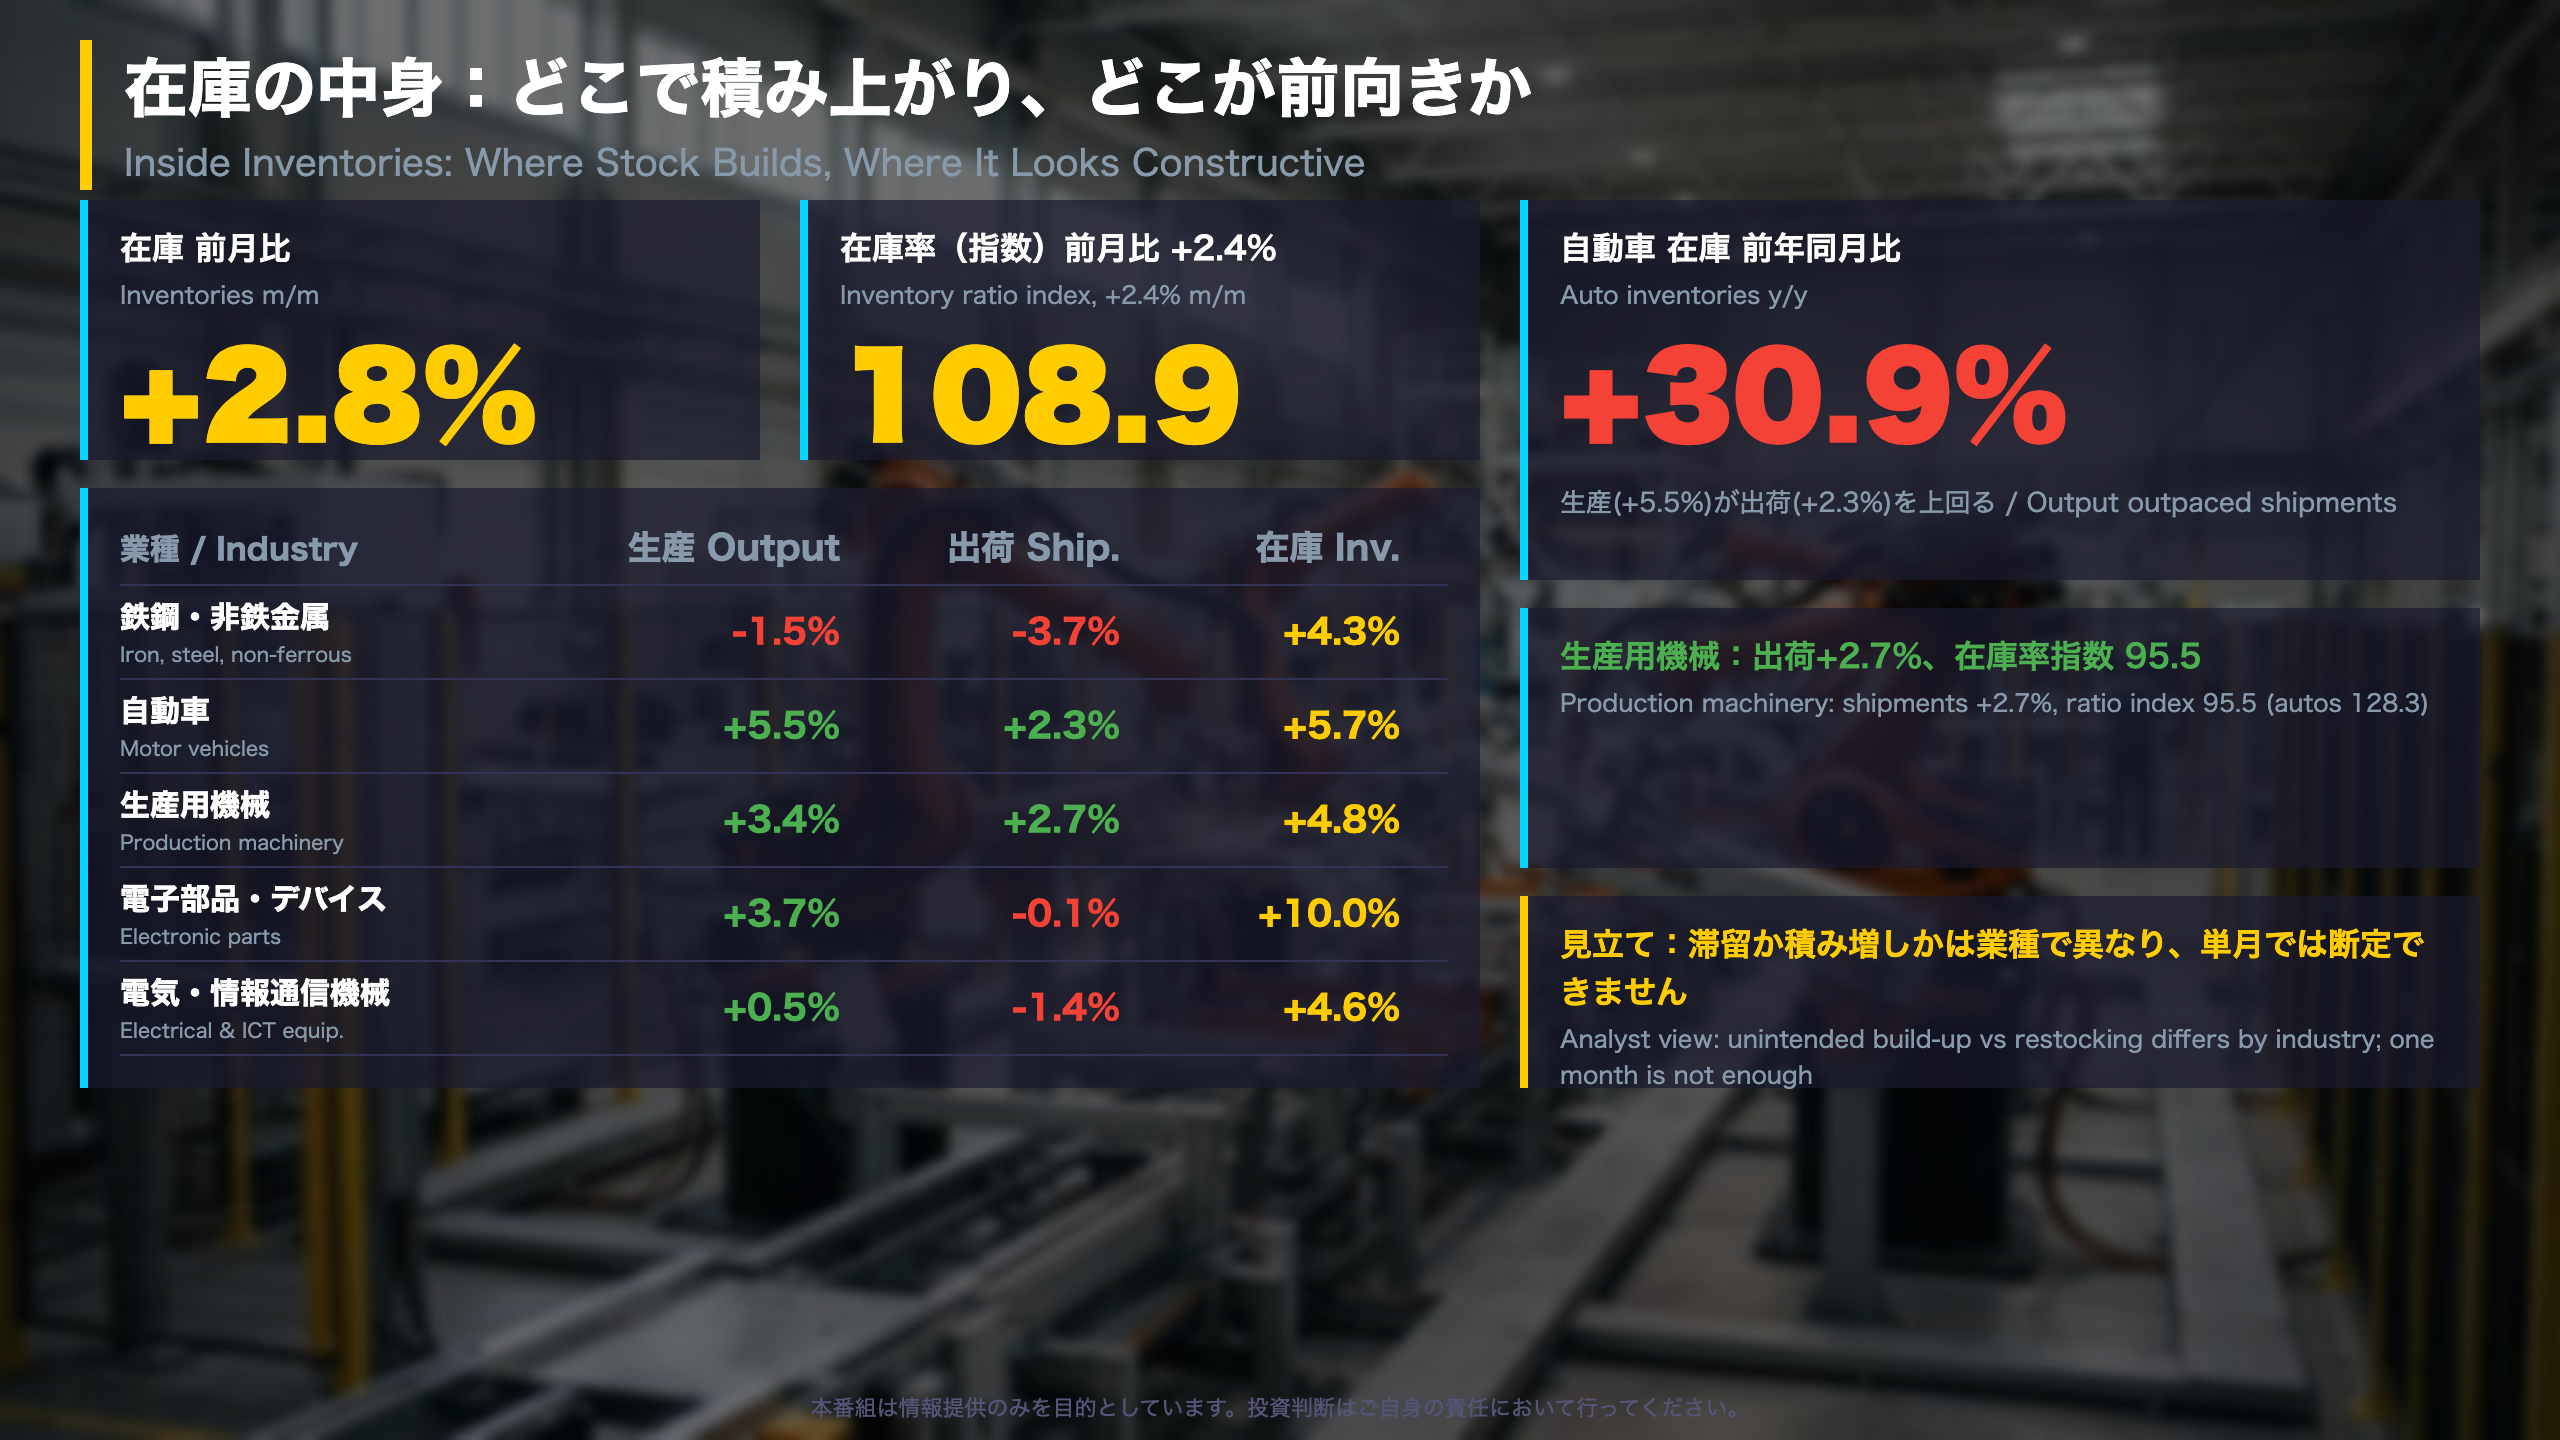
The inventory ratio, which compares stocks with shipments, is the IIP’s gauge of whether stock is building faster than sales. September: 108.9 (+2.4% m/m, +3.4% y/y, the first y/y rise in 13 months).
| Industry | Output | Shipments | Inventories | Ratio |
|---|---|---|---|---|
| Motor vehicles | +5.5% | +2.3% | +5.7% | +4.1% |
| Production machinery | +3.4% | +2.7% | +4.8% | +7.1% |
| Electronic parts | +3.7% | -0.1% | +10.0% | +15.4% |
| Electrical and ICT equipment | +0.5% | -1.4% | +4.6% | -1.2% |
| Iron, steel, non-ferrous | -1.5% | -3.7% | +4.3% | +7.1% |
Reading the table
Autos: stocks are up 30.9% y/y, the clearest accumulation signal. Electronic parts: output rose on memory chips but shipments were flat, so stocks jumped 10.0%; however stocks remain 6.2% lower than a year ago, so the jump starts from a lower base. Electrical and ICT equipment stocks are also 11.5% lower y/y.
Two readings
Unintended build-up is plausible in autos, while restocking ahead of demand fits production machinery, where shipments rose and the ratio index (95.5) sits far below autos (128.3). METI’s preliminary Q3 data show output +2.8% y/y and inventories +0.1% y/y, so the quarter as a whole does not show a large stock overhang. One month cannot settle it.
質疑で深める:強さの見極めと次の確認点
Forward look: what the plan survey says
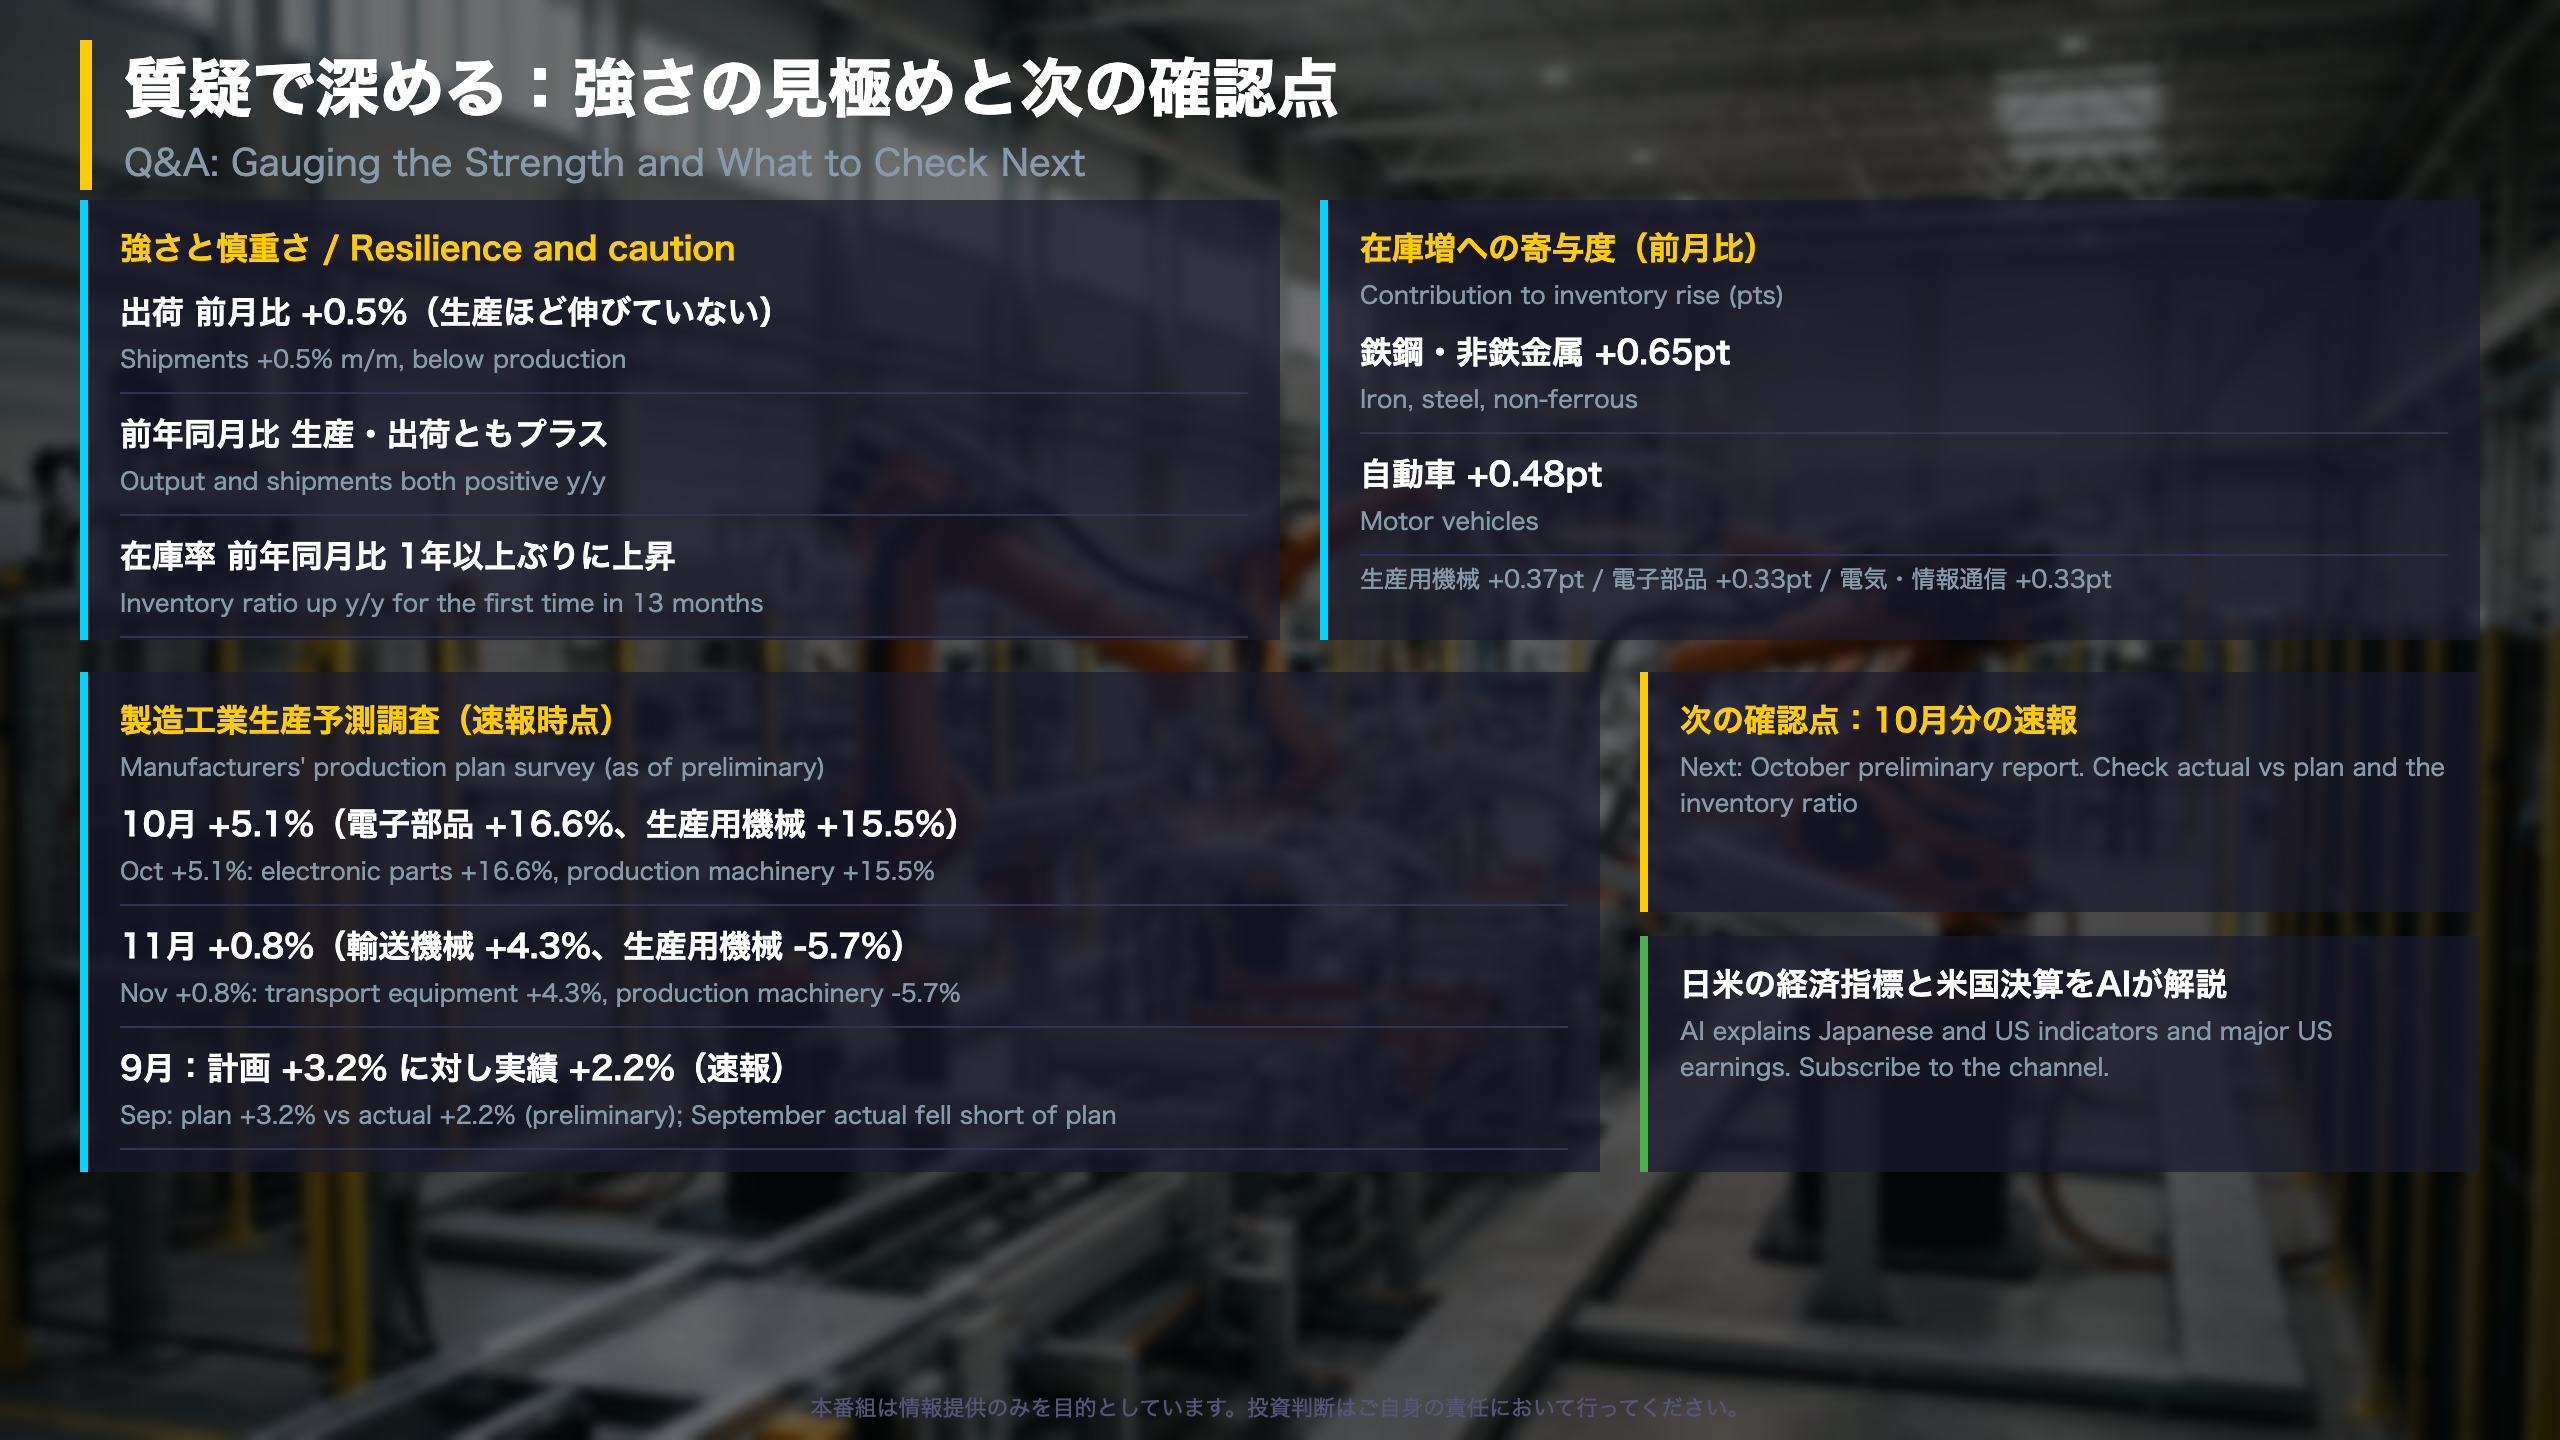
METI’s Survey of Production Forecast asks major manufacturers for output plans. As of the preliminary release: October +5.1% m/m (bias-adjusted estimate +3.9%) and November +0.8%. October contributions: electronic parts and devices +2.53pt and production machinery +2.21pt. November: transport equipment +0.80pt, offset by production machinery -0.90pt and chemicals -0.40pt.
How reliable are the plans?
For September, the survey implied +3.2% (bias-adjusted +1.6%), and the actual was +2.2% in the preliminary report. The amendment ratio for October is +4.9%, the first upward revision in two months.
Corporate sentiment gauge
The production-sentiment DI for the October survey was -5.5 (trend -3.0). METI notes that a trend below -5 makes a recession phase likely; the trend currently sits above that line.
Two readings
Constructive: the upward revision and a DI trend above the -5 line. Cautious: plans overshot the actual in September, and November already shows a drop planned in production machinery.
Next data point: the October preliminary IIP. Compare the actual with +5.1% and the +3.9% adjusted figure, and track whether the inventory ratio keeps rising.
Disclaimer: This article is for informational purposes only. All investment decisions are made solely at your own risk.