This article was automatically generated by the NFC Market Live AI analysis system. (Updated: 2026-11-16 09:07 JST)
📄 Primary Source
内閣府経済社会総合研究所
https://www.esri.cao.go.jp/jp/sna/data/data_list/sokuhou/gaiyou/pdf/main_1.pdf
📊 Japan’s July-September 2026 GDP, first preliminary estimate from the Cabinet Office (released Nov 16).
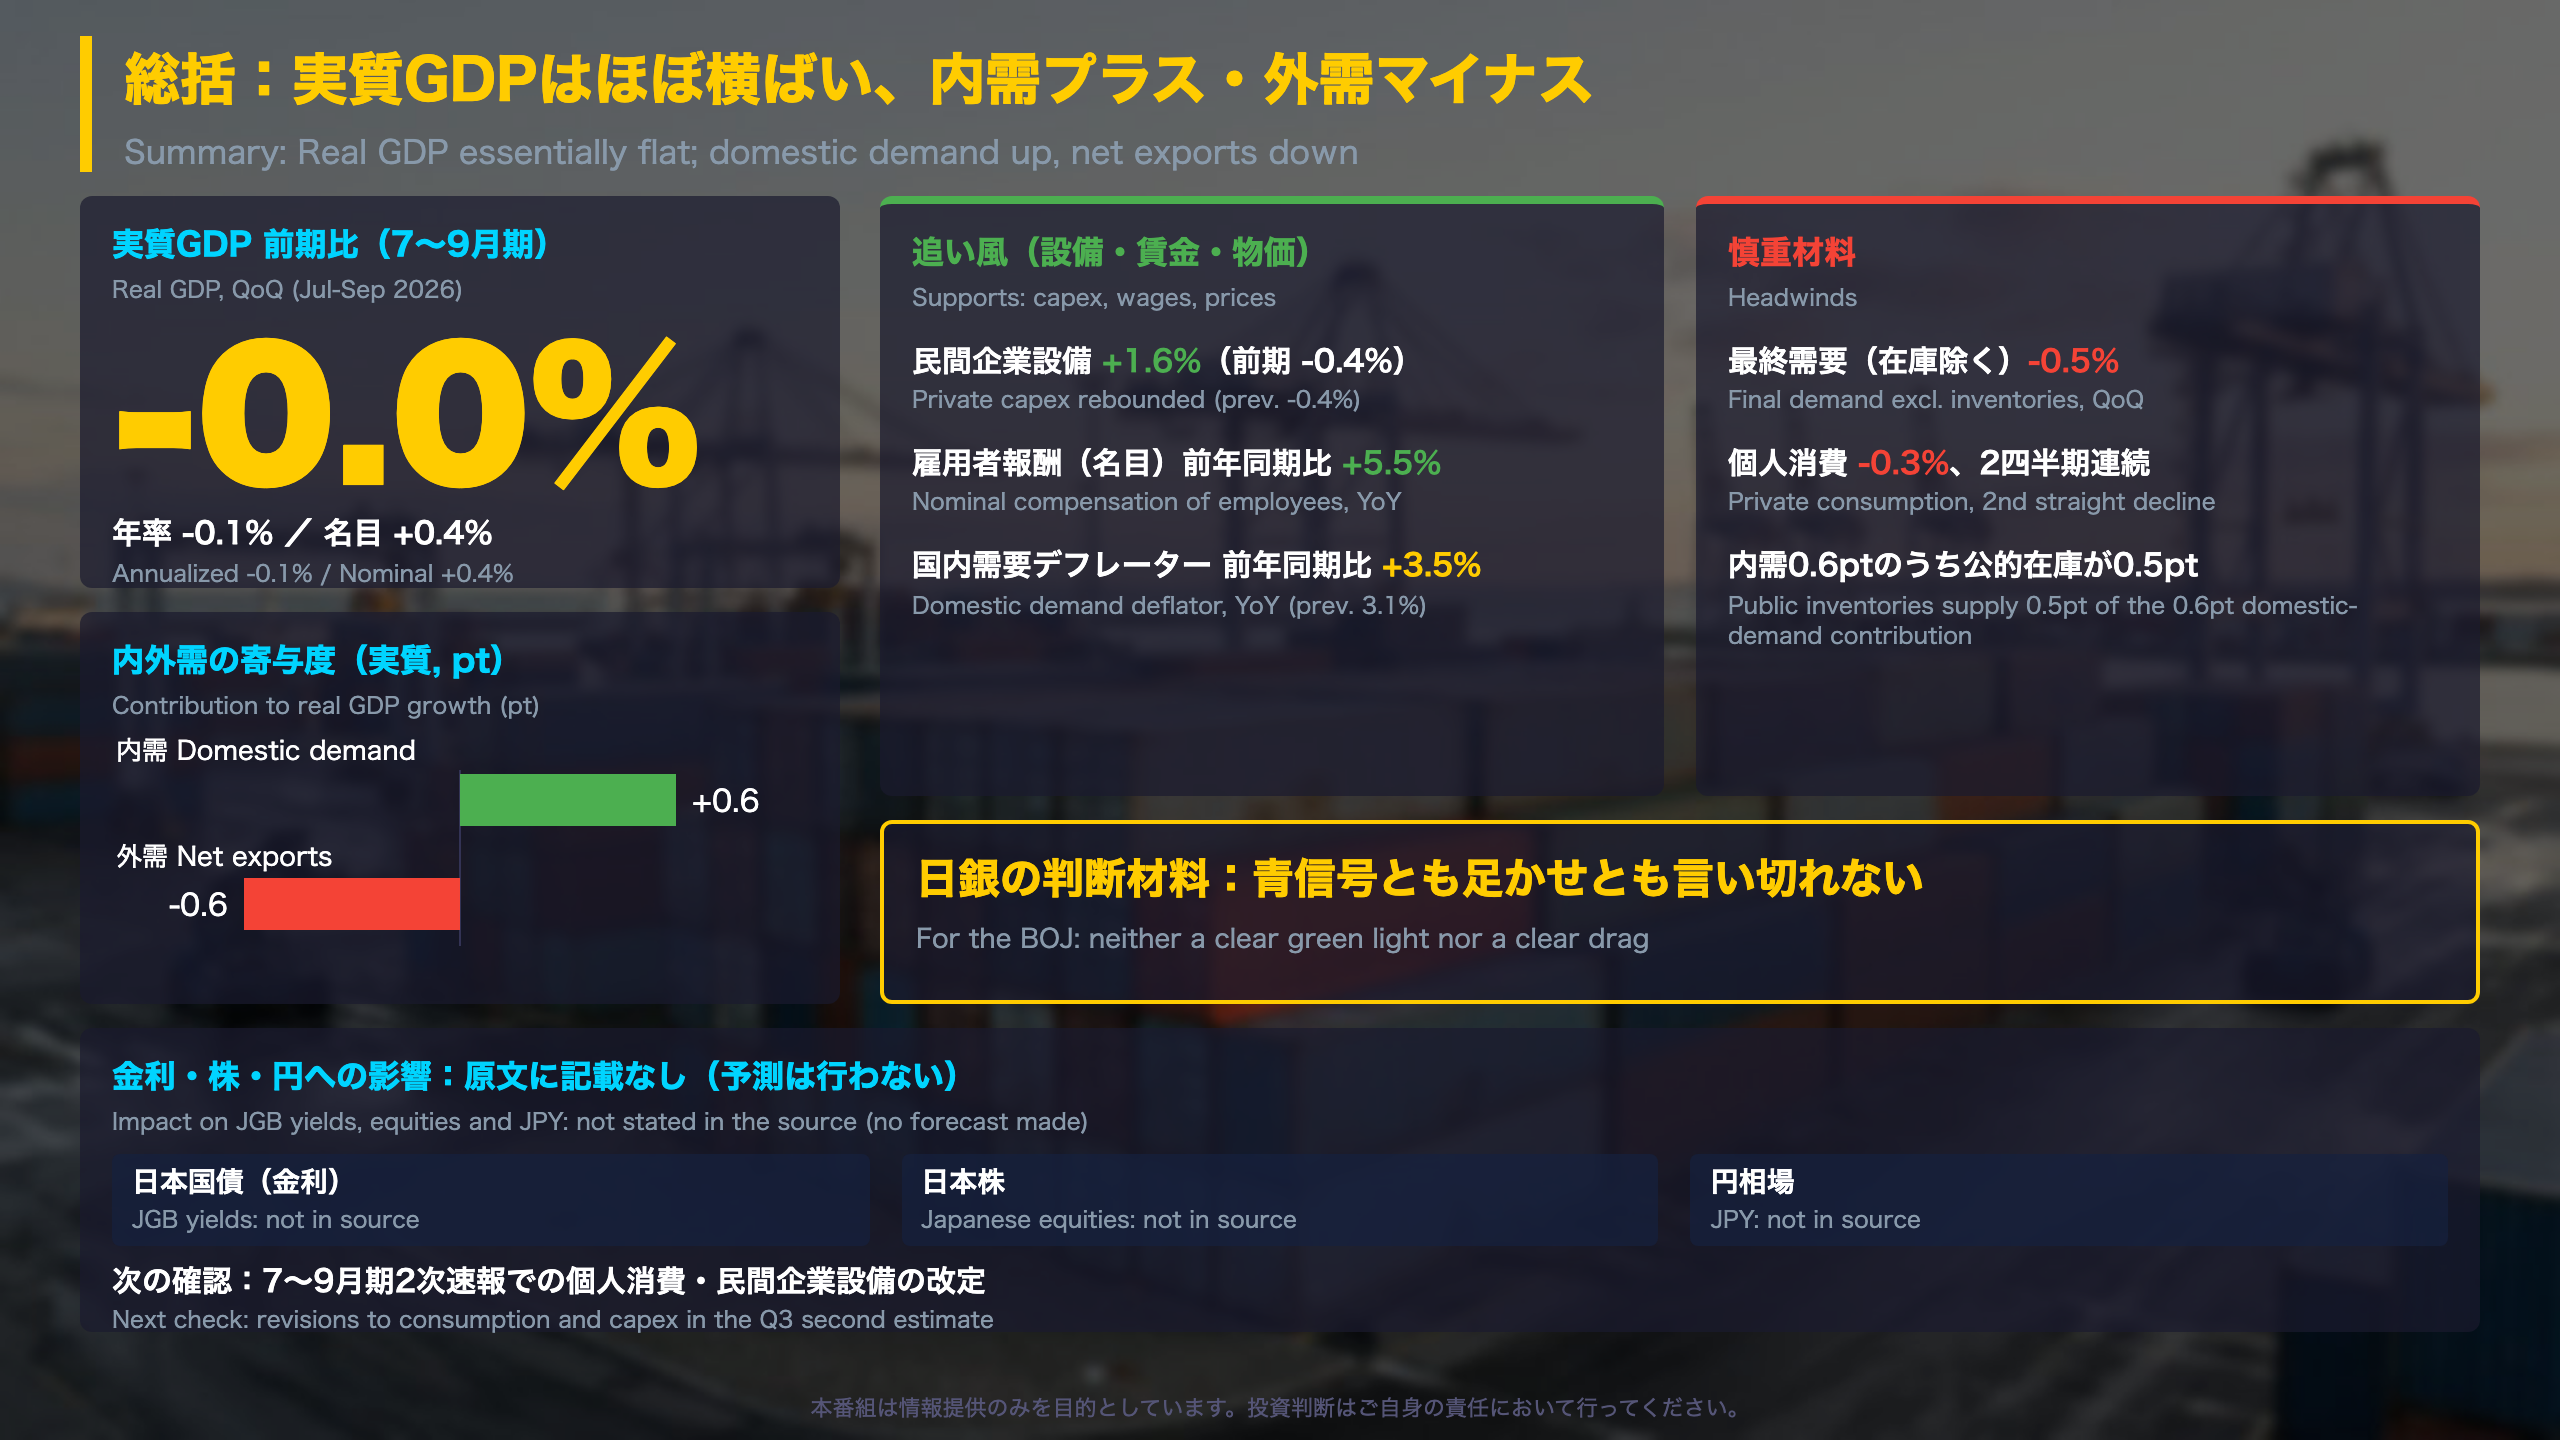
Real GDP was -0.0% QoQ (-0.1% annualized); nominal GDP +0.4%. Domestic demand added 0.6pt, net exports subtracted 0.6pt.
💡 Most of the domestic-demand lift came from public inventories. Final demand excluding inventories fell 0.5% and private consumption declined for a second straight quarter.
📈 On the other side, business capex rebounded 1.6% and nominal compensation of employees rose 5.5% YoY.
⚠️ Imports rose 2.5%, weighing on external demand. The source says nothing on BOJ policy or markets, so we make no forecast.
Next check: revisions to consumption and capex in the second preliminary estimate.
The Ultimate Summary:成長はほぼ横ばい、内需プラス・外需マイナス
Japan’s Q3 GDP: A Flat Print With a Mixed Inside
What was released. The Cabinet Office publishes Japan’s quarterly GDP in two stages: a first preliminary estimate and, roughly three weeks later, a second estimate that folds in more source data. This is the first estimate for July-September 2026.
Headline. Real GDP was -0.0% quarter on quarter (-0.1% annualized) after +0.4% in April-June. Nominal GDP rose 0.4%, and real GDP grew 1.1% year on year.
Reading the composition
- Domestic demand added 0.6 points, but public inventories alone supplied 0.5 points.
- Net exports subtracted 0.6 points as imports rose 2.5%.
- Final demand (GDP excluding inventories) fell 0.5%.
- Private consumption fell 0.3%, a second straight decline.
- Business investment rebounded 1.6%; nominal compensation of employees rose 5.5% year on year.
Context for non-Japan readers
Japan’s release leads with the quarter-on-quarter rate and shows the annualized rate in brackets. Revisions matter: April-June private consumption now shows -0.3% versus 0.0% in the earlier second estimate.
On markets
The source says nothing about the Bank of Japan, JGB yields, equities or the yen, and we do not forecast them. Our reading is only that the report carries evidence for both caution (final demand, consumption) and resilience (capex, wages), so it does not settle the policy debate by itself.
深掘り1:内需の押し上げの大半は公的在庫
What sits inside Japan’s domestic demand
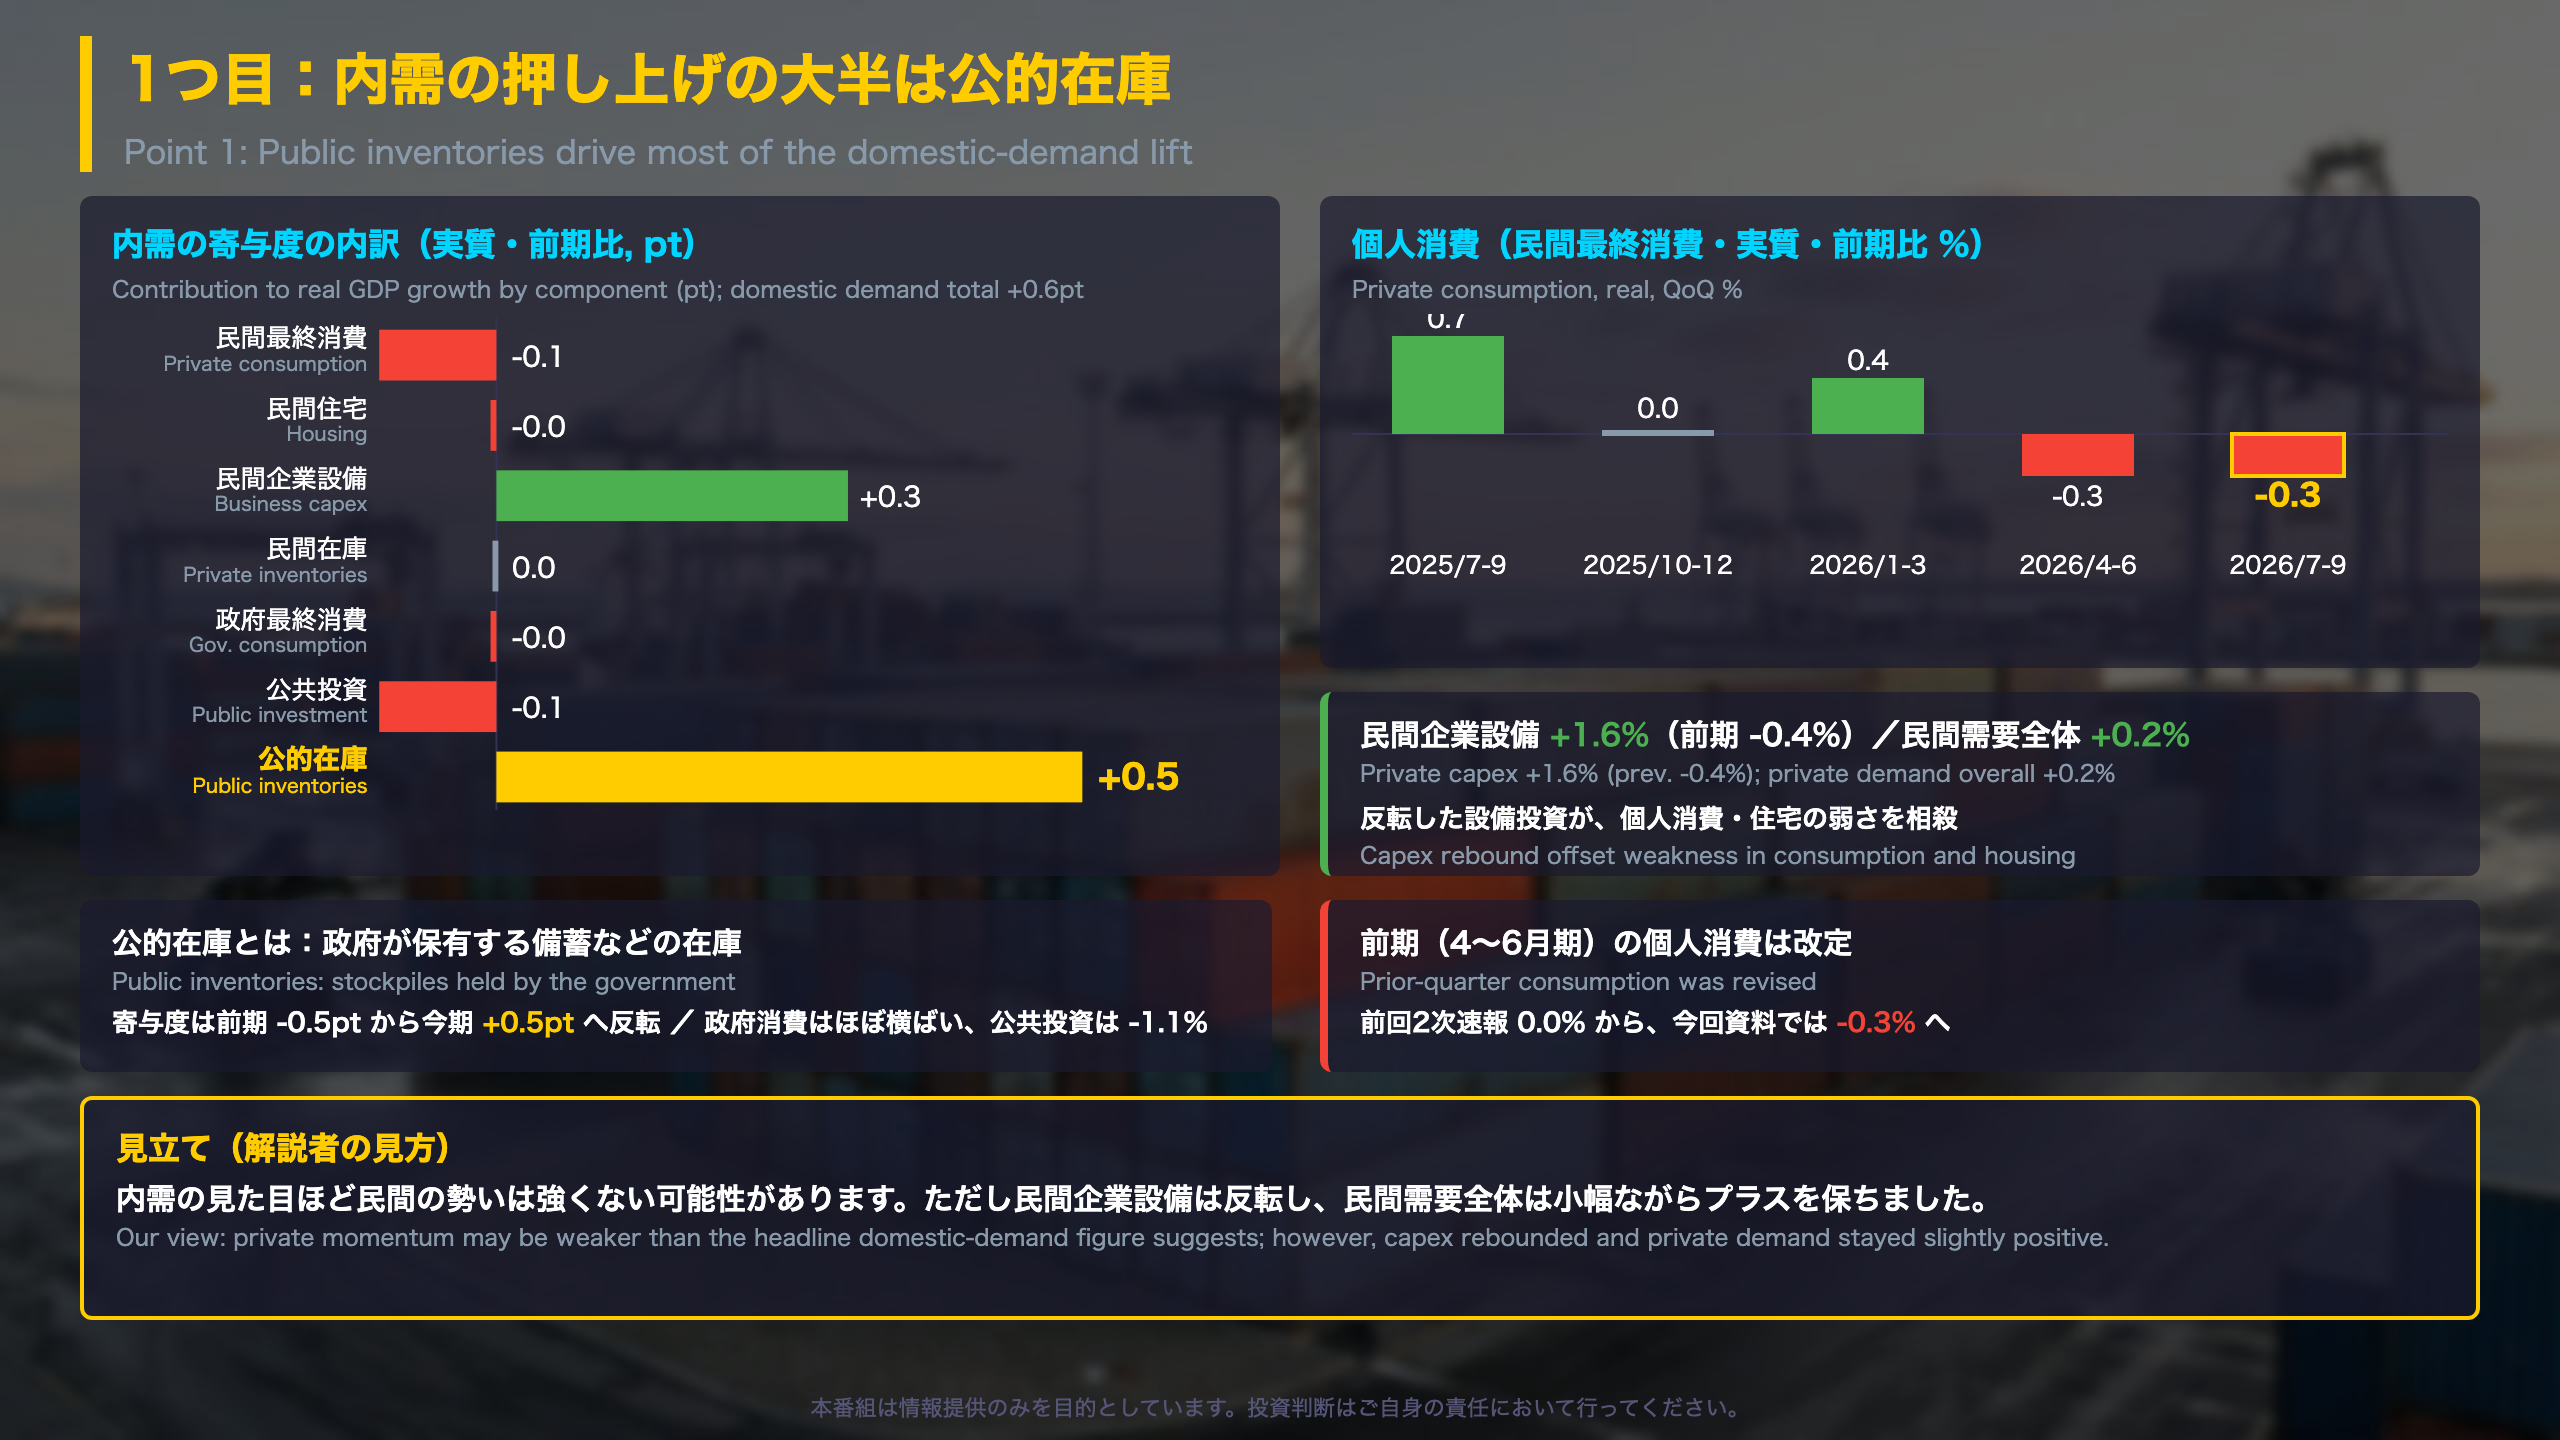
Key point: domestic demand added 0.6 points to real GDP growth, but 0.5 points came from public inventories, a volatile line that swung from -0.5 points last quarter.
| Component (QoQ) | Jul-Sep | Apr-Jun |
|---|---|---|
| Private consumption | -0.3% | -0.3% |
| Housing investment | -1.1% | -0.6% |
| Business capex | +1.6% | -0.4% |
| Government consumption | -0.0% | +1.5% |
| Public investment | -1.1% | -0.6% |
Why it matters. Private consumption is the largest component of Japanese GDP. Year on year it is -0.2%, the first negative reading in the five quarters shown. April-June has also been revised down, from 0.0% in the earlier second estimate to -0.3%.
Two ways to read it. The constructive reading points to the capex rebound and private demand that stayed slightly positive (+0.2%). The cautious reading notes that final demand excluding inventories fell 0.5%. Public inventories are a stockpile-change accounting item rather than government spending on goods and services, so the composition matters more than the headline contribution.
Markets. The release is silent on rates, equities or the yen. We make no forecast; the practical check is whether the second estimate revises consumption and capex.
深掘り2:輸入の増加が外需を押し下げた
External demand and prices: import volume versus import prices
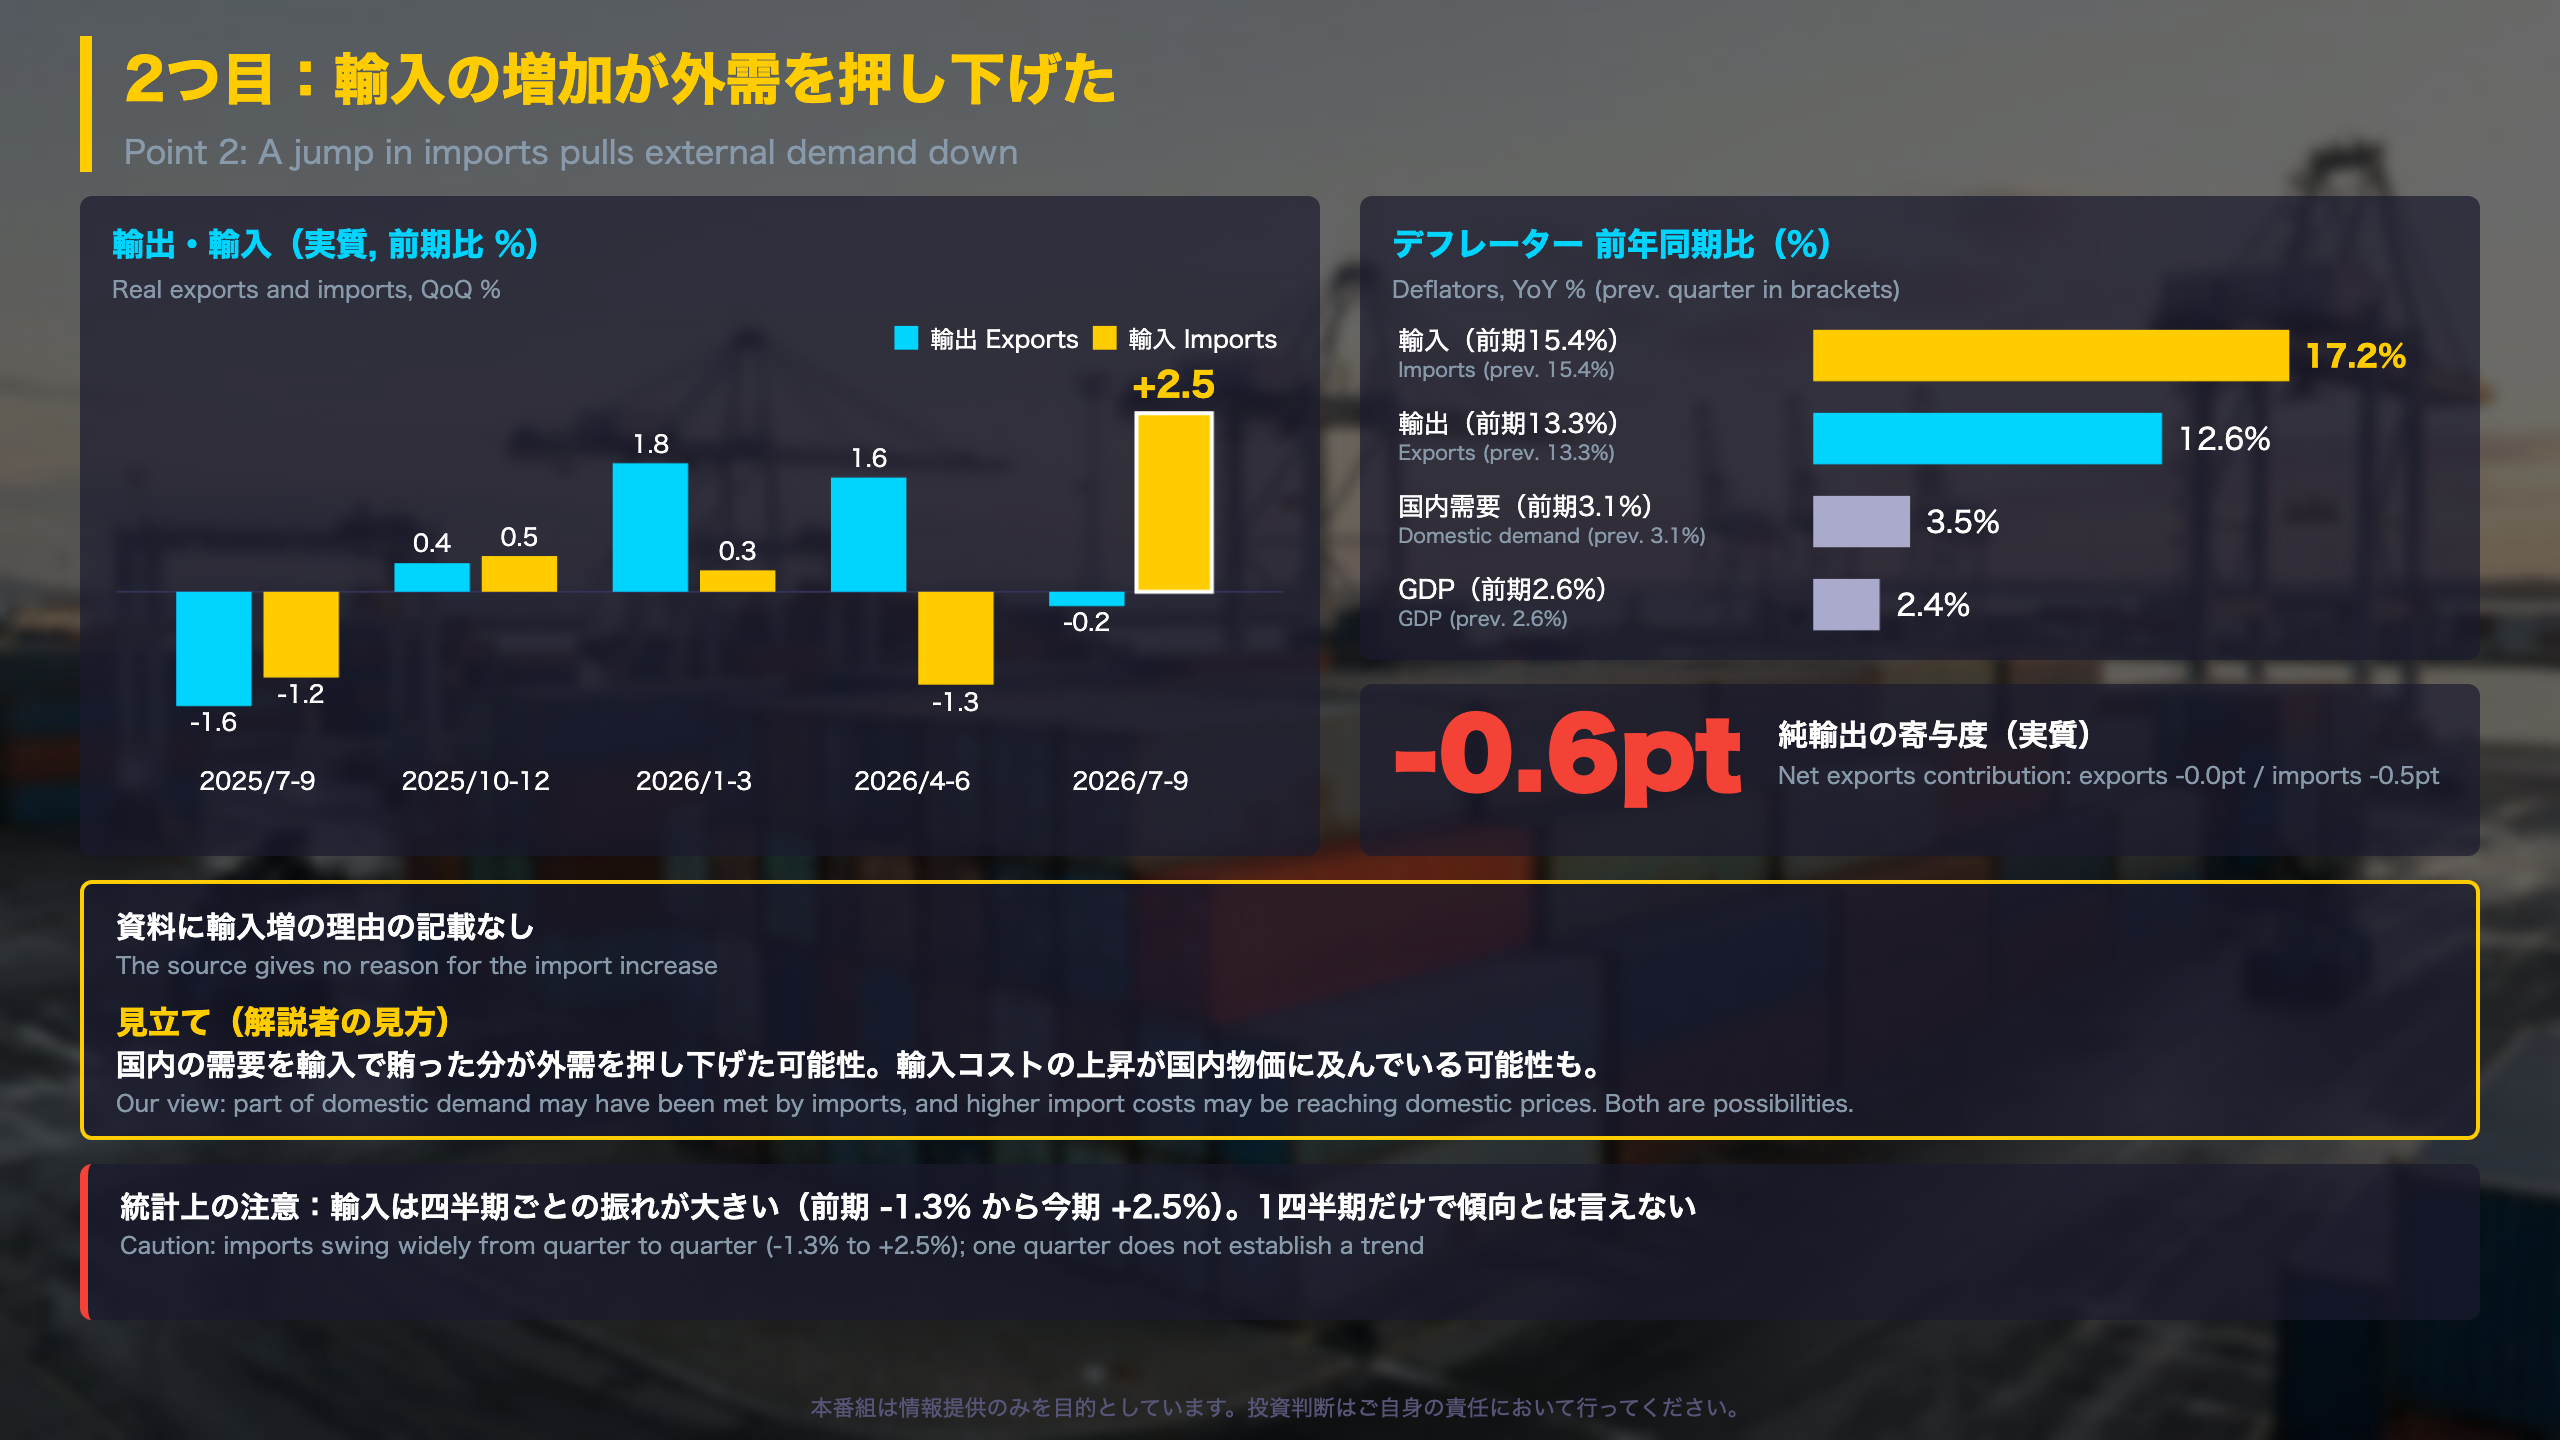
Headline. Net exports subtracted 0.6 points from real GDP growth (exports -0.0 points, imports -0.5 points). In nominal terms the drag was larger, at -1.1 points.
Volume (real, QoQ)
| Q3 2025 | Q4 | Q1 2026 | Q2 | Q3 | |
|---|---|---|---|---|---|
| Exports | -1.6% | 0.4% | 1.8% | 1.6% | -0.2% |
| Imports | -1.2% | 0.5% | 0.3% | -1.3% | 2.5% |
The 2.5% import gain is the largest of the five quarters shown, and it follows a -1.3% quarter, so part of it may be a rebound.
Prices (YoY)
- Import deflator: 17.2% (prev. 15.4%)
- Export deflator: 12.6% (prev. 13.3%)
- Domestic demand deflator: 3.5% (prev. 3.1%)
- GDP deflator: 2.4% (prev. 2.6%)
The gap between the domestic demand deflator and the GDP deflator is what you would expect when import prices rise faster than export prices. Real GNI (-0.1%) is close to real GDP (-0.0%), so no large income leakage shows up this quarter.
Two readings
Imports can reflect strong domestic demand, or they can carry higher costs into domestic prices. The source gives no reason for the import rise, so both remain possibilities. For comparison, US trade data feed into GDP the same way, but US imports are reported on a monthly basis well before GDP; Japan’s quarterly release gives only the aggregate.
Markets. The source is silent on the yen and rates; we make no forecast.
質疑で深める:日銀の判断材料と次の確認点
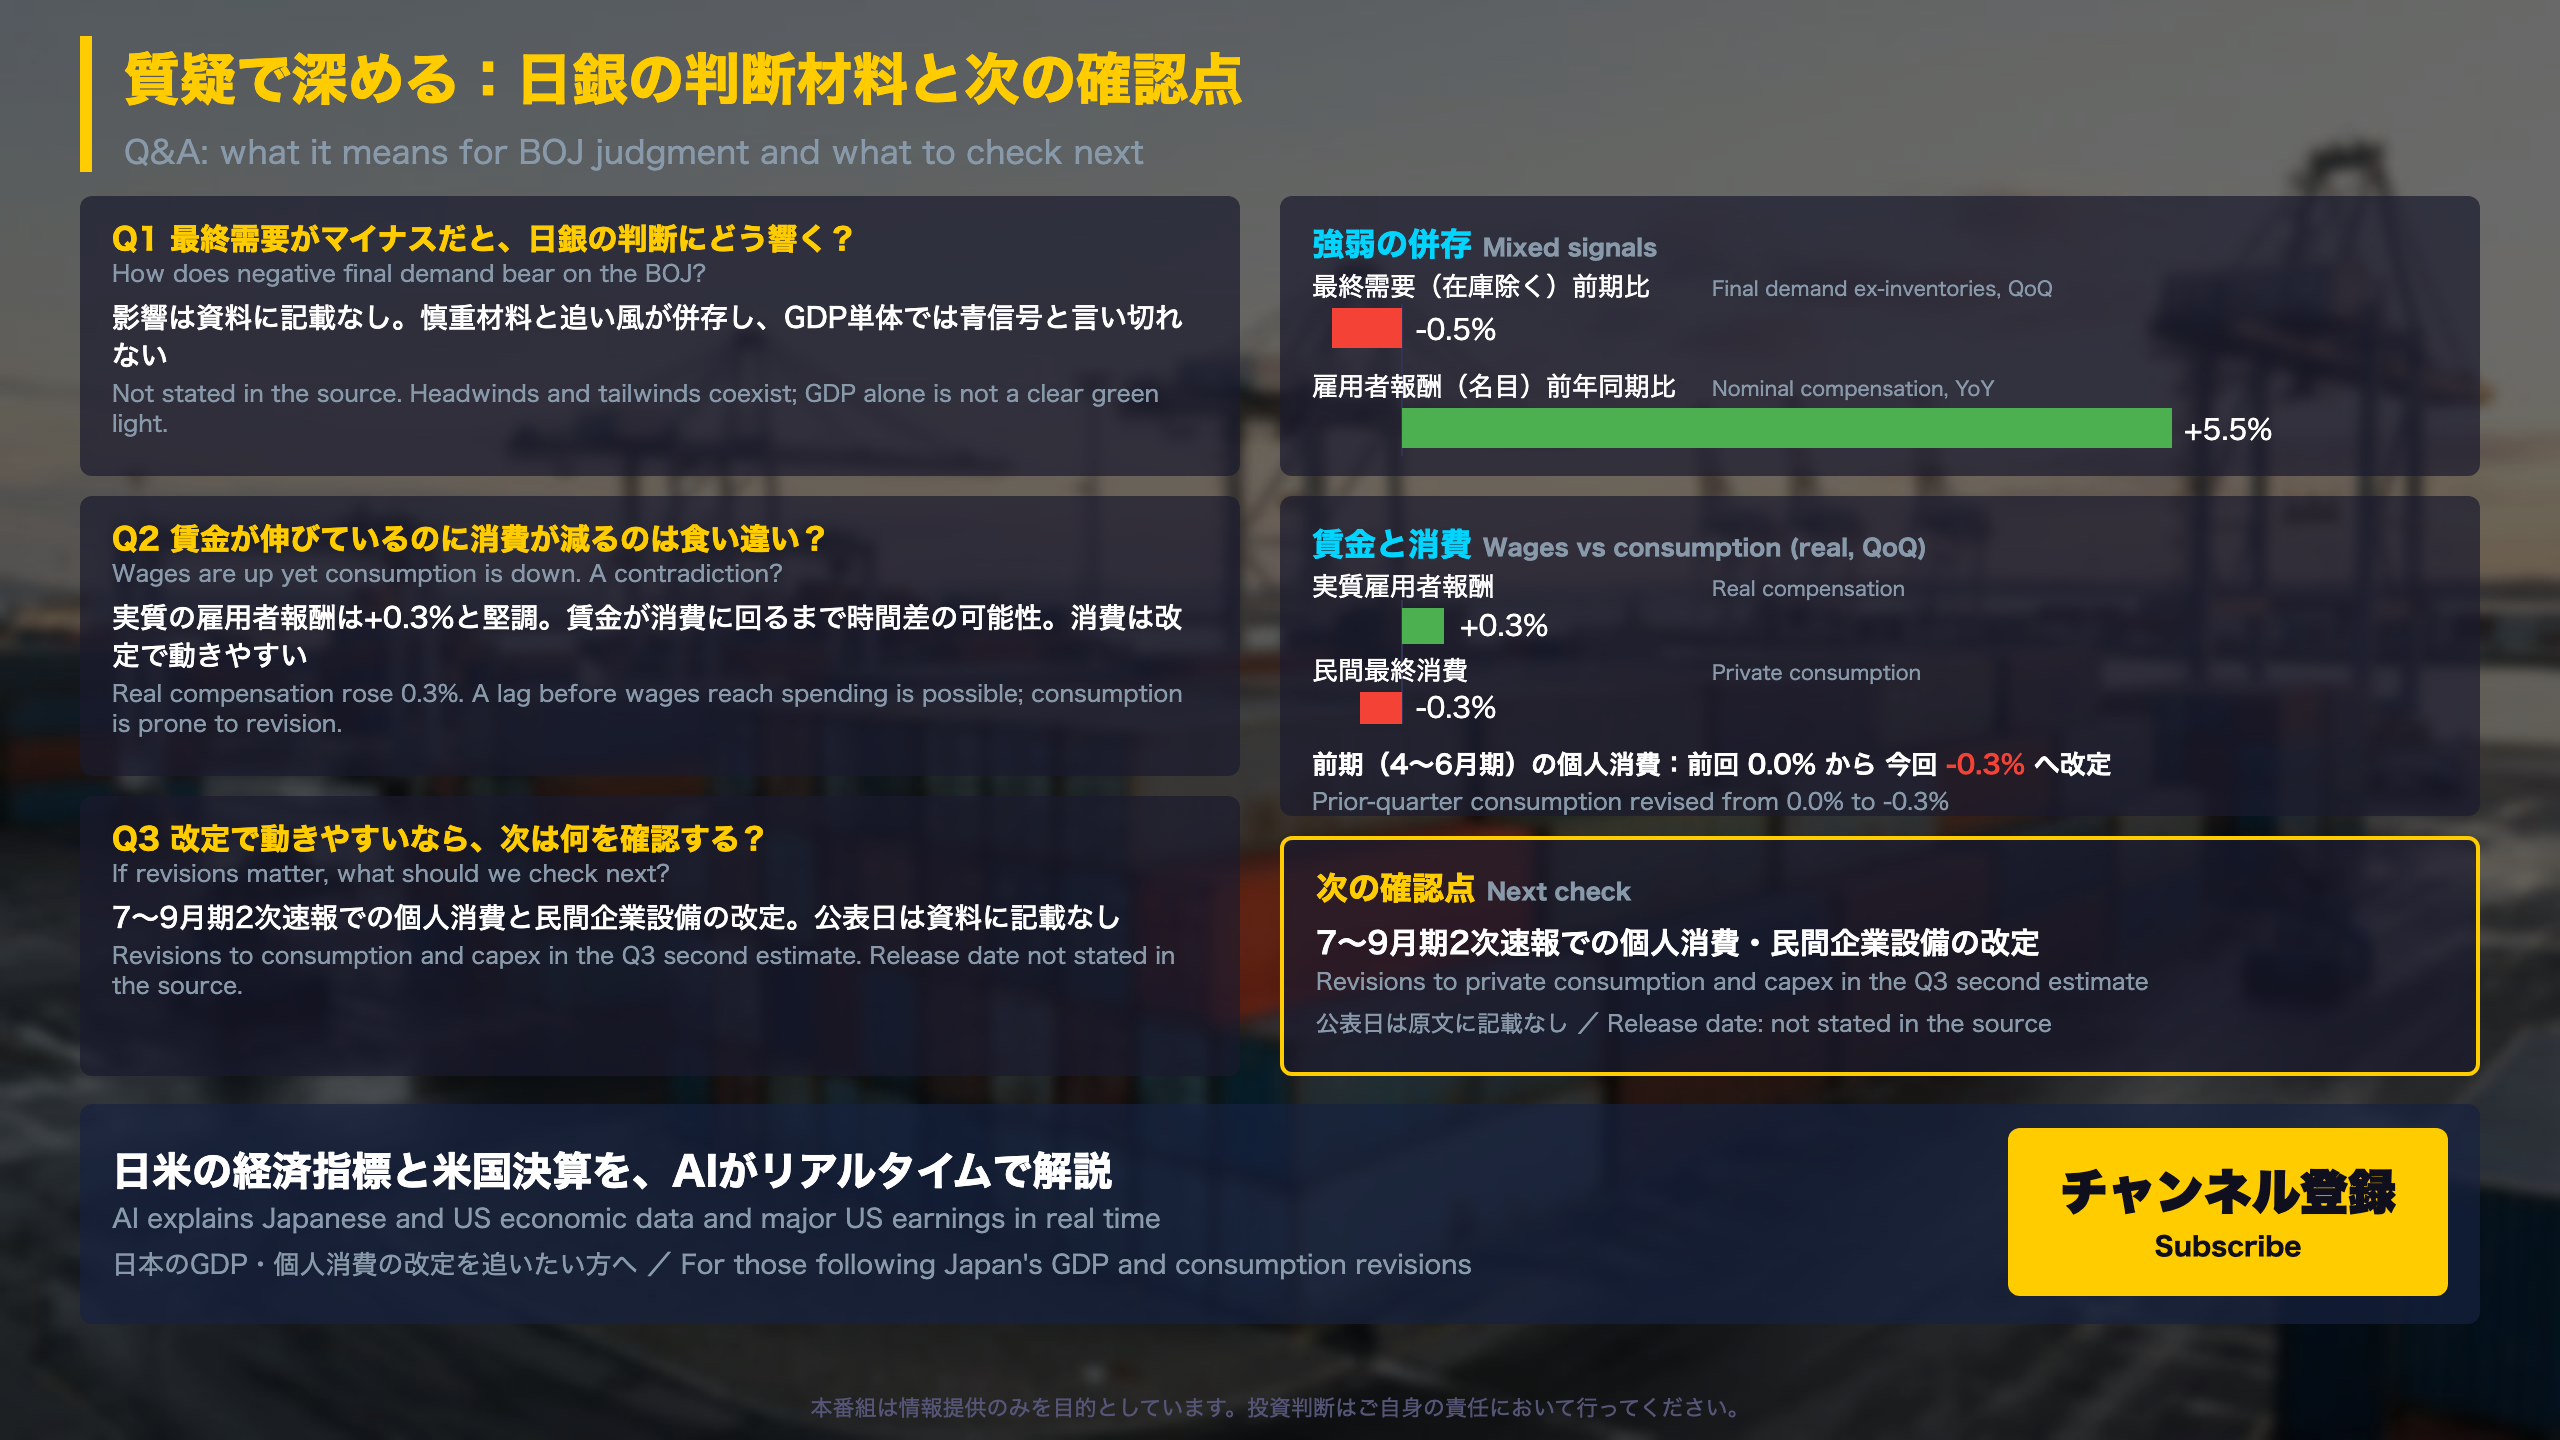
Q&A add-on: wages, prices and revisions
Wages versus spending
| Q3 2025 | Q4 | Q1 2026 | Q2 | Q3 | |
|---|---|---|---|---|---|
| Real compensation of employees (QoQ) | 0.3% | 0.6% | 0.4% | 1.1% | 0.3% |
| Private consumption (real, QoQ) | 0.7% | 0.0% | 0.4% | -0.3% | -0.3% |
Real compensation has been positive in all five quarters shown. Year on year it is +2.4% real and +5.5% nominal (prev. +2.5% and +5.3%), while private consumption turned to -0.2% year on year. The source does not explain the gap, so a lag between income and spending is only a hypothesis.
Prices
The domestic demand deflator rose 1.0% QoQ (prev. 1.4%) and 3.5% YoY (prev. 3.1%). The quarterly pace slowed while the annual rate rose.
Why revisions matter
Japan’s Cabinet Office publishes a first preliminary estimate and then a second one with more source data. At the last release, April-June real GDP was revised from 0.3% to 0.4%. In this release, April-June private consumption shows -0.3% versus 0.0% in that second estimate, and business investment -0.4% versus -0.9%. Component revisions can be sizeable even when the headline barely moves.
For the Bank of Japan watcher
The BOJ is the central bank here, comparable to the Fed in role. The GDP source says nothing about its policy and we make no forecast. What the data do offer is a split picture: weak final demand and consumption, but firm wages and capex.
Next check: the second estimate’s revisions to consumption and capex. The release date is not stated in the source.
Disclaimer: This article is for informational purposes only. All investment decisions are made solely at your own risk.