This article was automatically generated by the NFC Market Live AI analysis system. (Updated: 2026-11-09 14:14 JST)
📄 Primary Source
内閣府経済社会総合研究所
https://www.esri.cao.go.jp/jp/stat/di/202609psummary.pdf
📊 AI breakdown of Japan’s Composite Index (September 2026 preliminary), released by the Cabinet Office on Nov 9.
The coincident index rose 0.7 points to 119.5, its first rise in 2 months, and the assessment stays at ‘improving’. Production and shipments led the gain.
📉 The leading index fell 1.6 points to 116.4, its first decline in 17 months. Its 3-month moving average still rose 0.06 points, extending a 15-month streak.
💡 Current conditions are improving while forward momentum looks softer. The September revision, with the leading-series breakdown, is the next checkpoint.
景気動向指数 9月分速報:サマリー
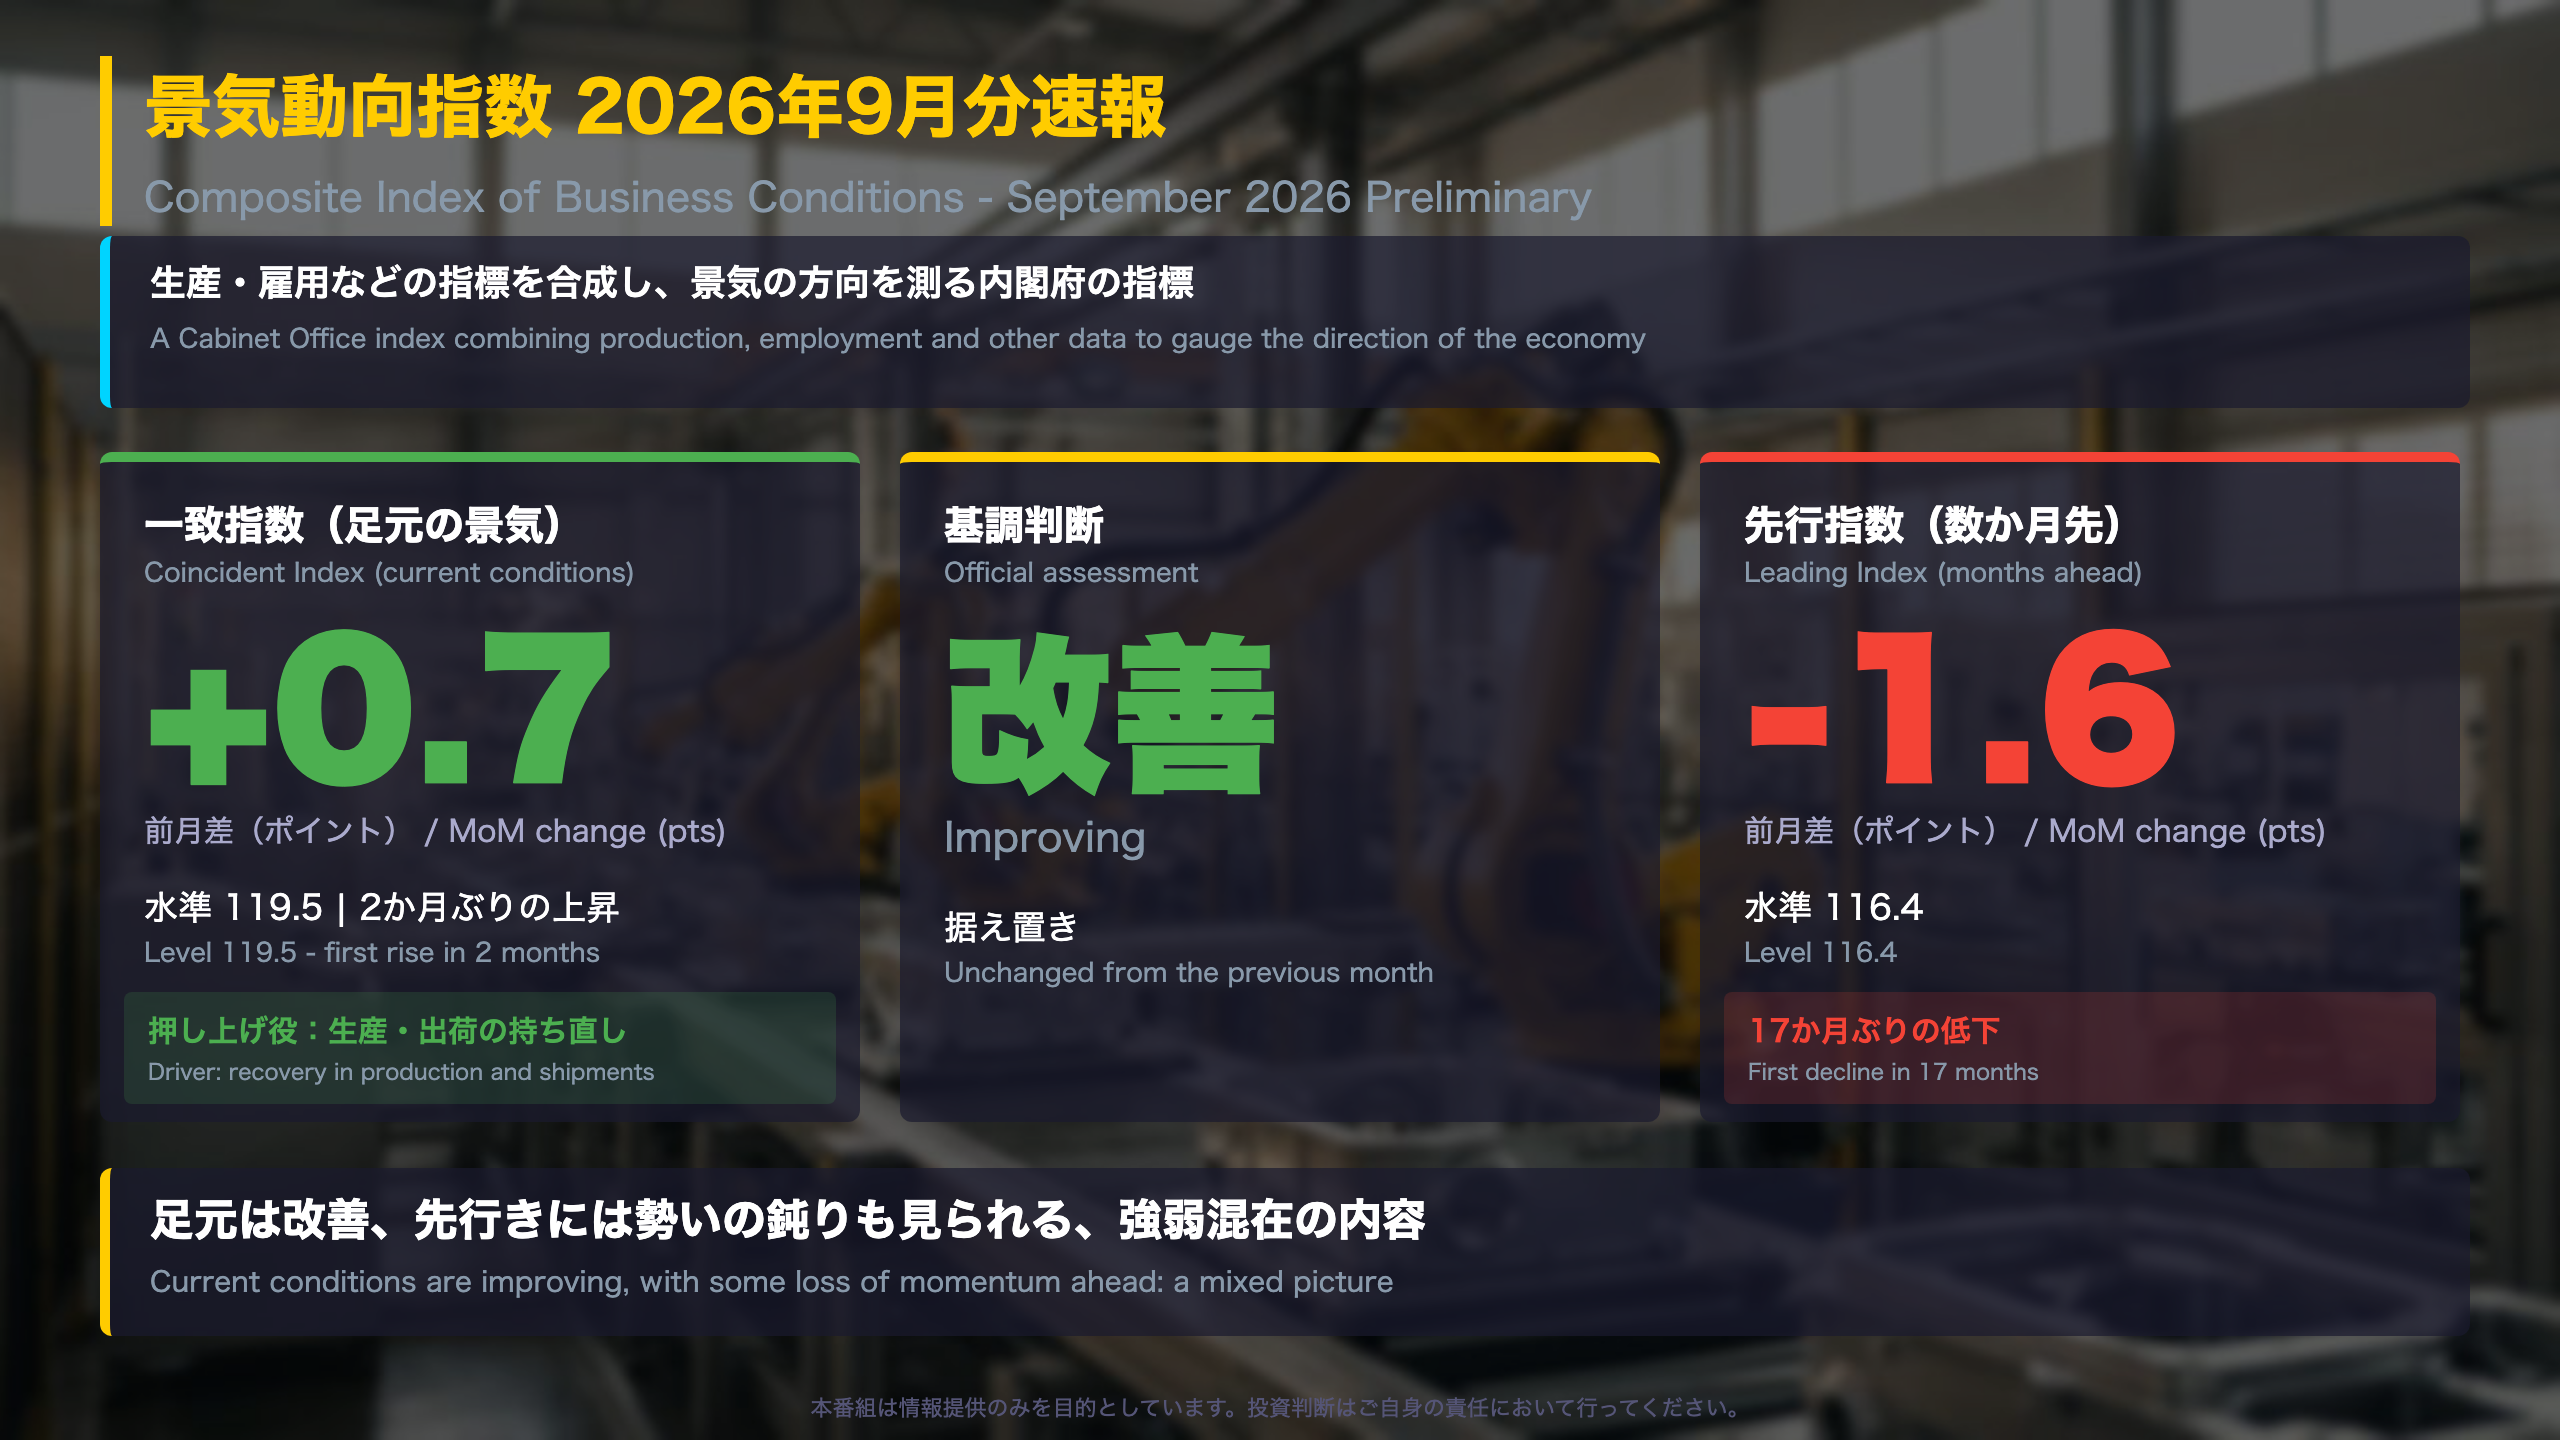
Japan’s Composite Index, September preliminary: improving, with a softer leading signal
What the index is. The Composite Index (CI) is compiled by the Economic and Social Research Institute of Japan’s Cabinet Office. It blends 10 coincident, 11 leading and 9 lagging series into three indexes (2020 = 100). It plays a role similar to the Conference Board’s Leading and Coincident Economic Indexes in the US, but Japan’s official assessment is produced by a mechanical rule applied to moving averages.
Headline figures
- Coincident index: 119.5, up 0.7 points, the first rise in 2 months
- Leading index: 116.4, down 1.6 points, the first decline in 17 months
- Lagging index: 116.0, up 3.6 points
- Assessment: ‘improving’ (unchanged)
Why the details matter
The Cabinet Office stresses the 3-month and 7-month backward moving averages because single-month changes are noisy. Both averages of the coincident index have now risen for 9 straight months. The leading index average also rose, by 0.06 points, but that is far smaller than the 0.60 points posted in August.
Reading the signals together
The release itself offers no market view. For investors, the useful reading is that current activity is still on an improving path while the forward-looking gauge has lost some pace. The September revision, which usually carries the leading-series contributions, will show whether the dip was broad-based or concentrated in a few series.
一致指数:生産・出荷が押し上げ
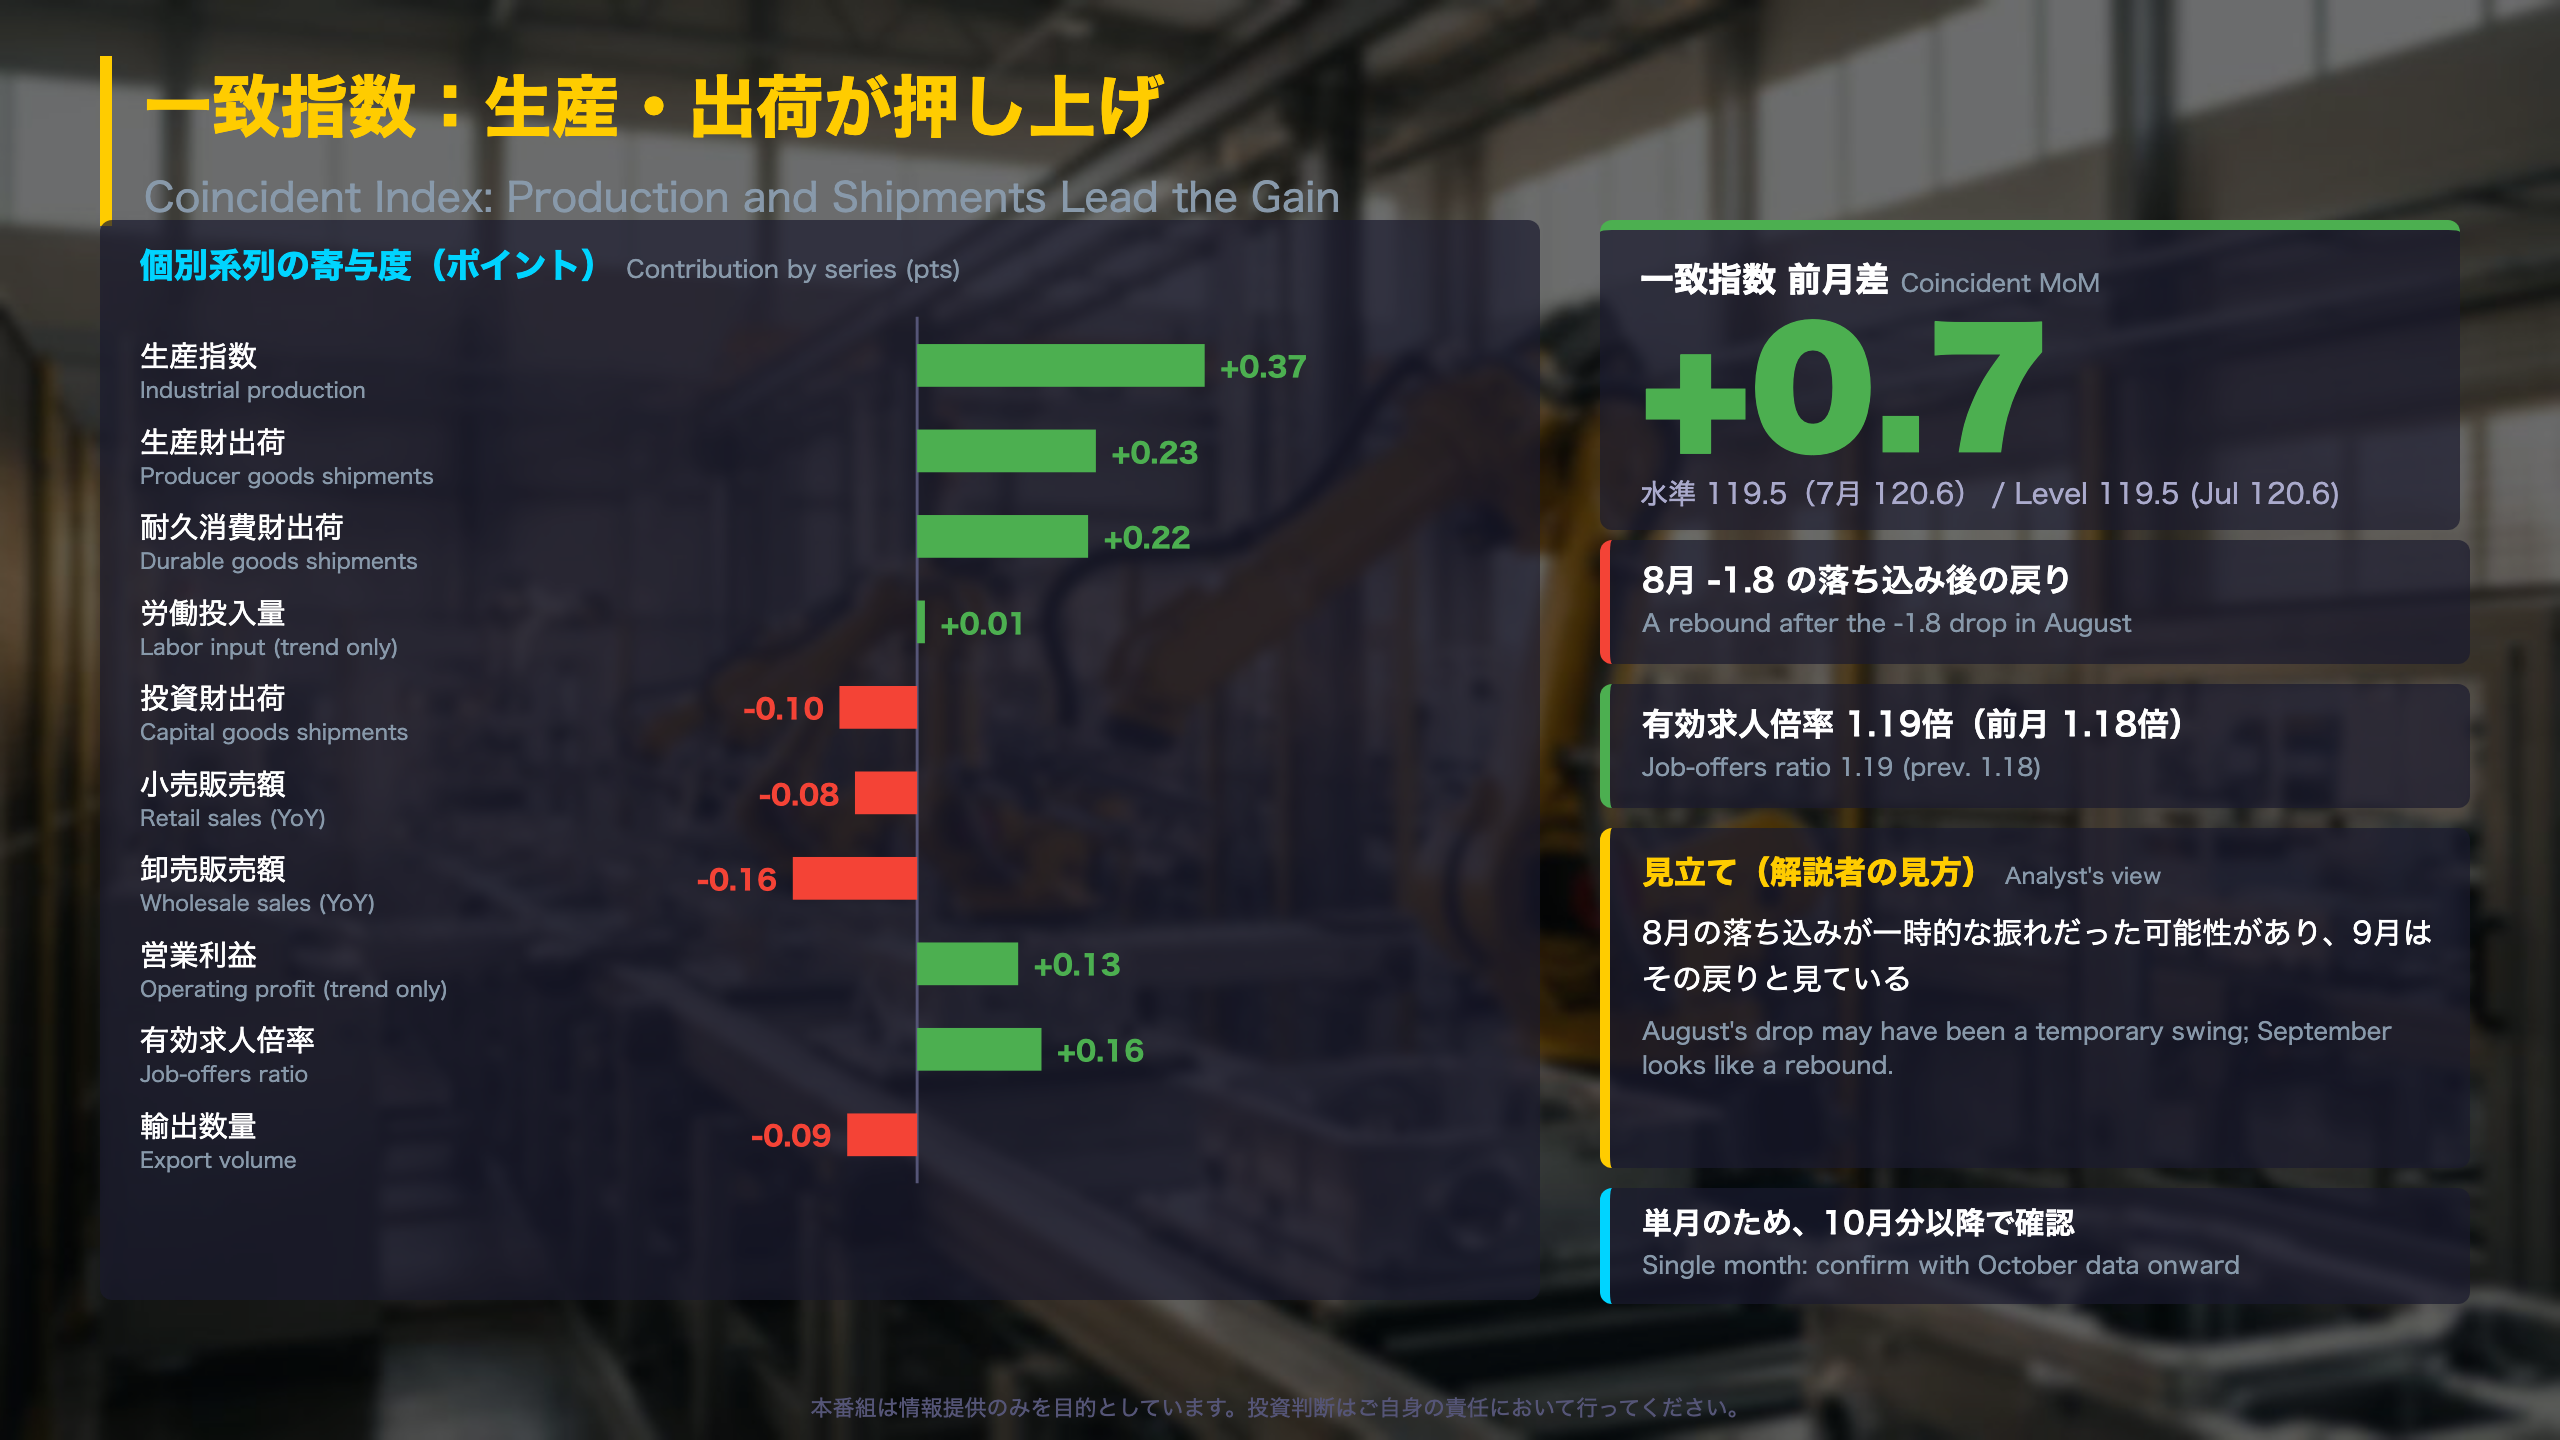
Coincident index: what drove September’s rebound
Context. Japan’s coincident index is built from 10 series with equal weights, mainly industrial output, shipments, sales, employment and exports. Two of them, labor input and operating profit, were not yet available for September, so they contribute only through a long-run trend component.
Contributions to the +0.7 point rise
- Industrial production: +0.37
- Producer-goods shipments: +0.23
- Durable-goods shipments: +0.22
- Wholesale sales (YoY): -0.16; capital-goods shipments: -0.10; exports: -0.09; retail sales (YoY): -0.08
The August comparison
In August the same three manufacturing series subtracted 0.39, 0.49 and 0.39 points. September gave back roughly 0.4 to 0.2 points each, so the rebound is partial and the index (119.5) remains below July’s 120.6.
International comparison
The pattern is comparable to the US, where industrial production and durable-goods orders swing monthly and are usually read through multi-month averages. Japan’s Cabinet Office does exactly that: its assessment rests on 3- and 7-month moving averages, not the monthly change.
What to watch
Preliminary figures get revised: August industrial production went from 102.6 to 101.9. The source offers no market view, so the practical checkpoint is whether October output and shipments hold the September gains.
先行指数:単月は低下、平均は上昇維持
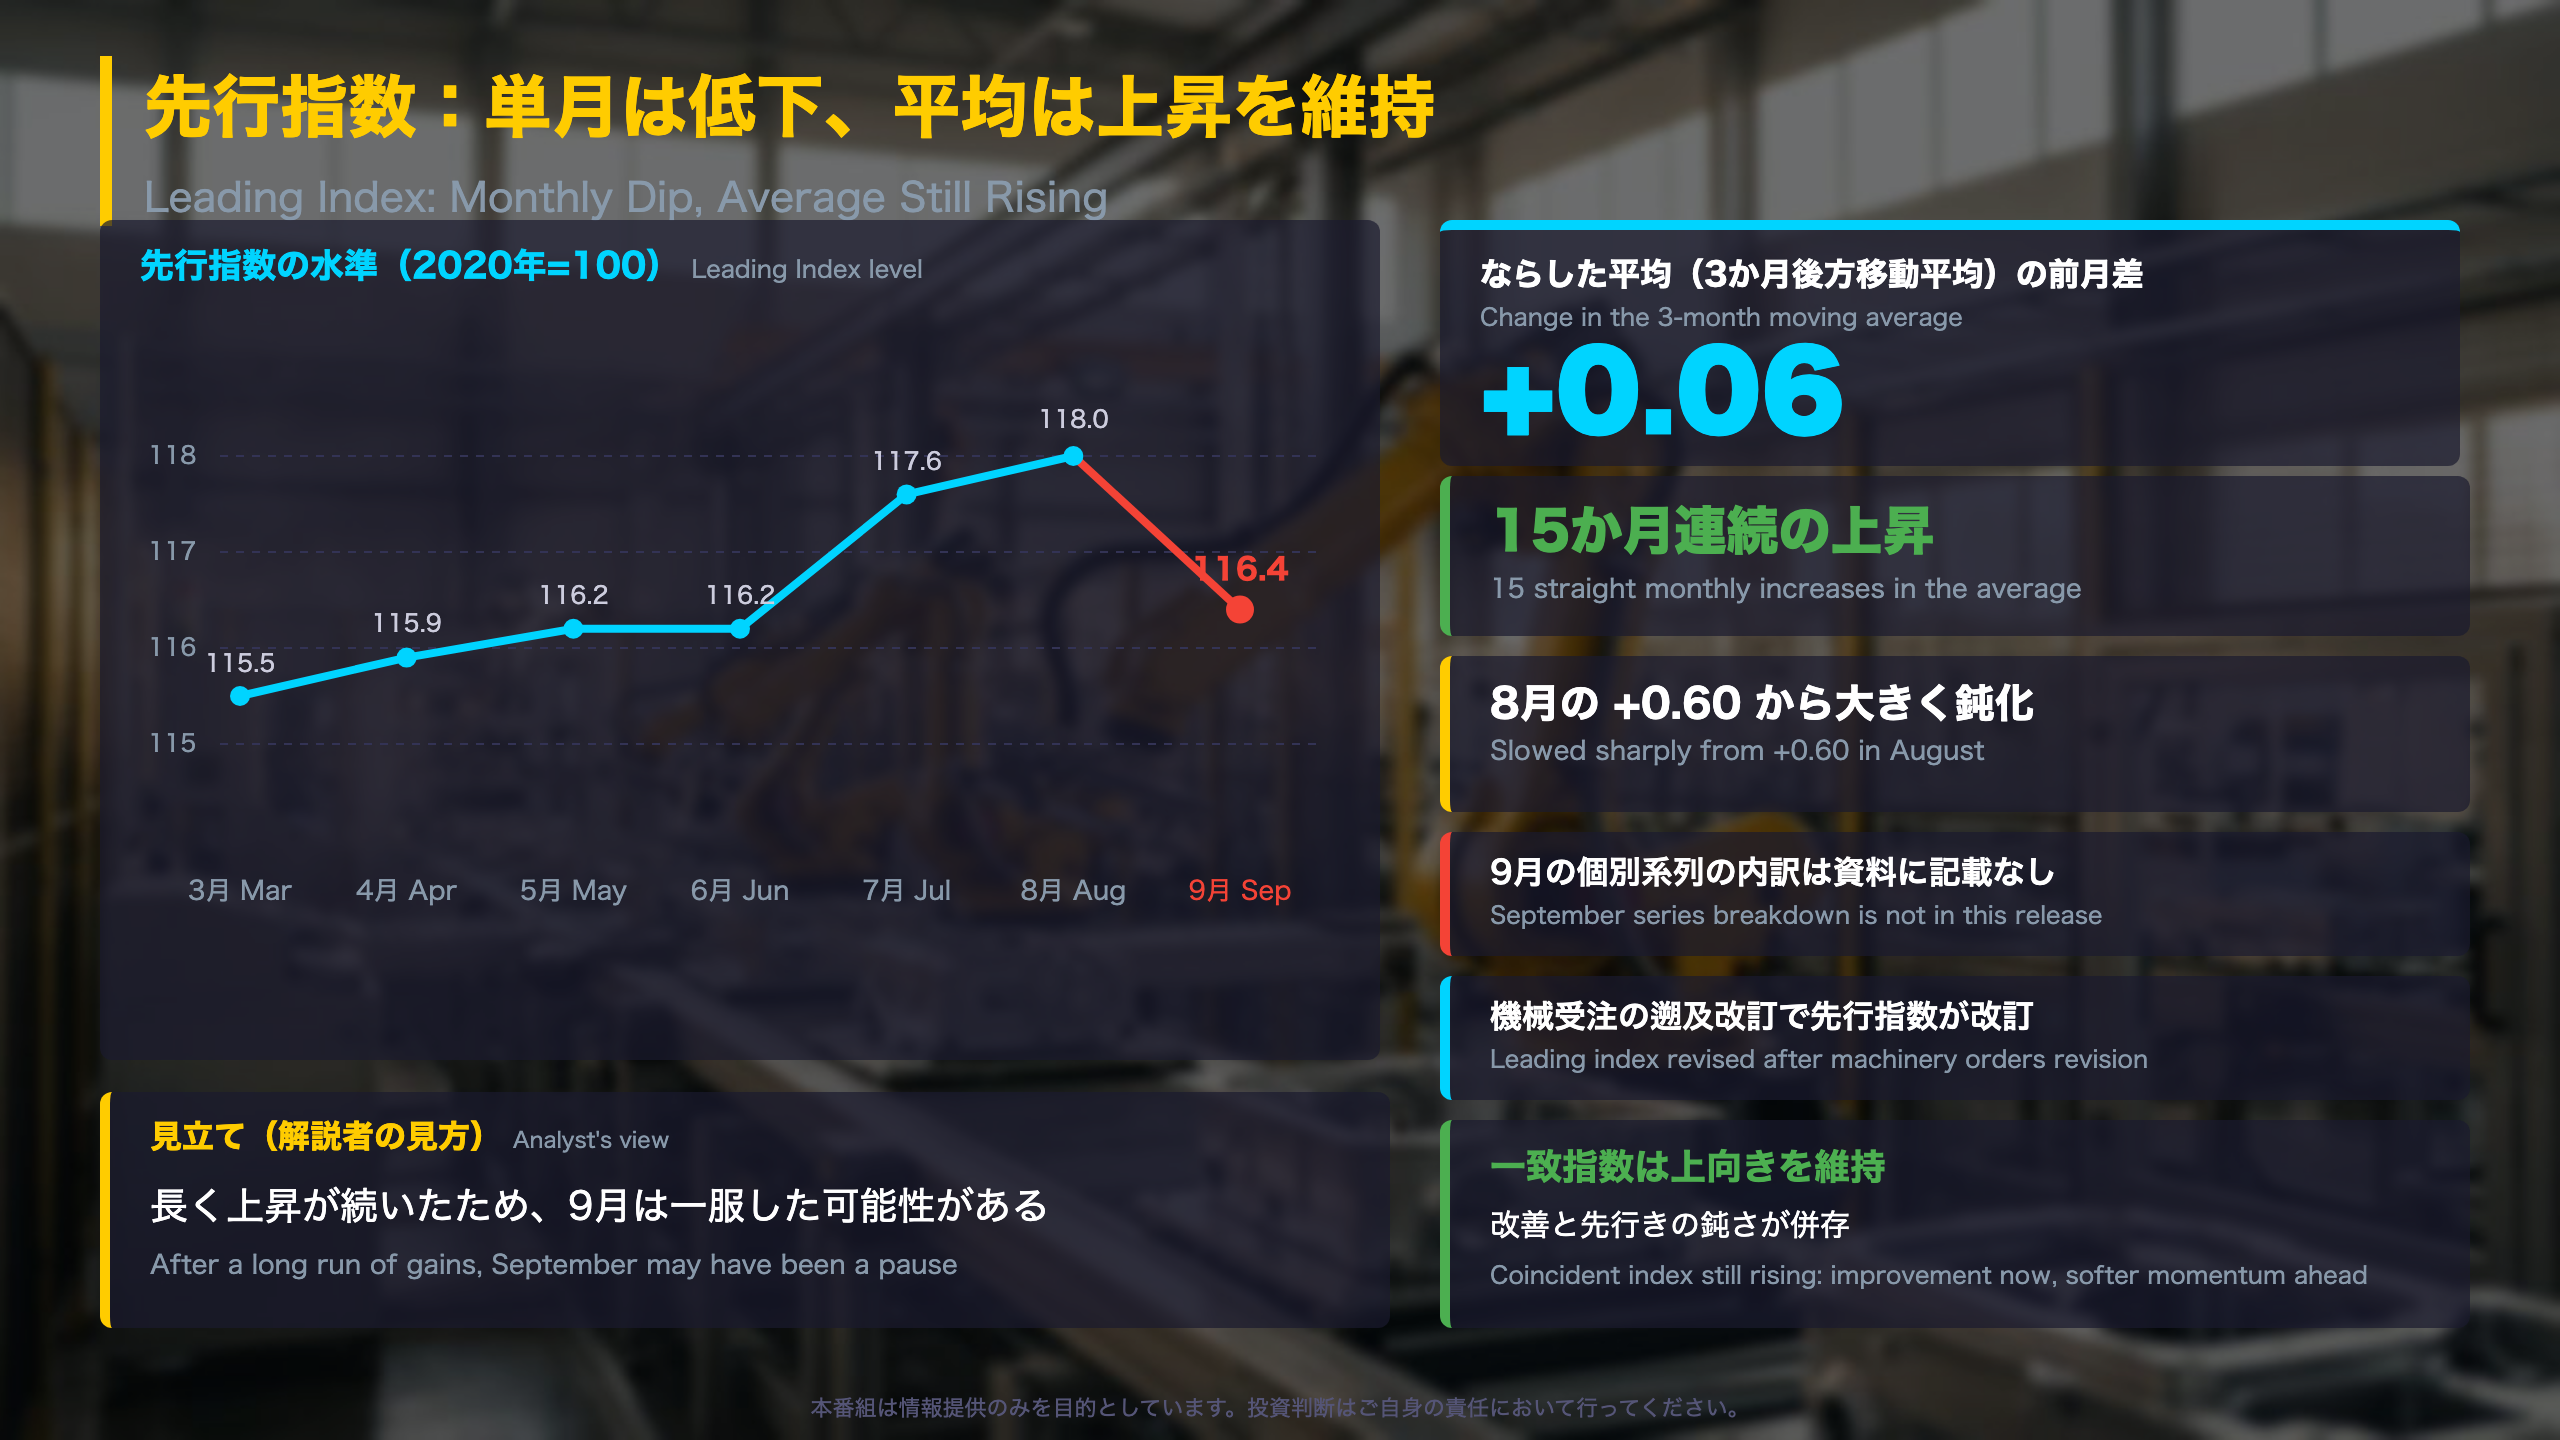
Leading and lagging indexes: a dip inside an uptrend
Institutional note. Japan’s leading index combines 11 series, including new job offers, real machinery orders (manufacturing), housing starts, consumer confidence, the Nikkei commodity index, M2, TOPIX and a small-business sales outlook DI. The US analogue is the Conference Board LEI, which leans more on the yield curve and manufacturing orders.
The numbers
| Item | Jun-Aug path | September |
|---|---|---|
| Leading index level | 116.2, 117.6, 118.0 | 116.4 |
| 3M average change | +0.57 to +0.60 | +0.06 |
| 7M average change | +1.02, +0.78 | +0.30 |
The lagging index jumped 3.6 points to 116.0 after a revised 112.4 in August. Its 3-month average rose 1.40 points, which suggests the earlier recovery is being confirmed in lagging data.
Caveats
The preliminary release does not list September leading-series contributions, so the cause of the drop is unknown. In August, a 7.3-point jump in the small-business sales outlook DI added 0.54 points, a reminder that single series can move the index.
Reading it
A ‘pause’ reading and a ‘trend break’ reading are both possible, but the averages favor the former for now. A downturn signal would need the coincident 3-month average to turn negative by more than 1.08 points, versus +0.20 now. The source gives no market forecast, so the revision report is the checkpoint.
質疑:なぜ「改善」のままなのか
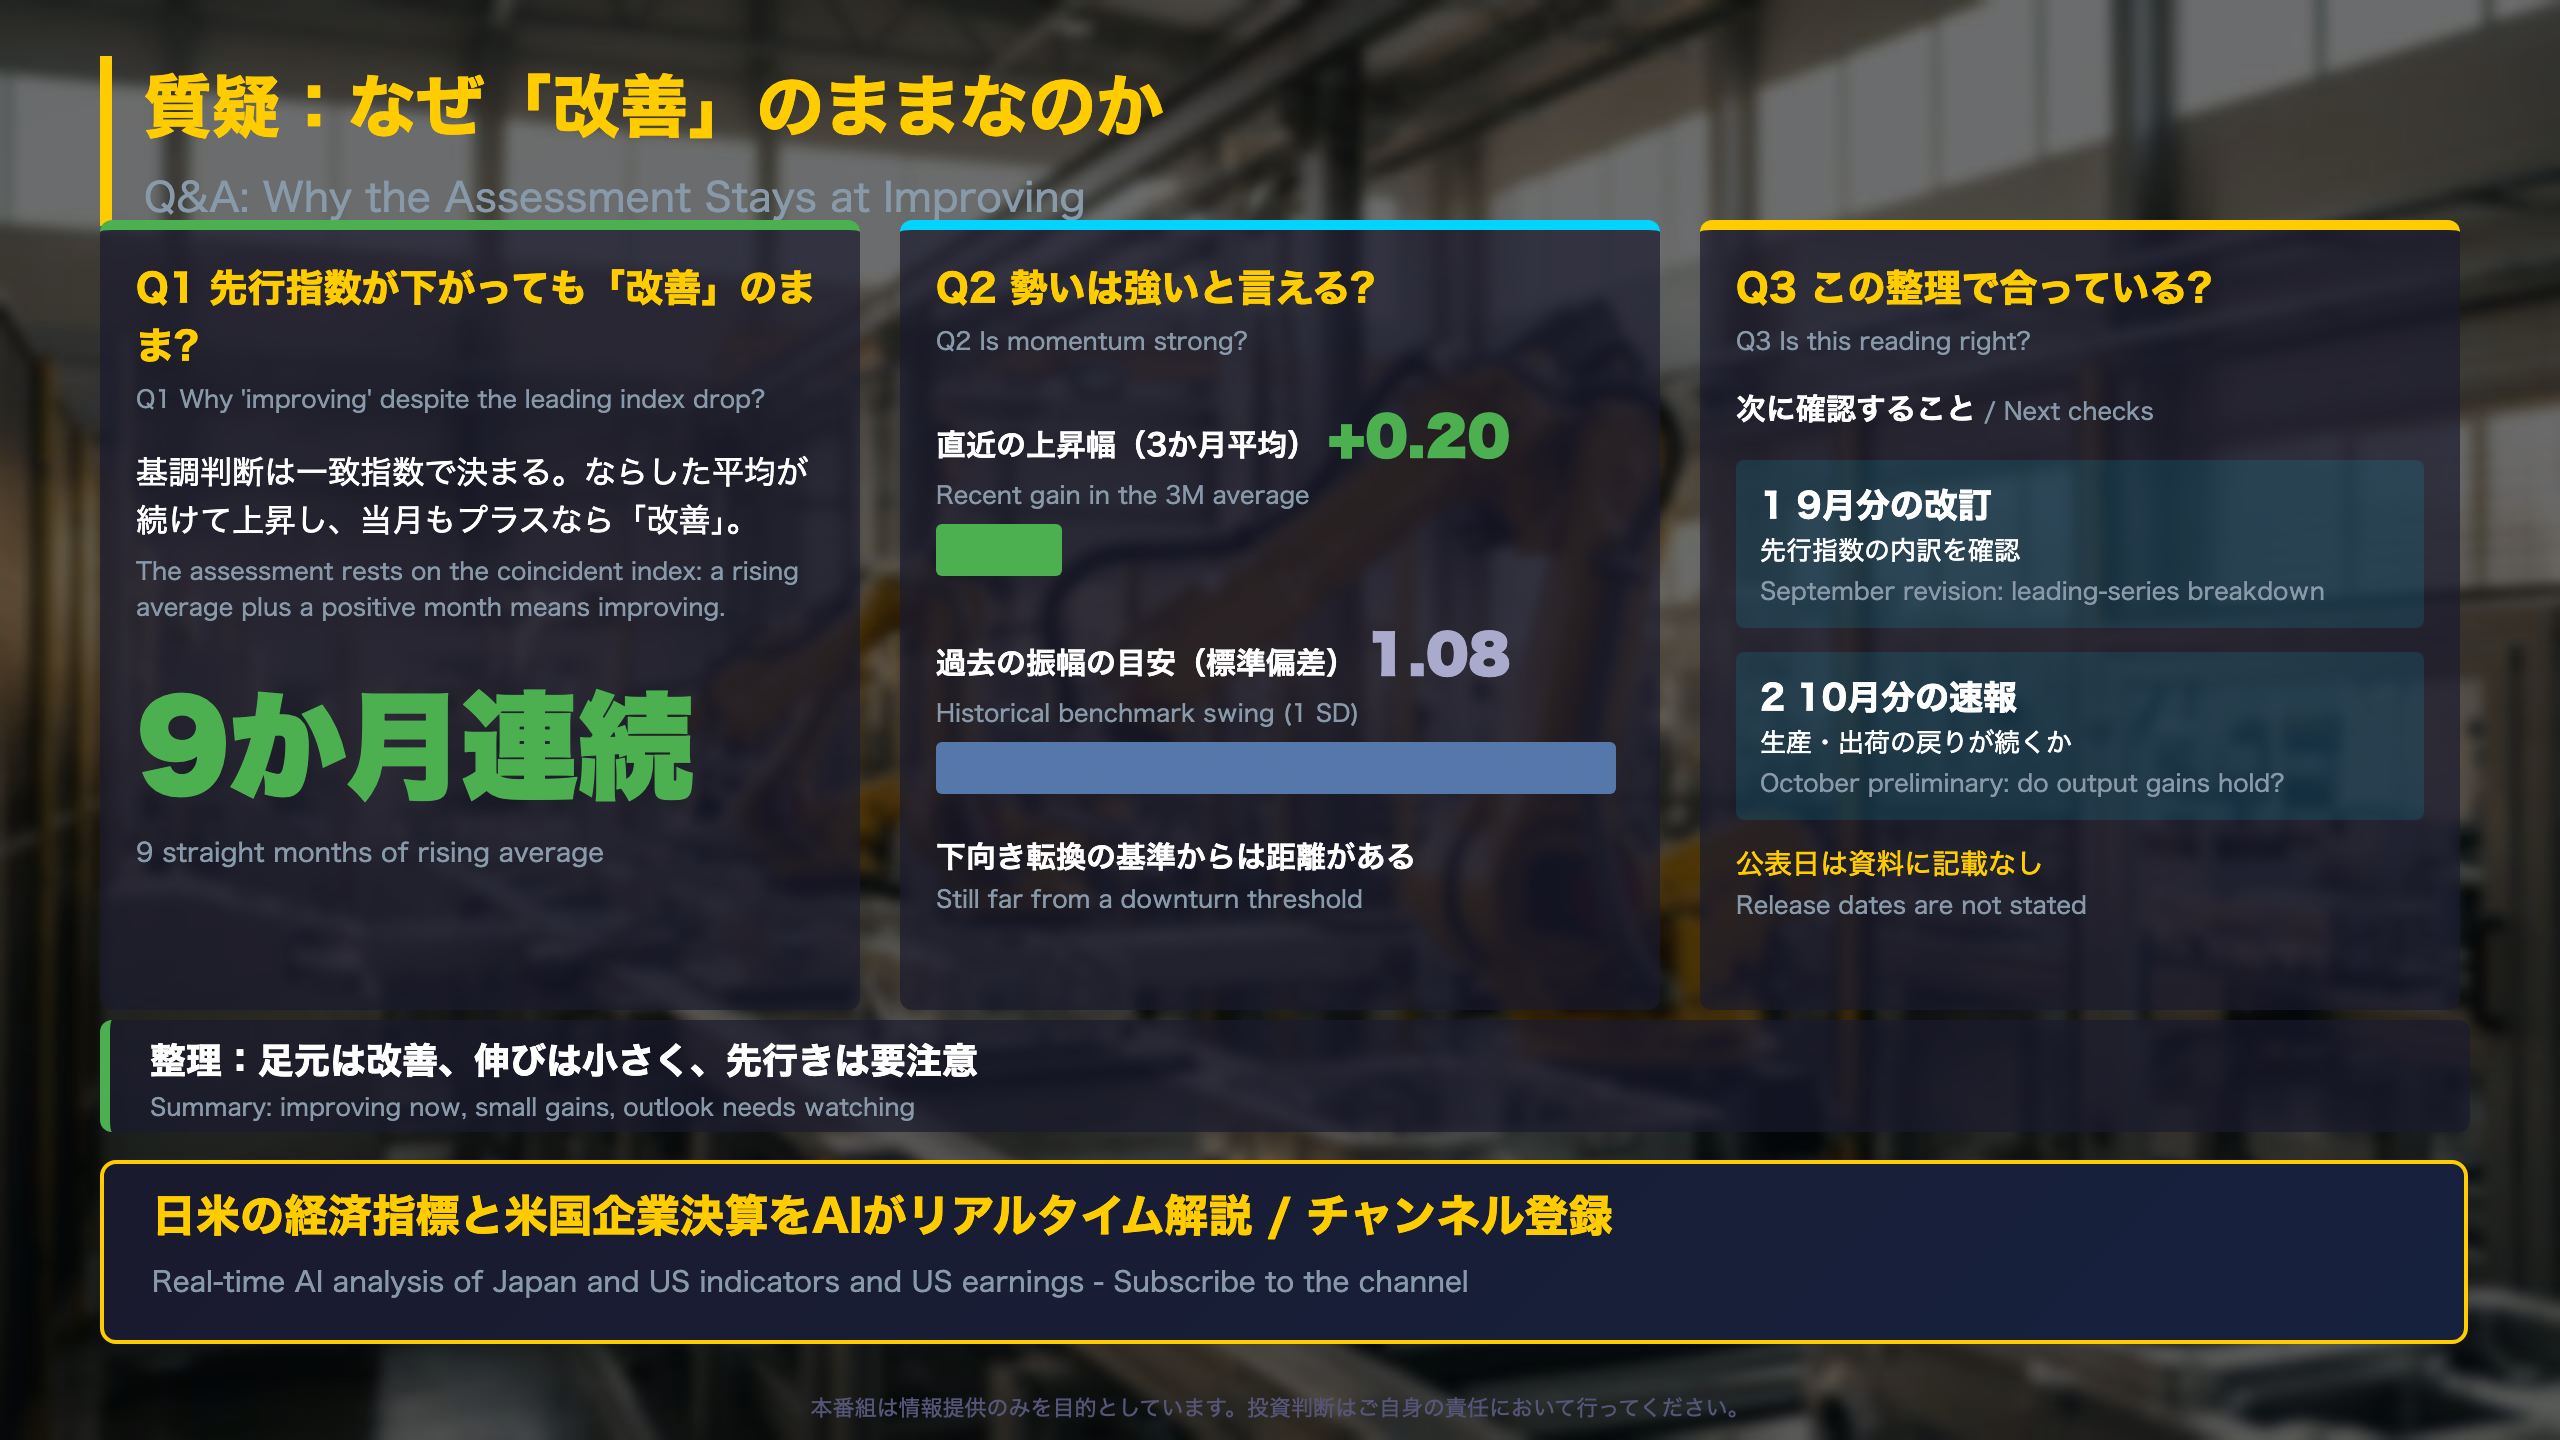
How the Cabinet Office assessment works, and what to check next
Institutional note. Unlike the US, where the NBER dates recessions after the fact, Japan’s CI assessment is a mechanical, real-time rule. Official business-cycle dates are set separately by the head of the Economic and Social Research Institute after a study group review.
The rule in brief
- Improving: the 3-month moving average has risen, normally for 3+ months, and the current month is positive.
- Pausing: the 3-month average turns negative by at least one standard deviation (1.08) and the month is negative.
- Worsening: the 3-month average falls for 3+ months and the month is negative.
The 7-month average (standard deviation 0.83) is used for turning-point calls.
Why ‘improving’ survives
The coincident 3-month average has risen 9 months in a row, and the current month is positive. The latest gain of 0.20 points is small against the 1.08 benchmark, and the 7-month average rose 0.41.
What to watch
The August release was followed by a revision about 19 days later (Oct 7 to Oct 26), which changed the coincident index from 118.7 to 118.8. The source states no release date for the next revision. The source also gives no market view; what it does allow is a checklist: the leading-series breakdown in the September revision and the October output and shipments data.
Disclaimer: This article is for informational purposes only. All investment decisions are made solely at your own risk.