📺 Watch the Full Video Analysis
This article was automatically generated by the NFC Market Live AI analysis system. (Updated: 2026-11-06 22:45 JST)
📄 Primary Source
U.S. Bureau of Labor Statistics
https://www.bls.gov/news.release/empsit.htm
📊 US jobs report for October 2026 (released Nov 6 by the BLS)
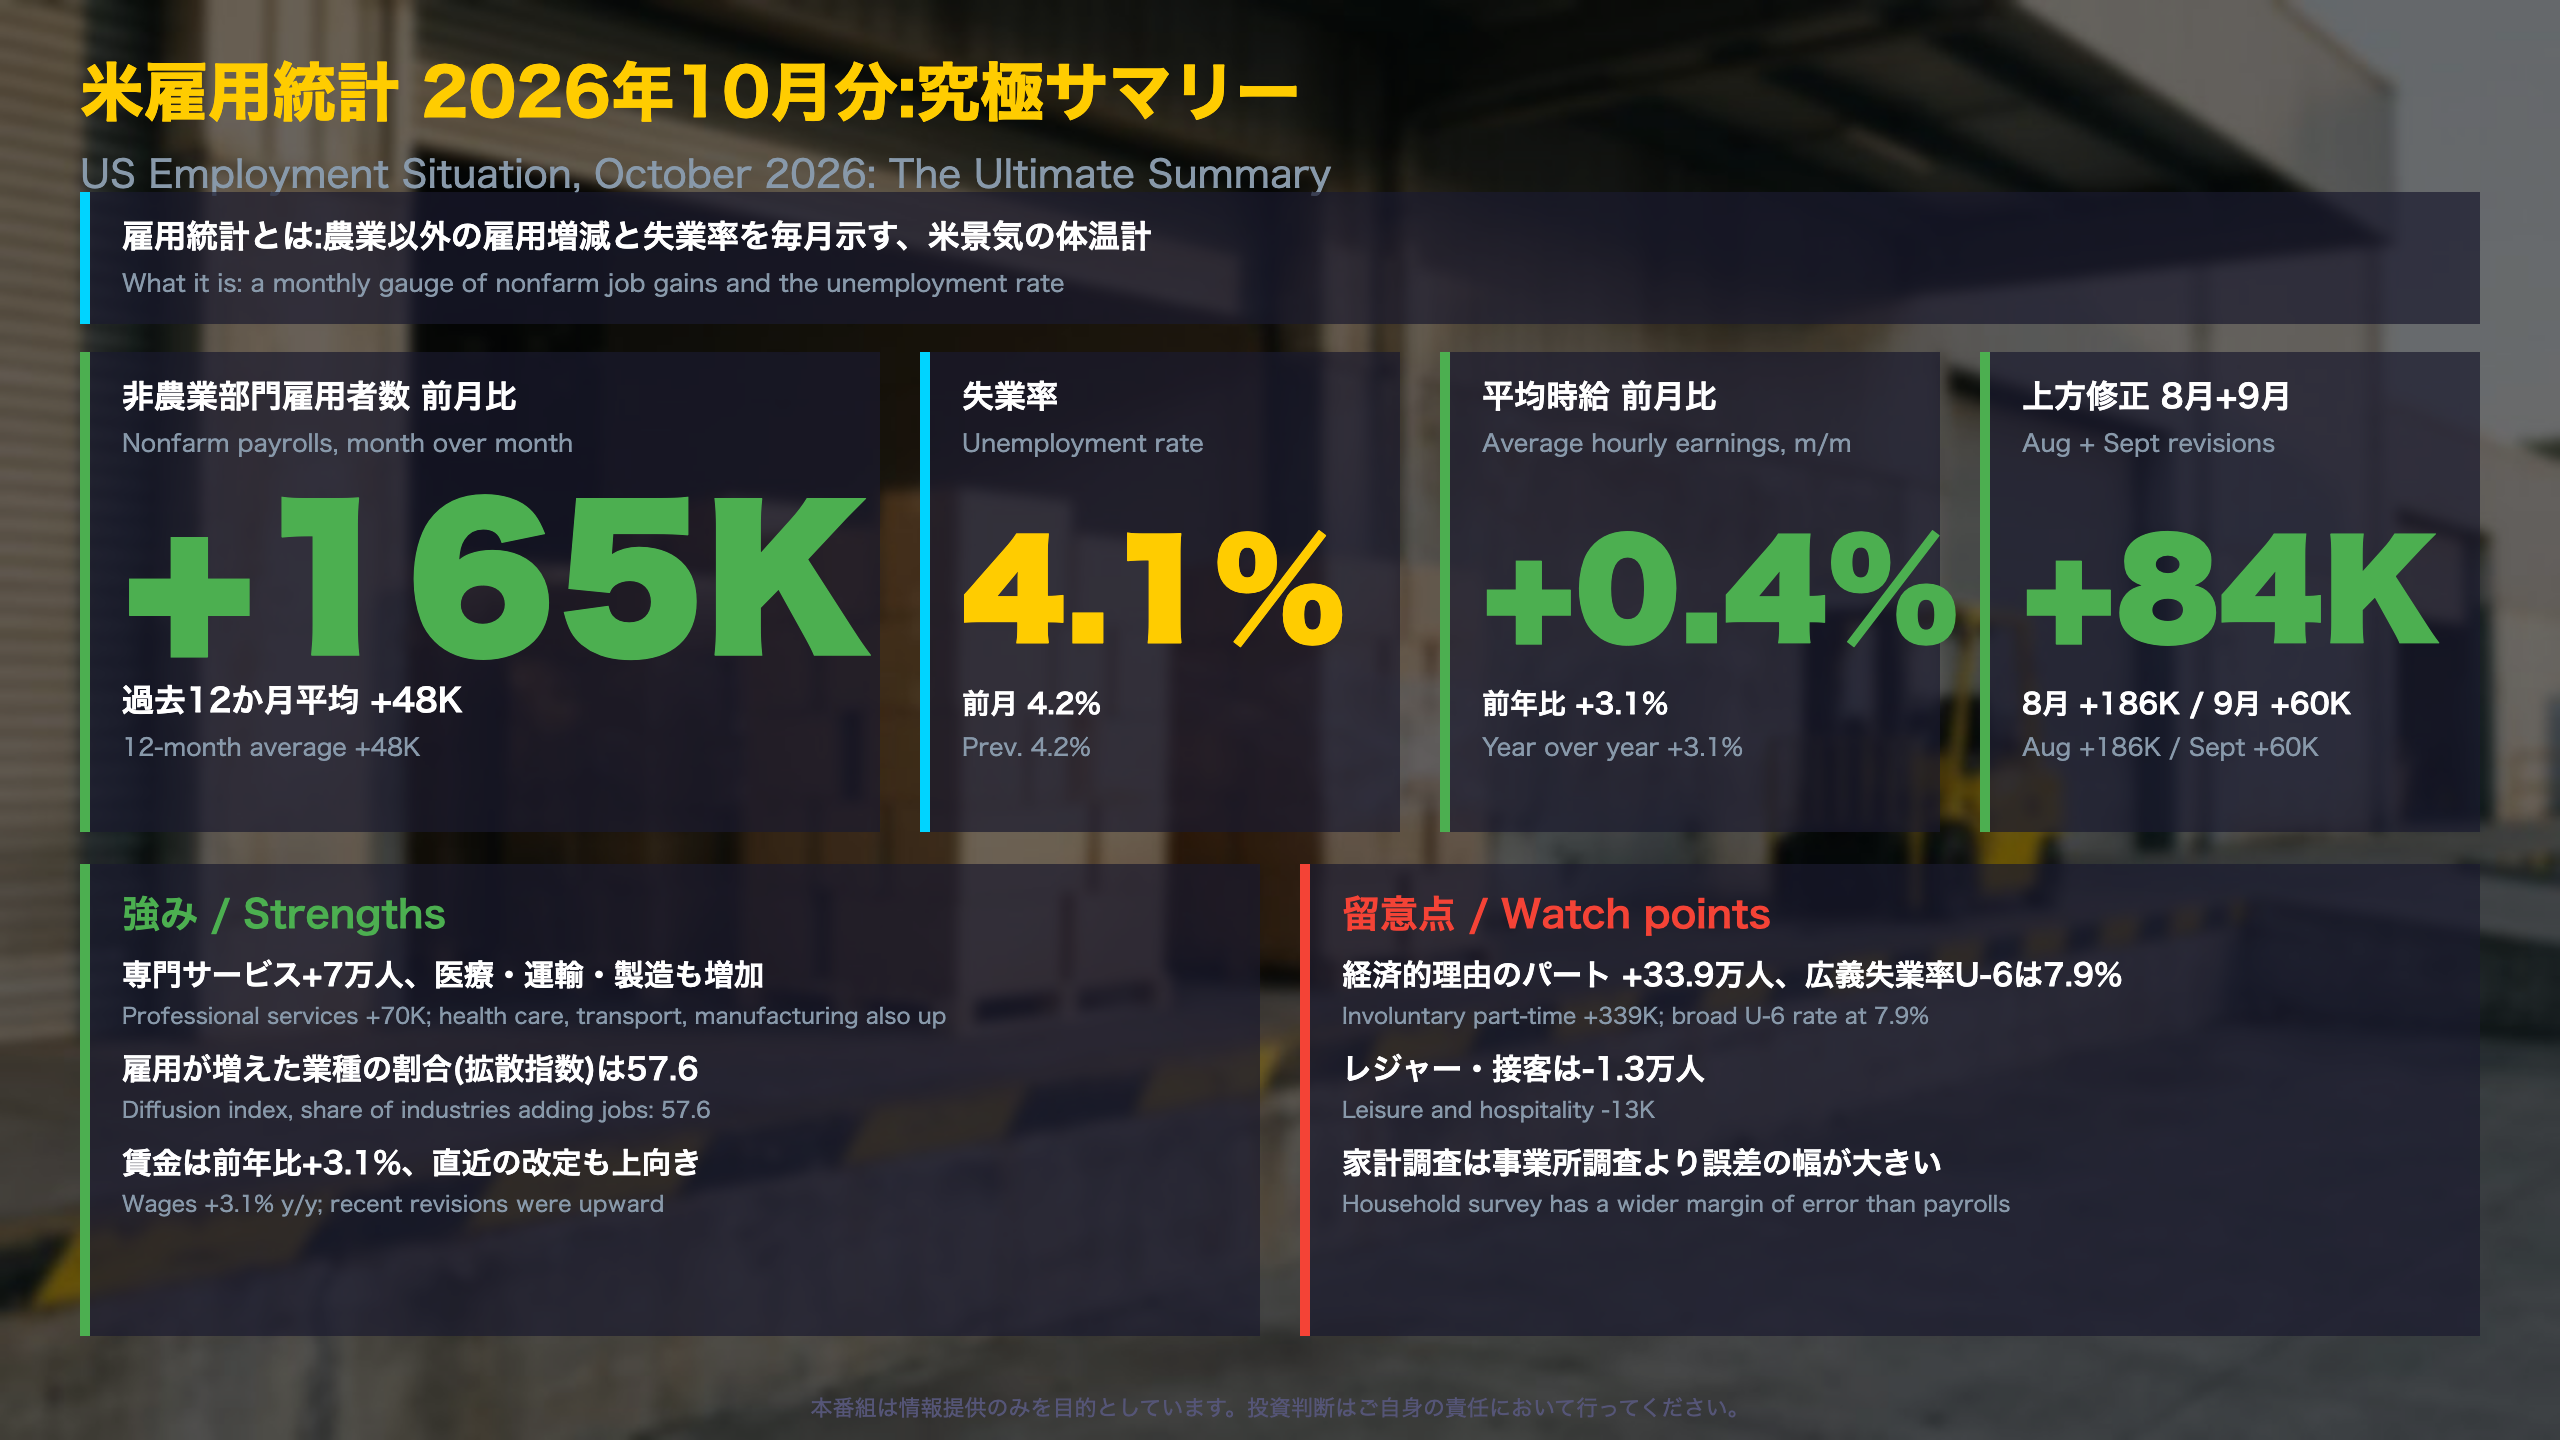
Nonfarm payrolls rose 165,000, well above the 12-month average of 48,000. The unemployment rate was 4.1%.
📈 Gains broadened across professional and business services, health care, transportation and manufacturing, and August and September were revised up by a combined 84,000.
⚠️ On the softer side, involuntary part-time work rose by 339,000 and the broad U-6 rate rose to 7.9%, though the household survey has a wider margin of error.
💡 Next up: the November report on December 4.
究極サマリー:10月米雇用統計
October 2026 US jobs report: the big picture
The Bureau of Labor Statistics (BLS), part of the US Department of Labor, publishes the Employment Situation on the first Friday of most months. It combines two surveys: a payroll (establishment) survey of roughly 119,000 businesses and agencies, and a household survey of about 60,000 households that produces the unemployment rate.
Headline numbers
- Nonfarm payrolls: +165,000 (12-month average: +48,000)
- Unemployment rate: 4.1% (4.2% in September), inside a 4.1%-4.3% band since March
- Revisions: August now +186,000 and September +60,000, a combined +84,000 above earlier estimates
Why it matters internationally
Unlike Japan’s Labour Force Survey, run by the Ministry of Internal Affairs and Communications, the US report pairs a large payroll count with a smaller household survey, and the two can diverge from month to month. The Federal Reserve has a dual mandate of maximum employment and stable prices, so rates and currency markets typically treat this release as a key gauge of the labor side of that mandate.
Balanced read
Breadth across industries and upward revisions are positives. The household survey’s rise in involuntary part-time work is a caution, although that survey is noisier. The next report, for November, is due December 4, 2026.
解説1:増加は複数の業種に広がった
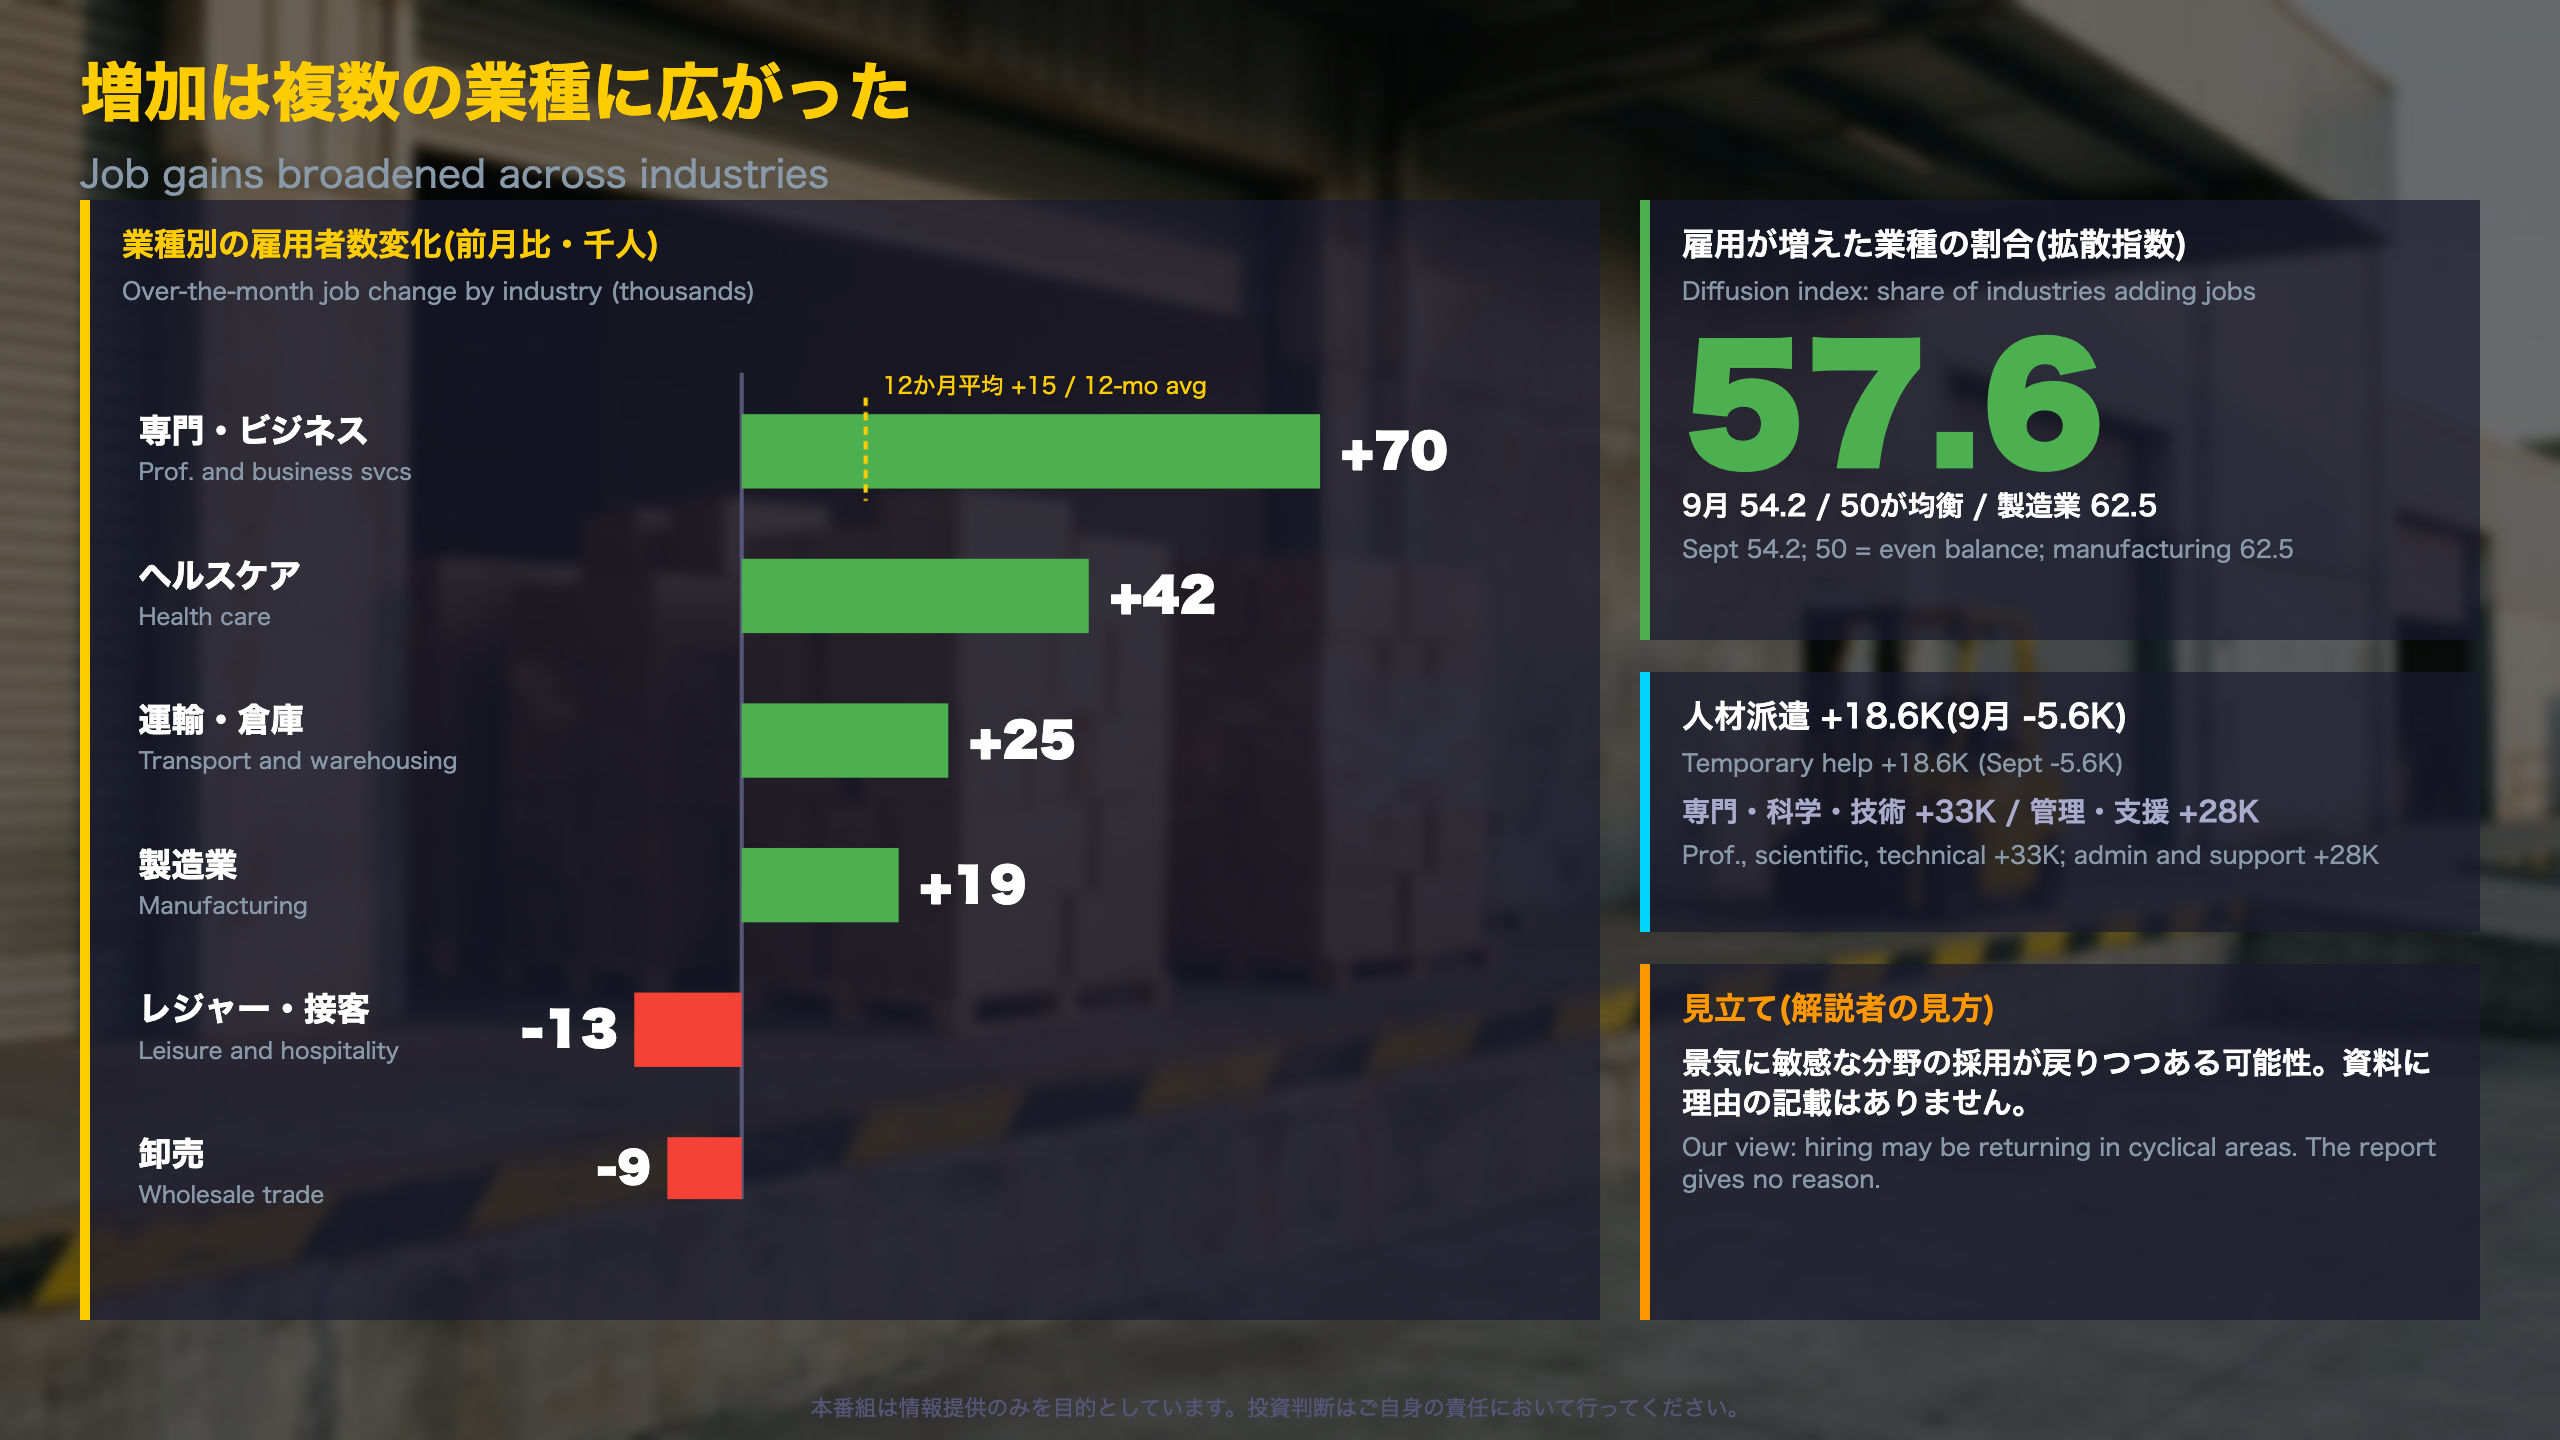
Industry breadth: what sits beneath the headline
Where the jobs came from
- Professional and business services: +70,000 (12-month average: +15,000). Professional, scientific and technical services added 33,000, administrative and support services 28,000, and management of companies 9,000. The sector is up 269,000 since an October 2025 low.
- Health care: +42,000, led by hospitals (+16,000) and home health care (+11,000).
- Transportation and warehousing: +25,000, mostly couriers and messengers (+17,000).
- Manufacturing: +19,000, now +101,000 since a December 2025 low.
Diffusion indexes
The BLS diffusion index counts industries adding jobs, with unchanged industries counting as half. Total private rose to 57.6 from 54.2, and manufacturing to 62.5 from 51.4; a reading of 50 signals an even balance.
The soft spots
Leisure and hospitality (-13,000), wholesale trade (-9,000) and construction (-3,000) slipped, so gains were broad but not universal.
Two readings
Supportive: temporary help rose by 18,600 after a decline in September, which may indicate cyclical hiring returning. Cautious: professional services supplied 70,000 of the 159,000 private-sector gain, so breadth rests partly on one sector.
For non-US readers: unlike Japan’s monthly Labour Force Survey, the US industry detail comes from the payroll survey of businesses rather than from households, and it is seasonally adjusted.
解説2:賃金と労働市場の中身
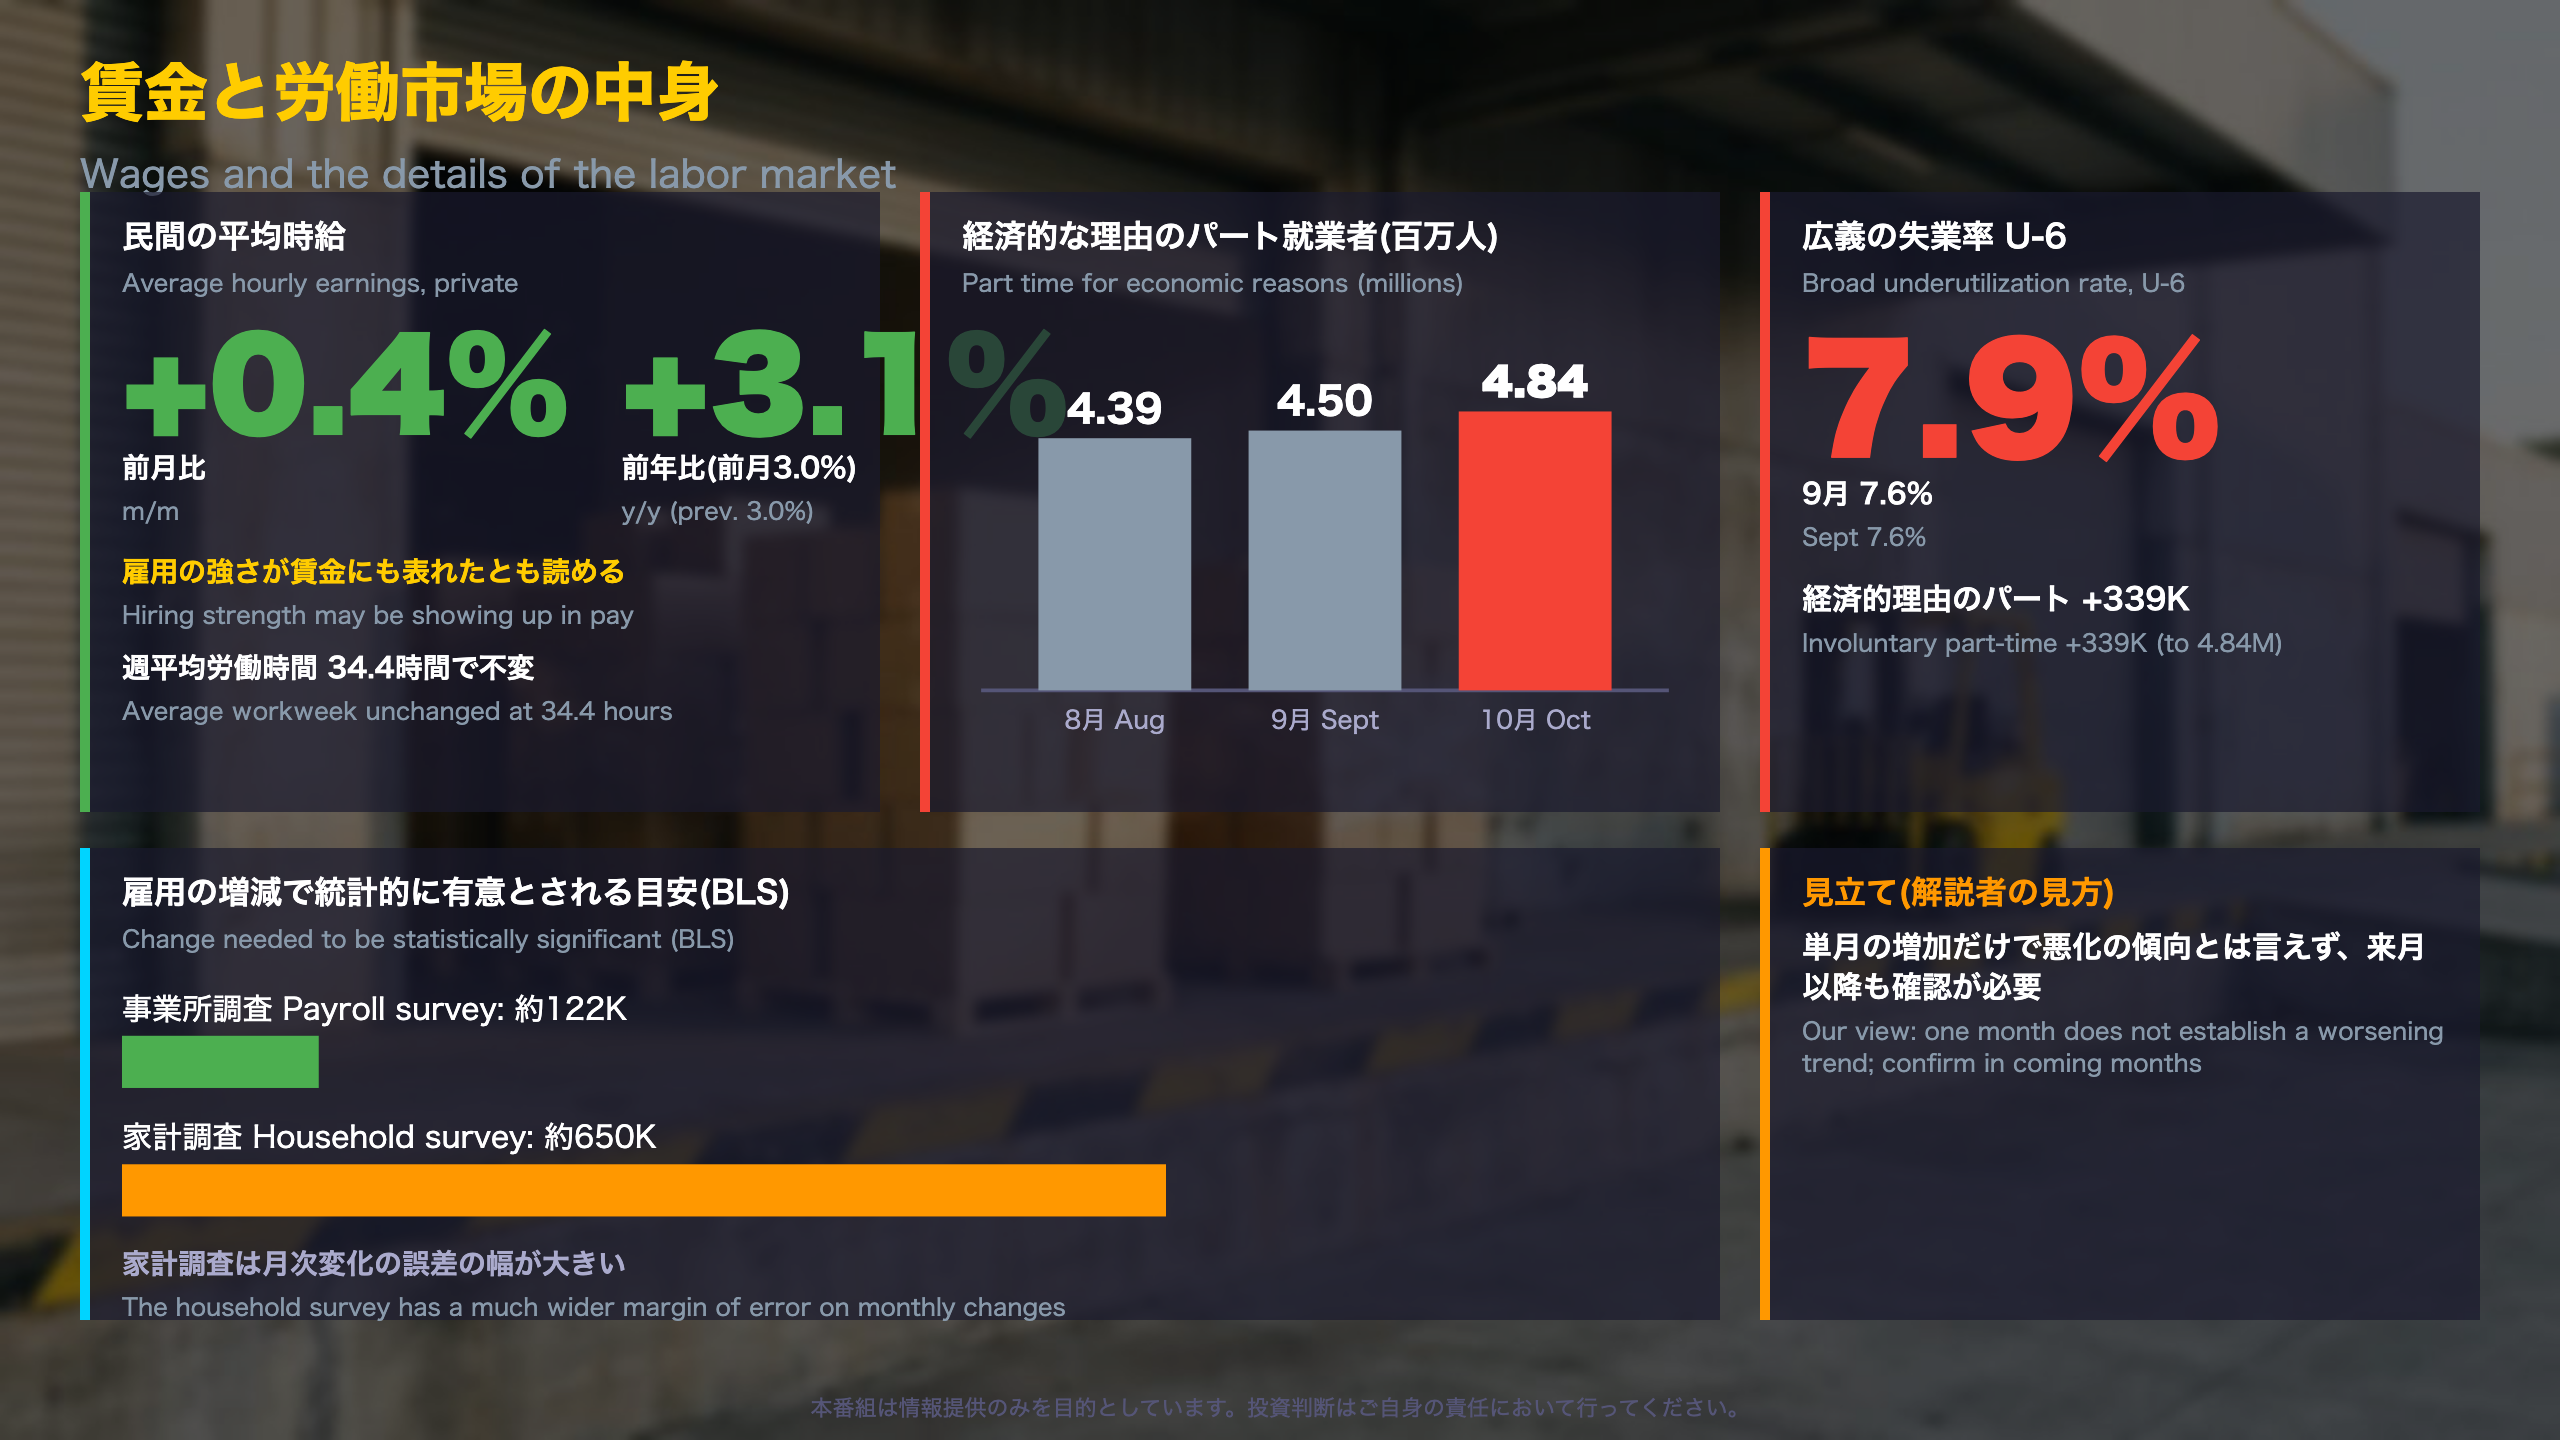
Wages and the household survey’s mixed signals
Pay
Average hourly earnings for all private employees rose 14 cents (0.4%) to $38.00, and are up 3.1% over twelve months (3.0% a month earlier). For production and nonsupervisory workers, the rise was 12 cents to $32.75. The average workweek held at 34.4 hours and the aggregate weekly payroll index rose 0.5%.
Household survey: the good
Employment rose 463,000 and the labor force 421,000, while participation (61.9%) and the employment-population ratio (59.3%) each rose 0.1 percentage point.
Household survey: the soft side
- People working part time for economic reasons: +339,000 to 4.84 million, driven by slack work or business conditions (+356,000).
- The broad U-6 underutilization rate: 7.9% versus 7.6%.
- Long-term unemployed: 1.96 million, 27.6% of all unemployed.
Why caution is warranted
The BLS notes that a monthly change in household employment must be about 650,000 to be statistically significant, versus about 122,000 for payrolls. The part-time increase is a smaller move than that benchmark, so it may include month-to-month noise.
Context
Japan’s headline labor measure is a single unemployment rate, whereas the US publishes six alternative measures, U-1 to U-6, every month. Investors tracking the Fed’s employment mandate often read wage growth and U-6 together.
質疑で深める:単月の振れか、上向きの傾向か
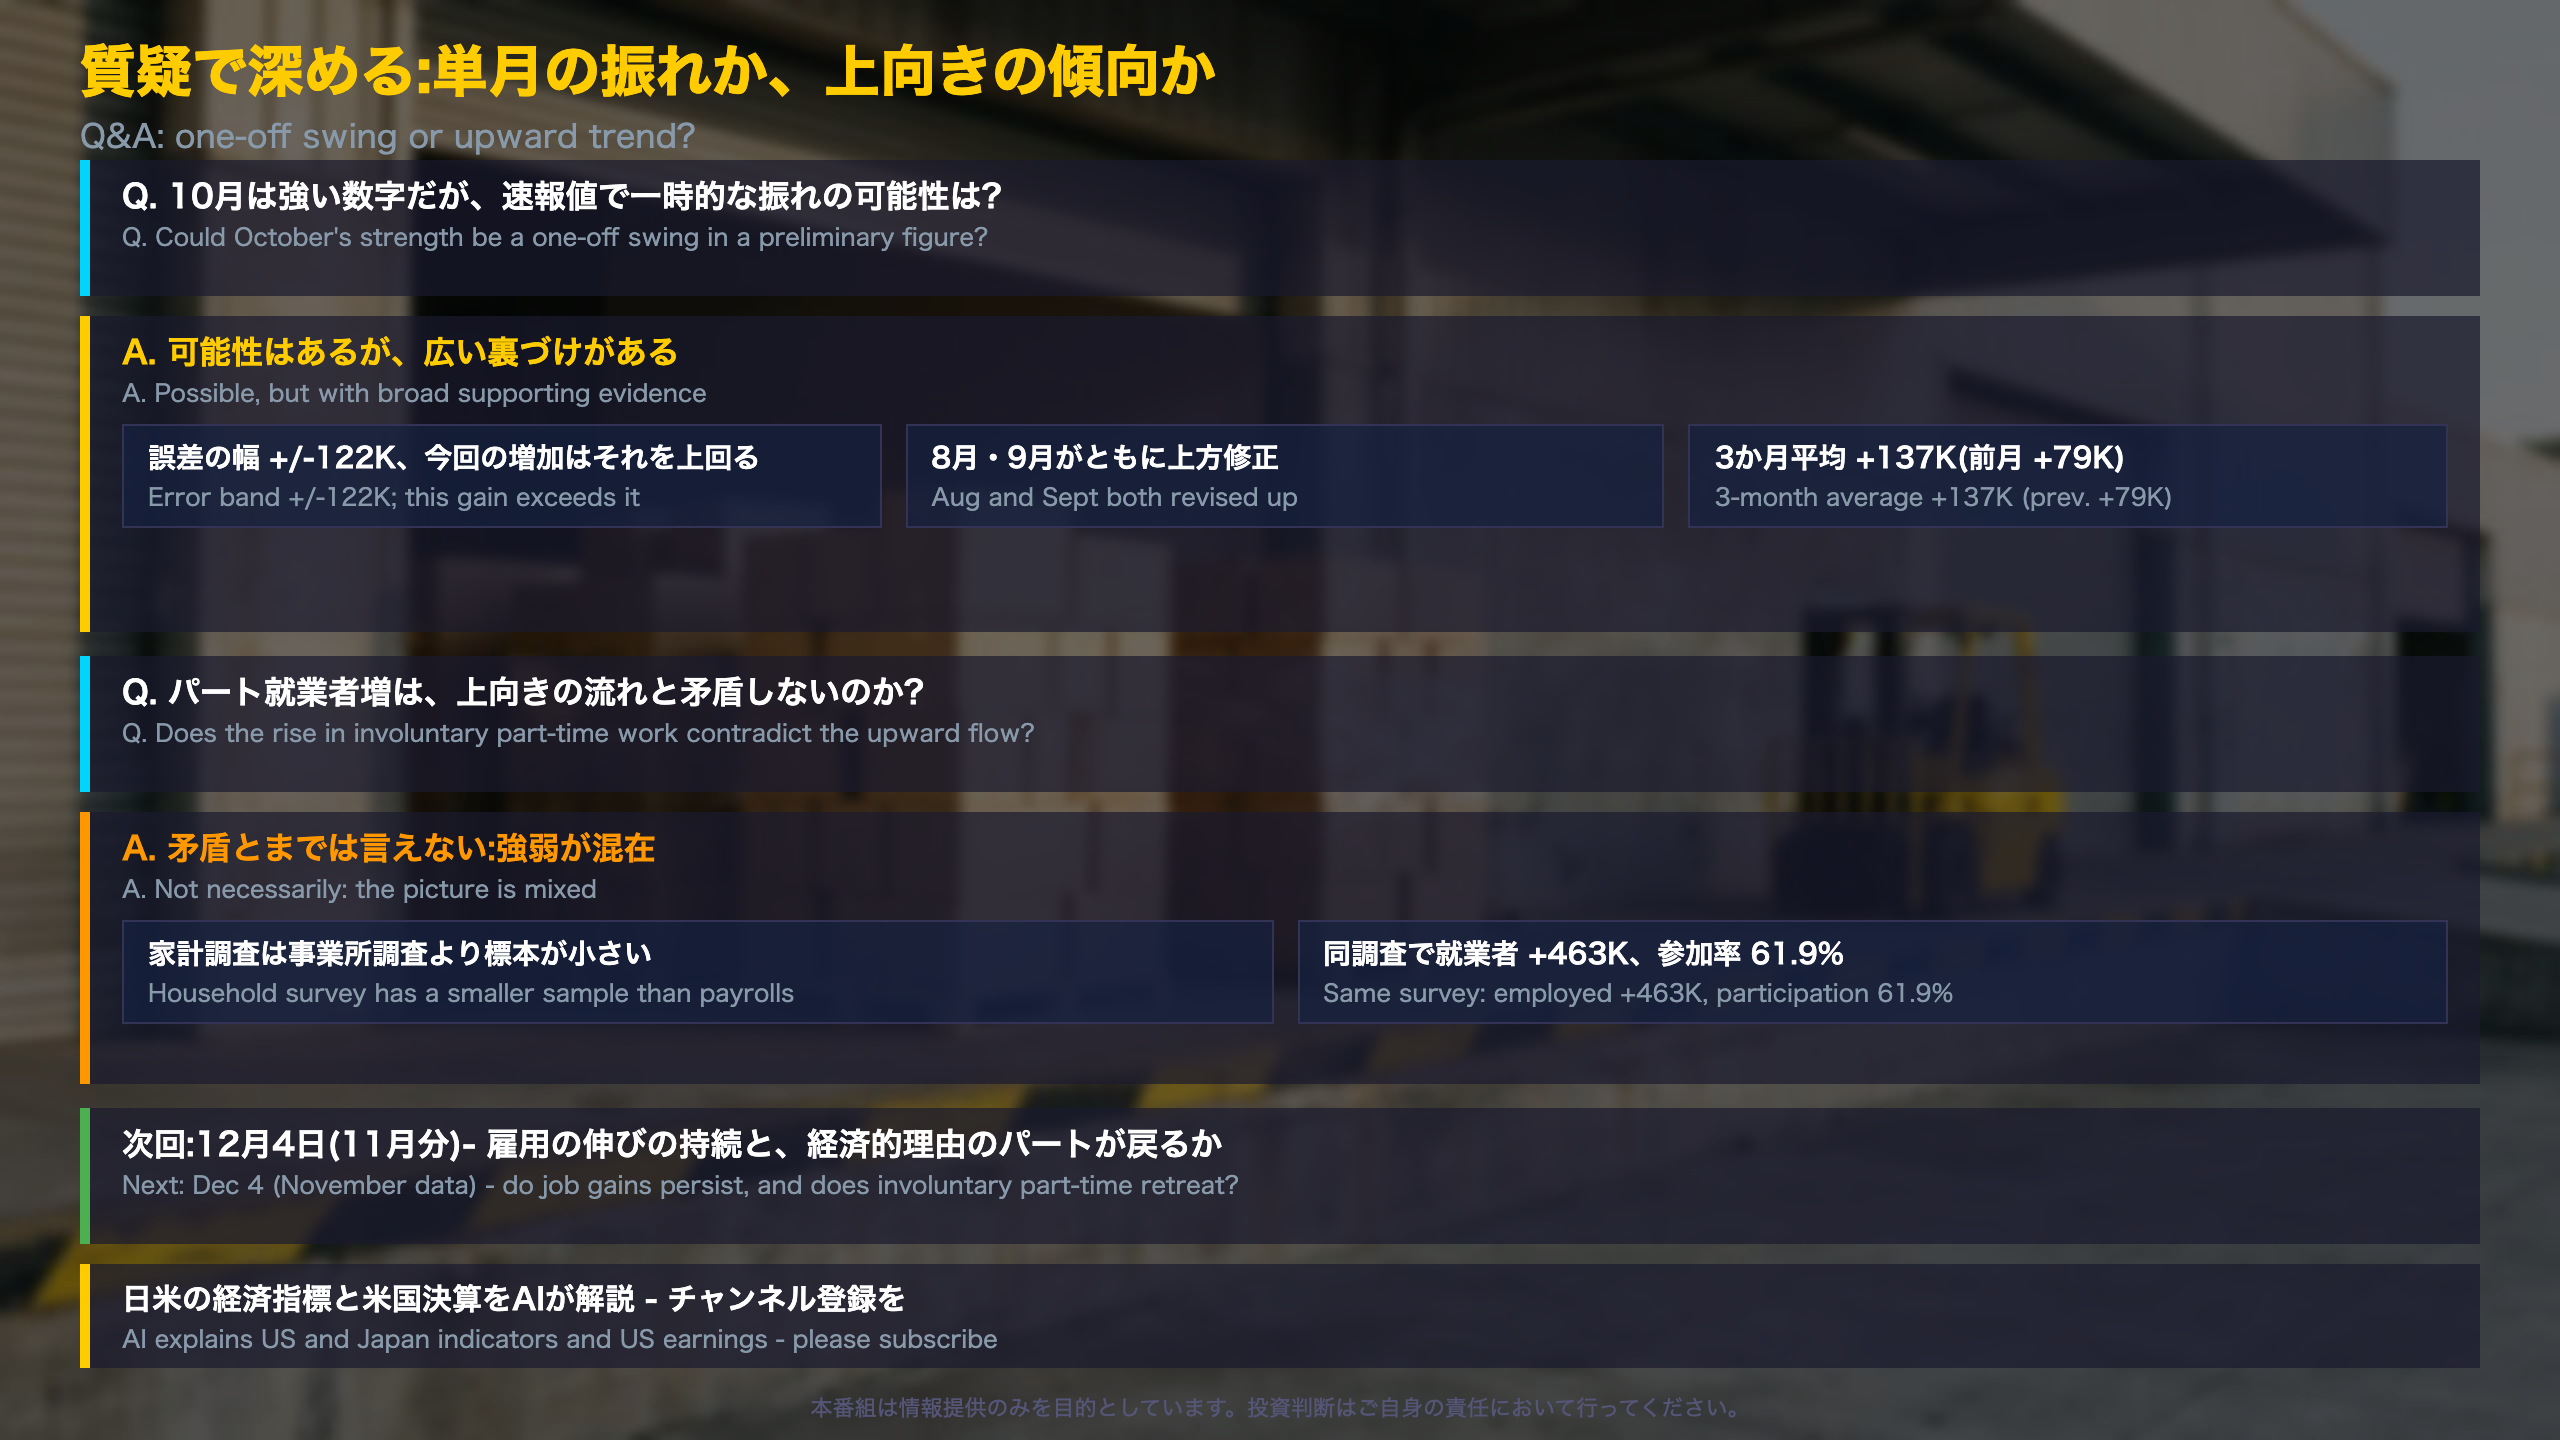
Q&A background: revisions and margins of error
Three-month average
The payroll survey’s three-month average gain rose to 137,000 from 79,000 in the September reading (69,000 for August), after a figure of -45,000 for October 2025.
Applying the margin of error
The BLS says the 90% confidence interval on a monthly payroll change is about plus or minus 122,000. Applied to +165,000, the range runs from roughly +43,000 to +287,000, staying above zero. The figure is still preliminary and will be revised twice.
Revision pattern
August moved from +133,000 to +186,000 and September from +29,000 to +60,000, a combined +84,000. The prior release revised July and August down by 60,000 combined, so the direction changed this time.
Reading both sides
- Supportive: revisions and the three-month average point the same way.
- Cautionary: involuntary part-time work rose and leisure and hospitality fell, though the household survey is noisier.
What to watch
The November report is due December 4, 2026, at 8:30 a.m. ET: whether payroll gains persist, whether involuntary part-time work retreats, and whether unemployment stays inside its 4.1%-4.3% range. For non-US readers, this is the US counterpart to Japan’s monthly labor data, built on a much larger payroll survey.
Disclaimer: This article is for informational purposes only. All investment decisions are made solely at your own risk.