📺 Watch the Full Video Analysis
This article was automatically generated by the NFC Market Live AI analysis system. (Updated: 2026-11-04 00:19 JST)
📄 Primary Source
U.S. Census Bureau
https://www.census.gov/manufacturing/m3/prel/pdf/s-i-o.pdf
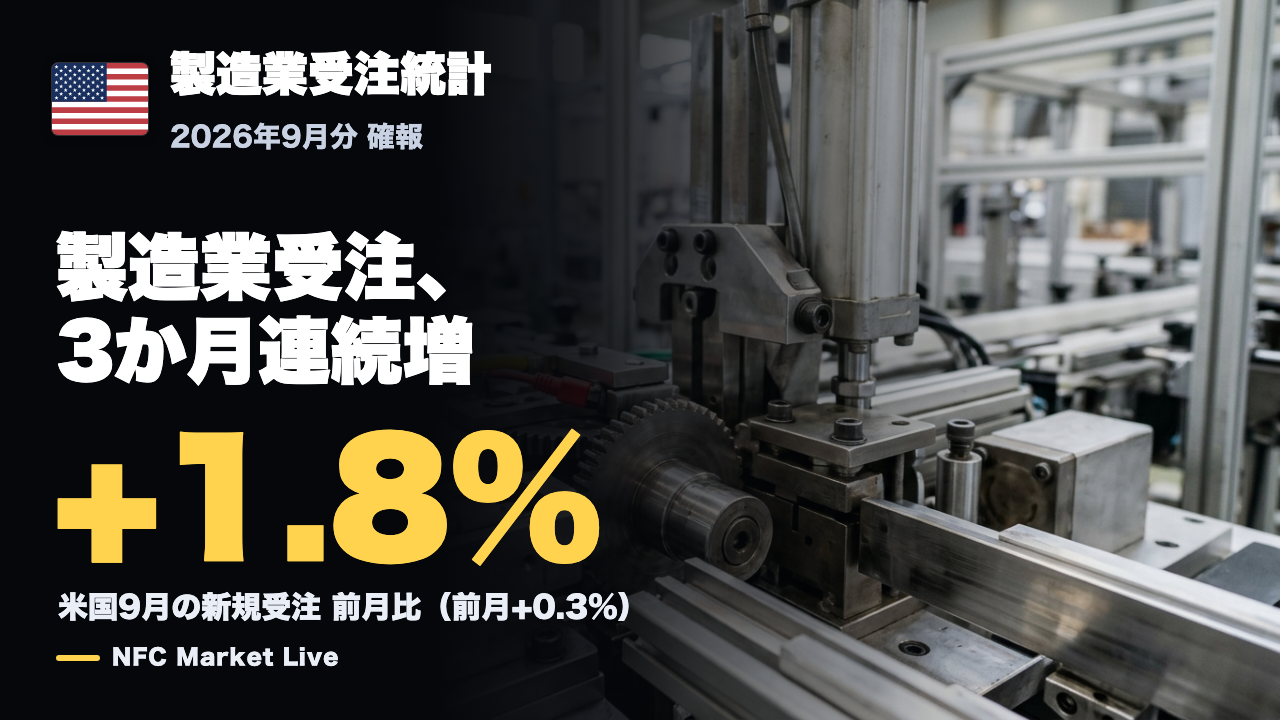
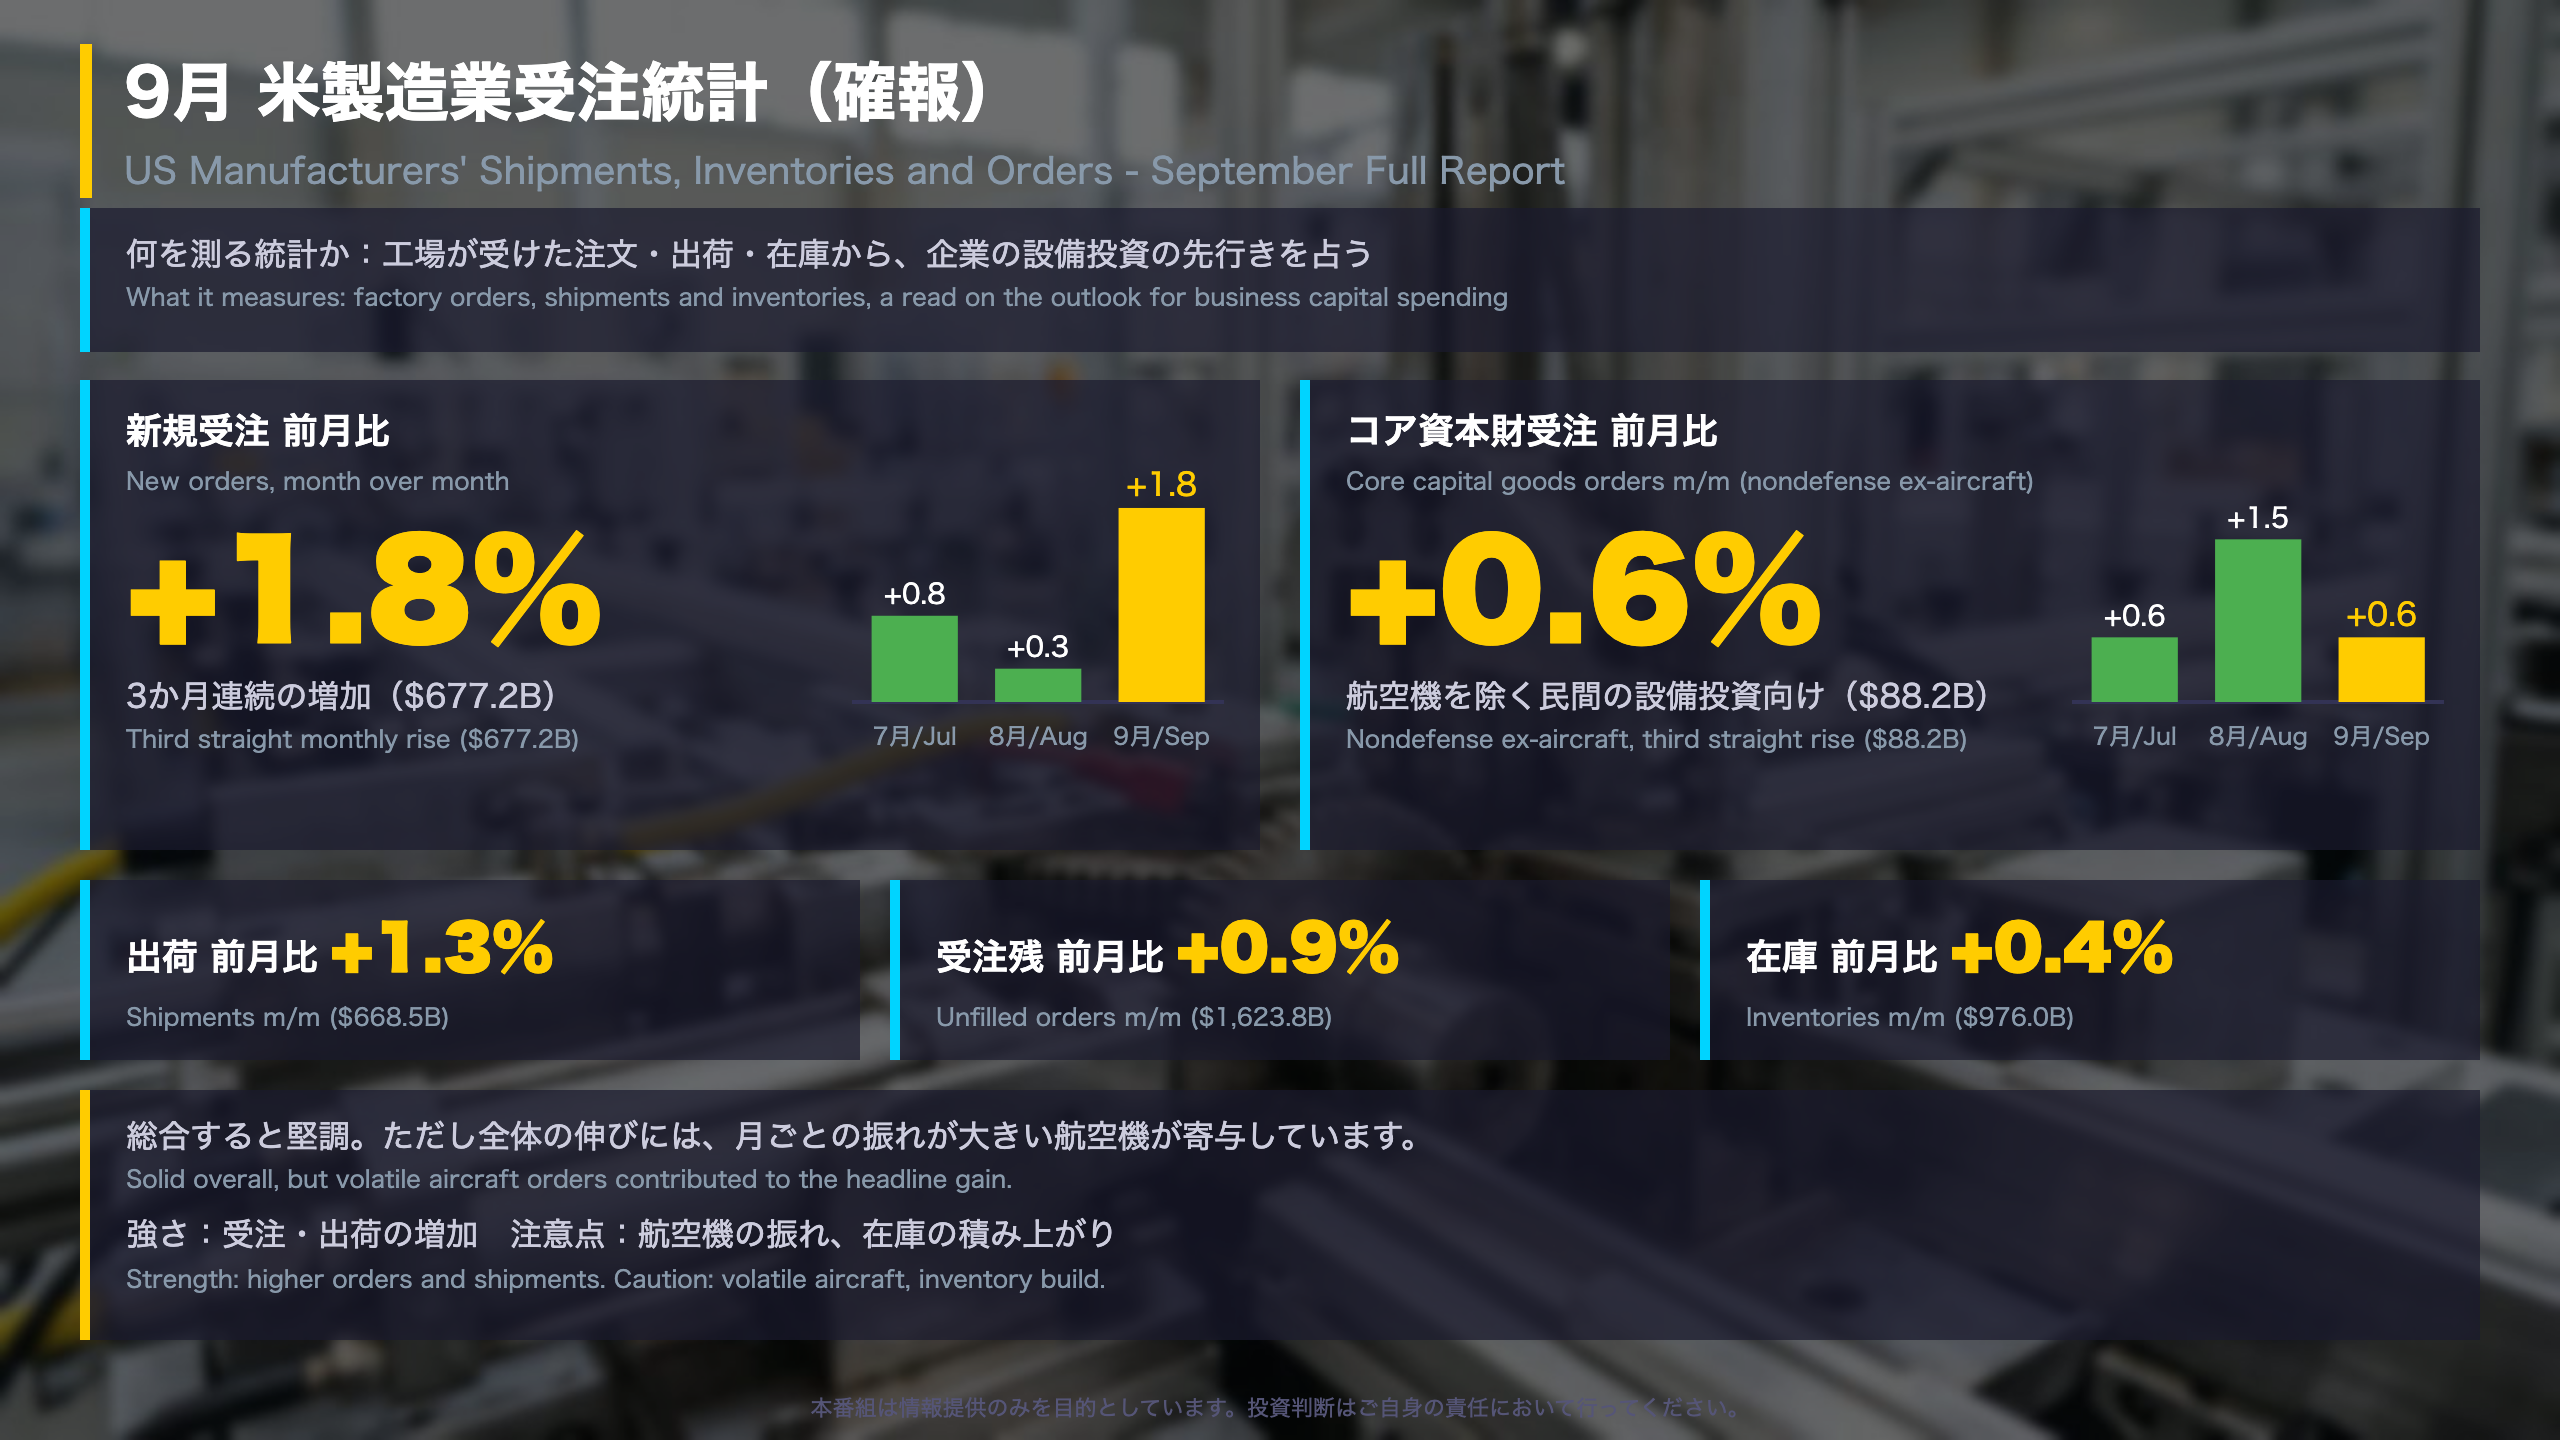
📊 The US Census Bureau’s September manufacturers’ report (full release, Nov 3): new orders rose 1.8% to $677.2B, a third straight monthly gain.
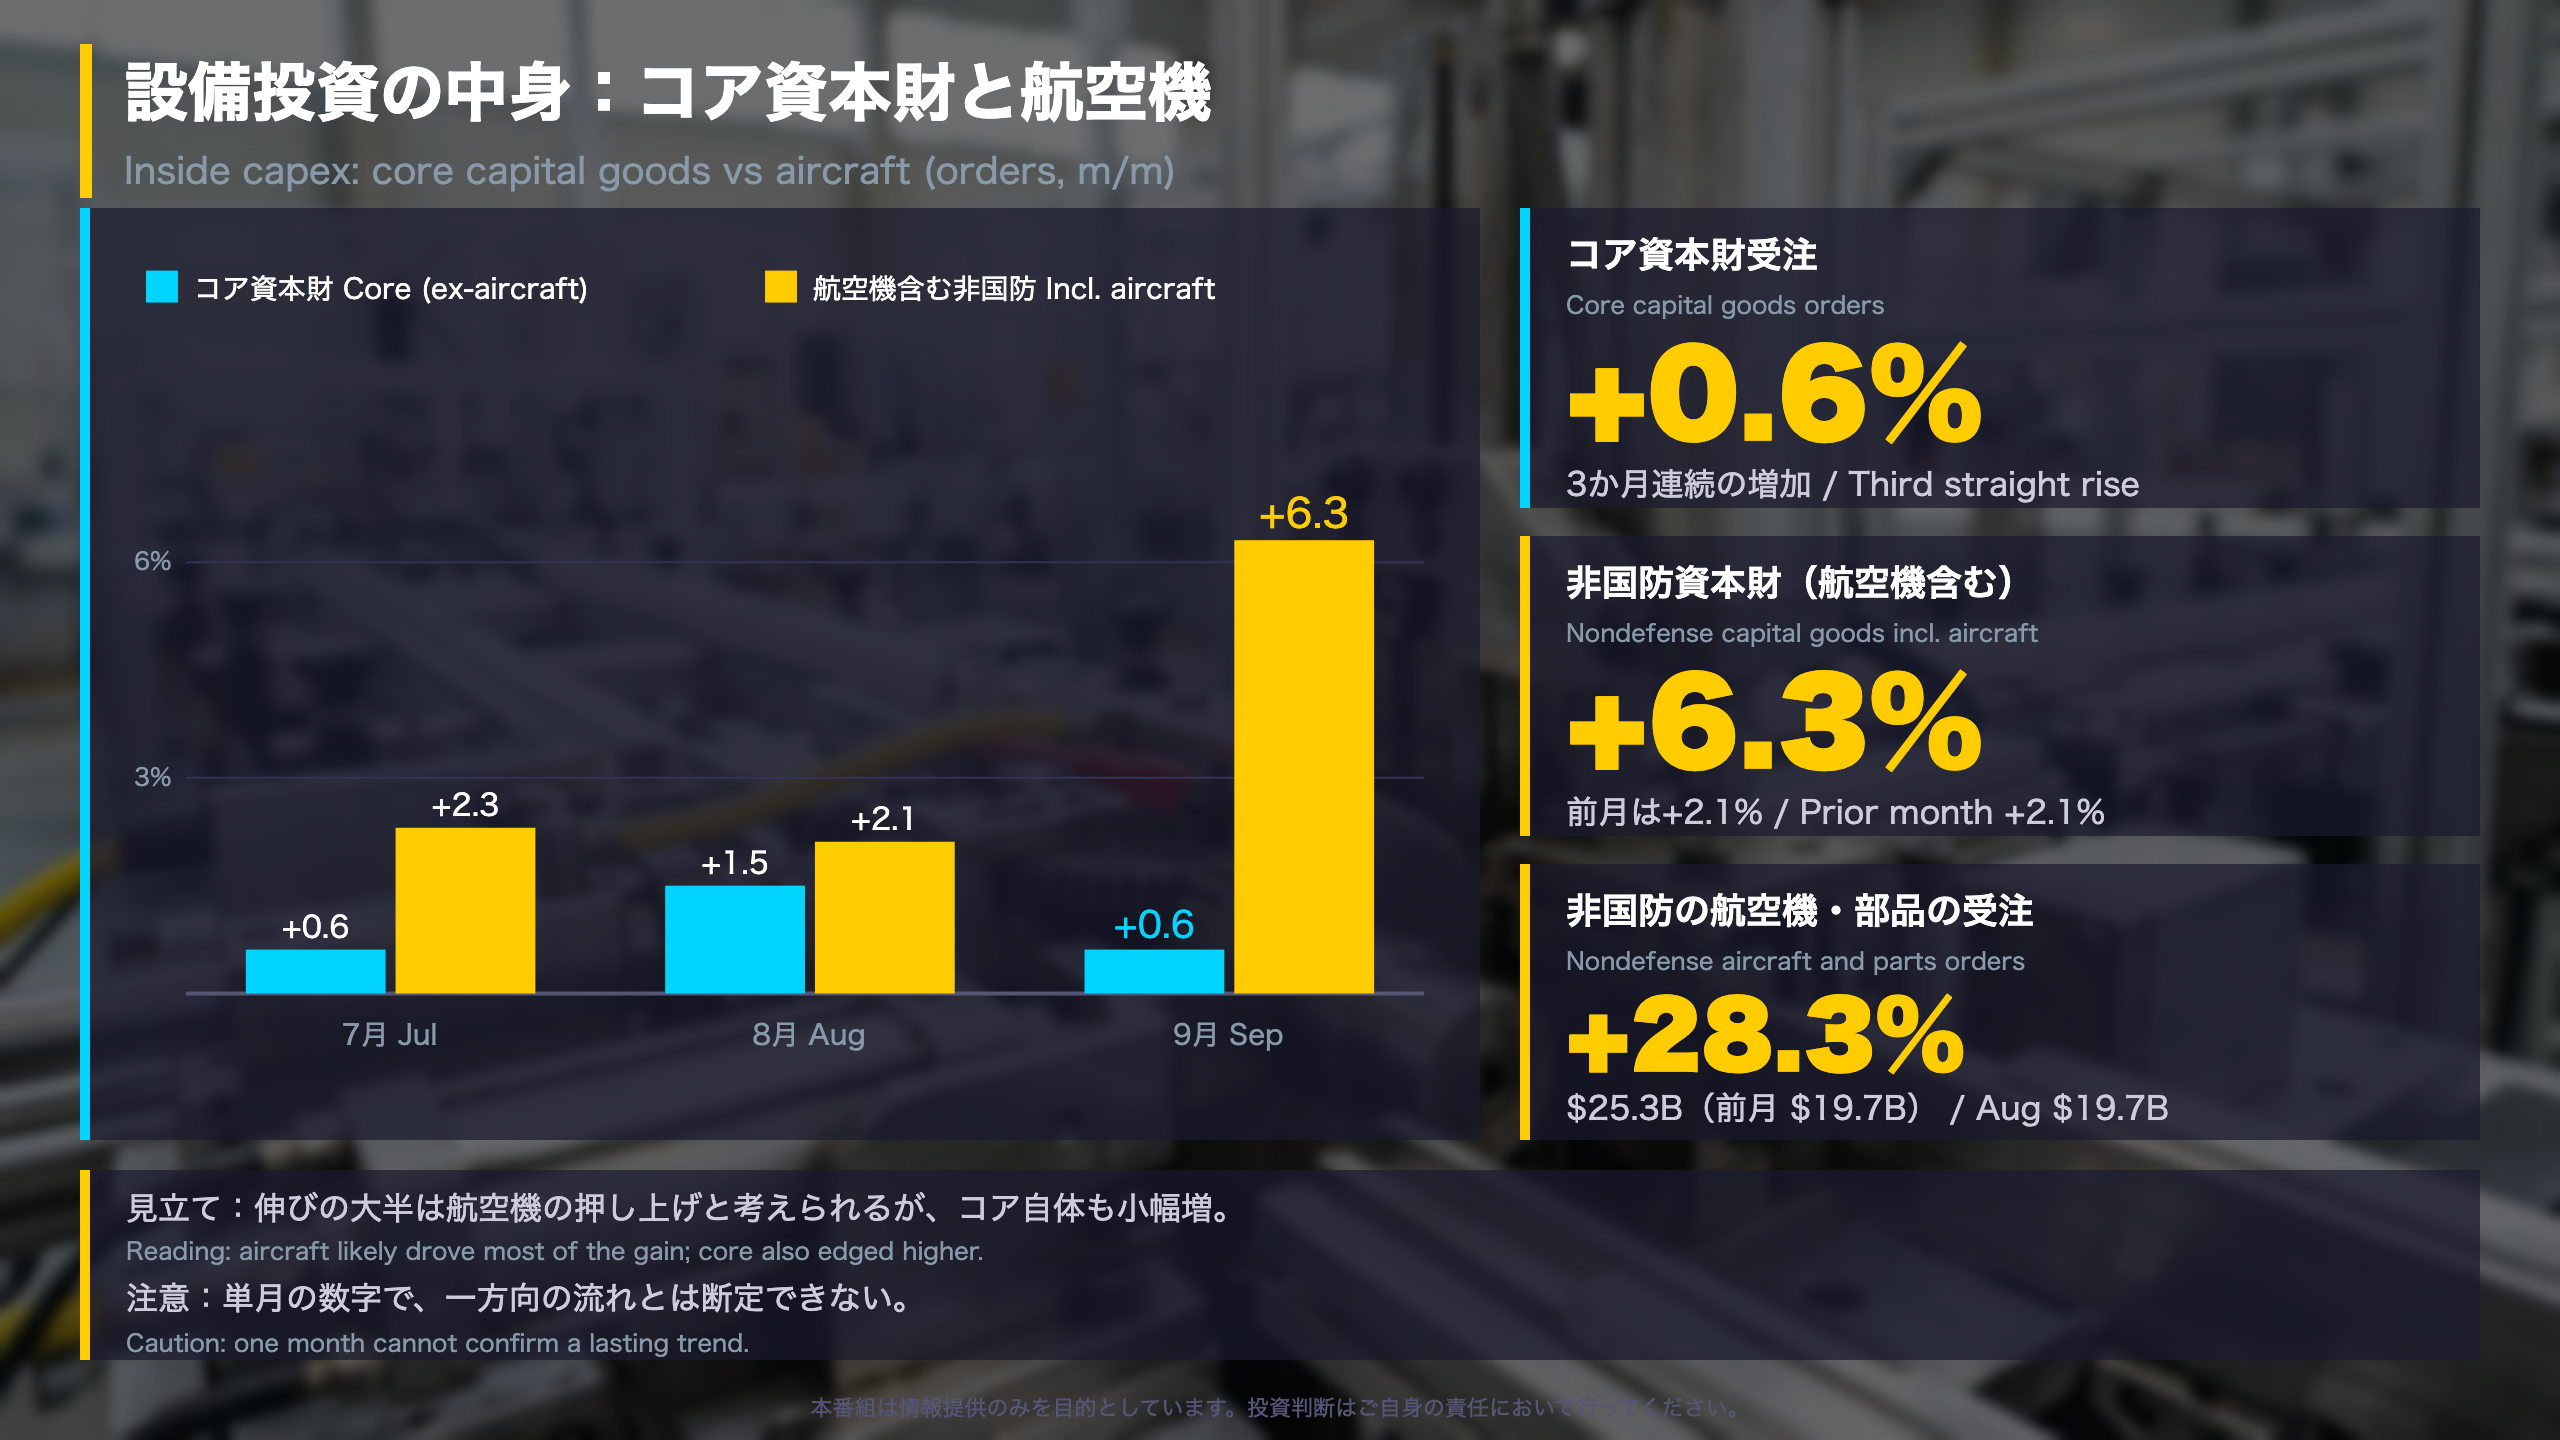
📈 Core capital goods orders (nondefense excluding aircraft), a proxy for private equipment spending, rose 0.6% for a third straight increase. Shipments grew 1.3%.
⚠️ Nondefense capital goods including aircraft jumped 6.3%, so the headline is lifted by volatile aircraft orders. Defense capital goods fell 1.9% and inventories have risen twelve months in a row.
💡 A report with both resilience and caveats. Next: the October advance report on Nov 25 and the full report on Dec 3.
サマリー:9月の米製造業受注統計(確報)
What the September Manufacturers’ Orders Report Measures
The Census Bureau’s M3 survey (Manufacturers’ Shipments, Inventories and Orders) is built from a panel of roughly 4,700 reporting units. It is not a probability sample, so sampling error cannot be calculated; figures are in nominal dollars and are revised. The advance durable goods report comes first (October’s is due November 25), while the full report, released today, adds nondurables, shipments, backlogs and inventories.
Headline readings
- New orders: $677.2B, +1.8% (August revised to +0.3%)
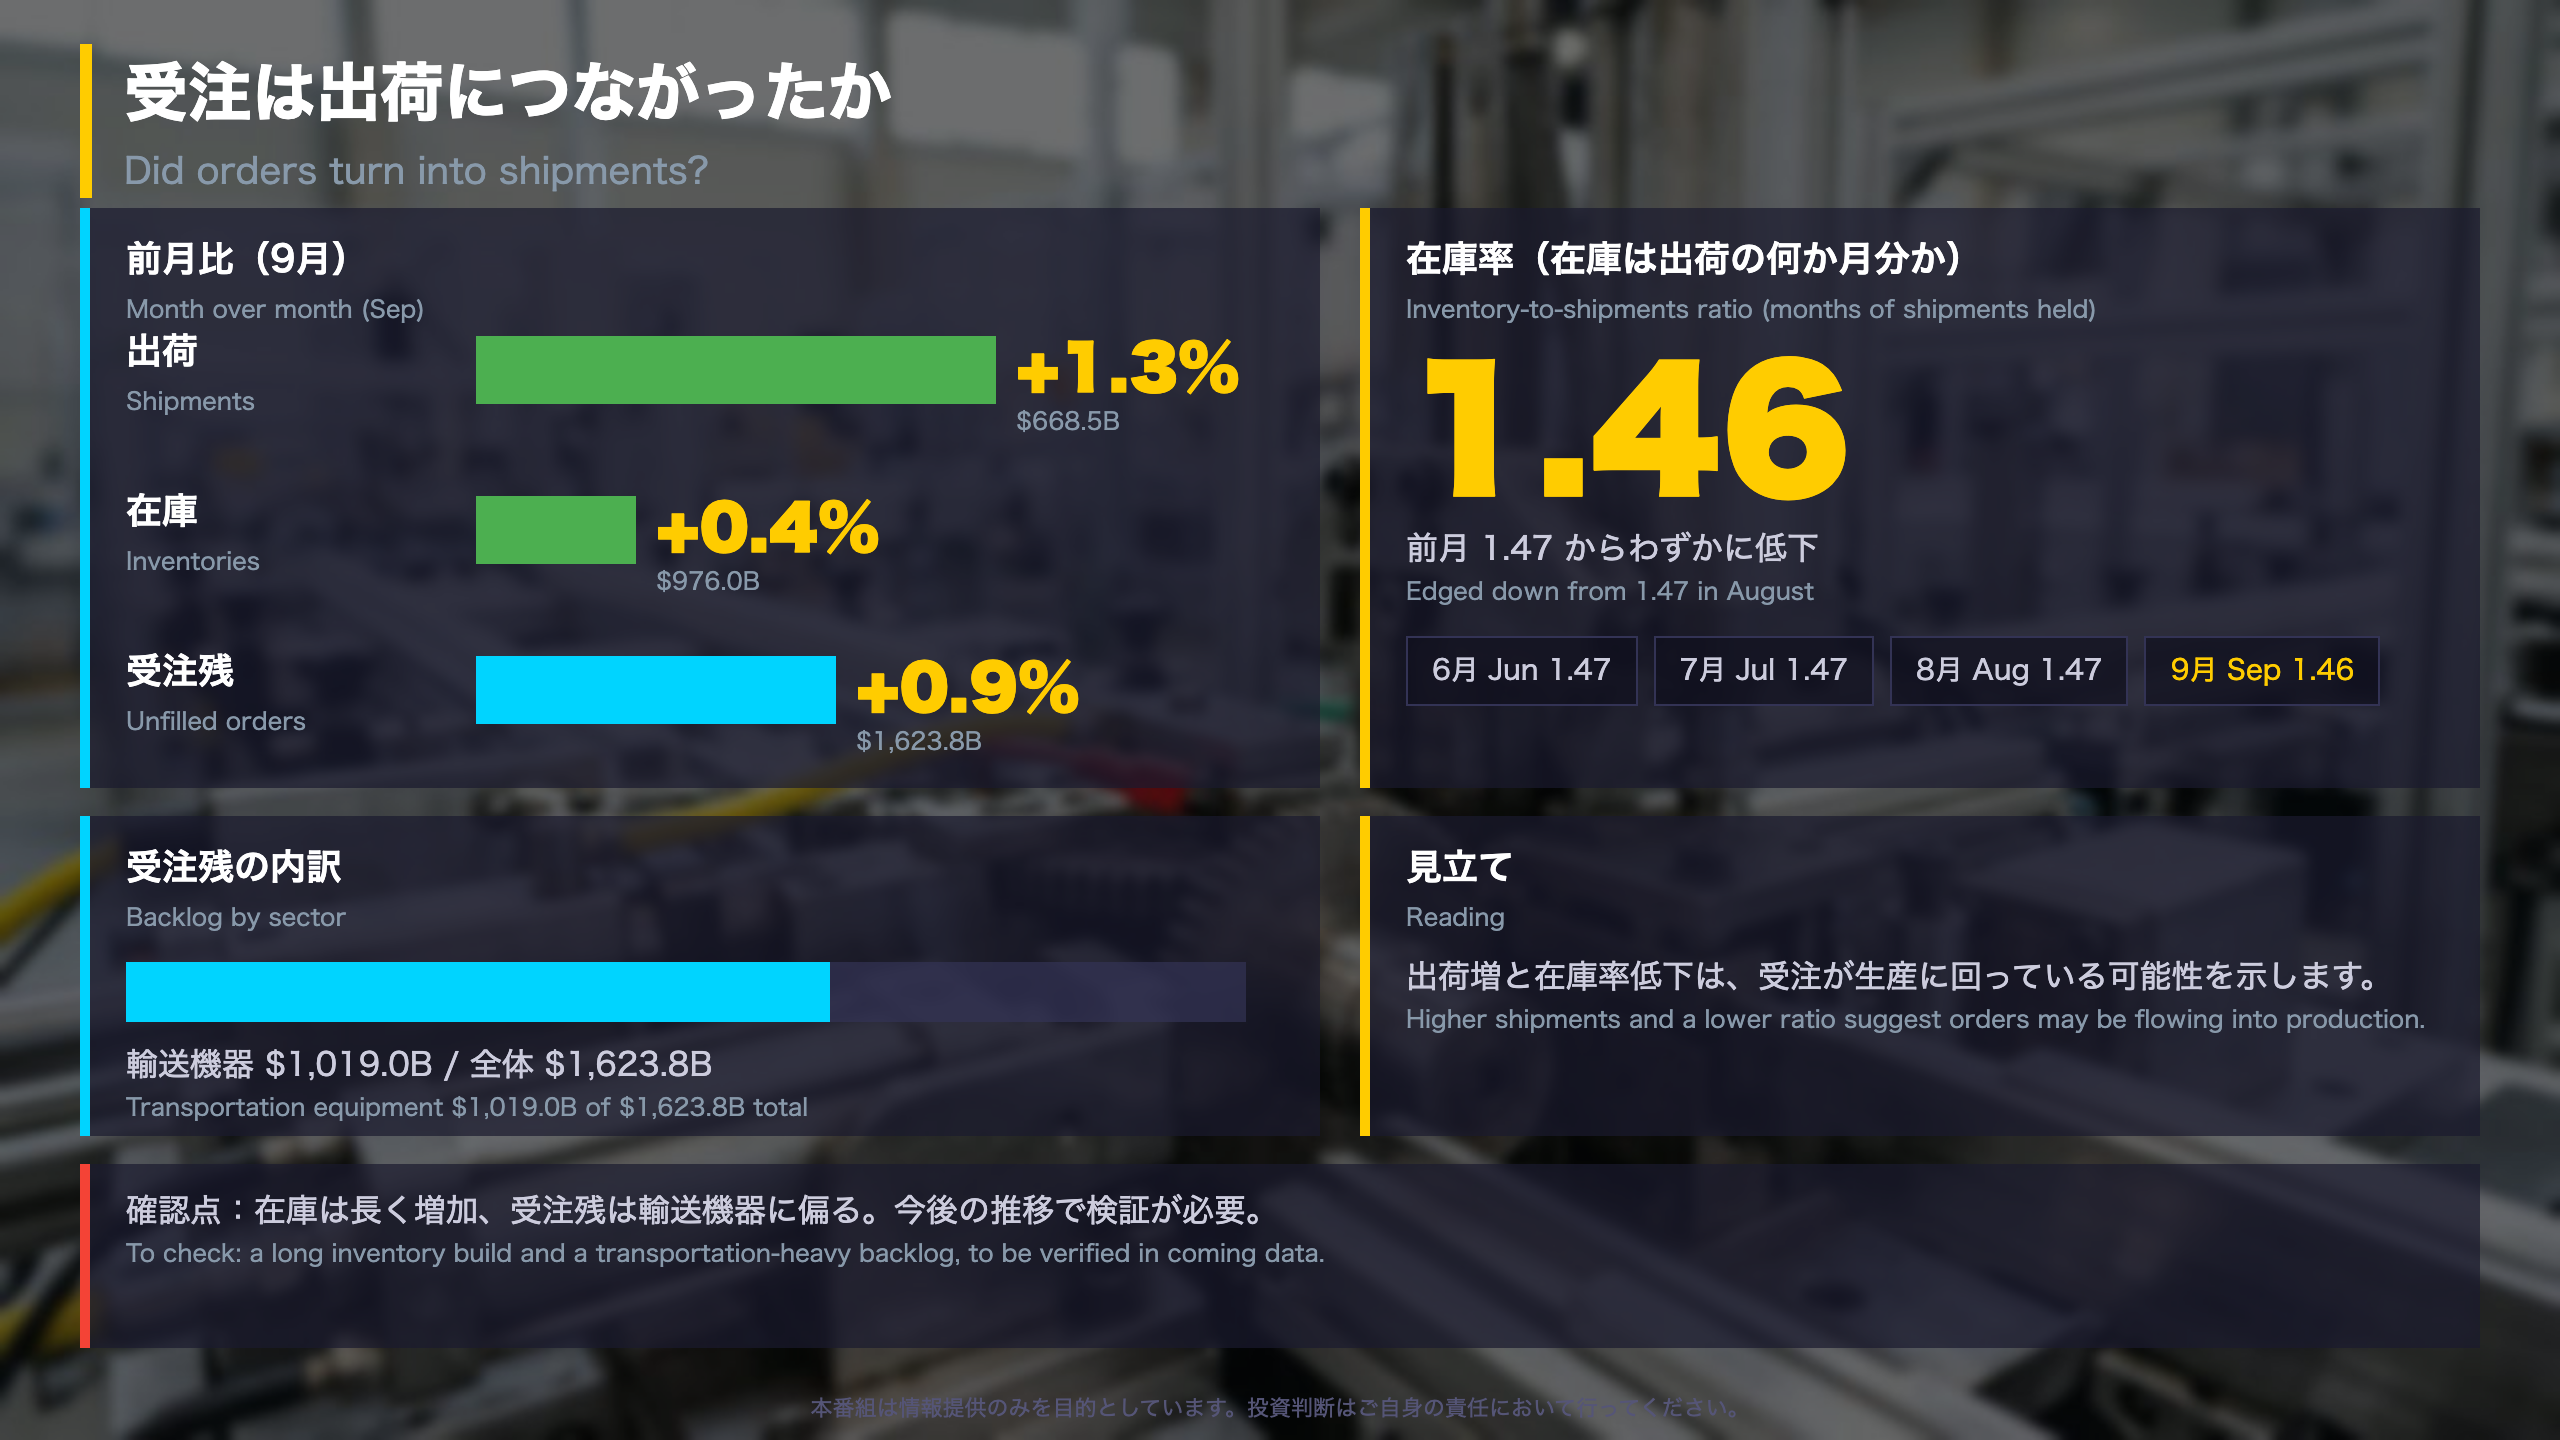
- Shipments: $668.5B, +1.3%
- Unfilled orders: $1,623.8B, +0.9%
- Inventories: $976.0B, +0.4%; inventory-to-shipments ratio 1.46 vs 1.47
Why it matters beyond the US
For readers used to the Fed’s data flow, this report feeds the equipment-investment picture that sits alongside industrial production and ISM surveys. Japan’s closest counterpart is the Cabinet Office’s machinery orders series, which similarly strips out volatile items (ships and electric power) to isolate private demand; the equivalent filter here is core capital goods, which excludes defense and aircraft.
Balanced read
The breadth is encouraging: orders, shipments and backlogs rose together and the inventory ratio eased. The caveats are that part of the headline reflects aircraft, inventories have risen for twelve straight months, and the survey excludes semiconductors from orders data. The October advance report is the next check.
深掘り1:コア資本財とヘッドラインの差
Core Capital Goods: Reading Through the Aircraft Noise
Core capital goods orders (nondefense capital goods excluding aircraft) are the series analysts use as a proxy for private business equipment spending, because aircraft orders can swing by double digits in a single month.
| Series (m/m) | Jul | Aug | Sep |
|---|---|---|---|
| Core capital goods | +0.6% | +1.5% | +0.6% |
| Nondefense capital goods | +2.3% | +2.1% | +6.3% |
| Defense capital goods | -6.4% | -3.2% | -1.9% |
Nondefense aircraft and parts orders rose 28.3% to $25.3B in September after a 0.3% increase in August and 12.0% in July. In the Census Bureau’s words, transportation equipment, up two of the last three months, led the increase.
Two readings
- Constructive: core orders have risen three months running, and core shipments gained 1.2%, a figure often used to track equipment spending.
- Cautious: September’s 0.6% is smaller than August’s 1.5%, and the 6.3% headline for nondefense capital goods overstates the underlying pace. The data are nominal and exclude semiconductors from new orders.
What to watch
If aircraft orders fall back in October, the gap between the broad and core measures would narrow mechanically; the test is whether core orders stay positive for a fourth month.
深掘り2:受注は出荷につながったか
Shipments, Inventories and Backlogs: Did Orders Turn Into Output?
Shipments rose 1.3% to $668.5B and, in the Census Bureau’s words, are up eleven of the last twelve months. Durable goods shipments gained 0.9% and nondurables 1.8%, led by petroleum and coal products (+5.2%).
| Ratio | Jun | Jul | Aug | Sep |
|---|---|---|---|---|
| Inventories-to-shipments (all manufacturing) | 1.47 | 1.47 | 1.47 | 1.46 |
| Unfilled orders-to-shipments (durables) | 6.84 | 6.81 | 6.86 | 6.84 |
Inventories
Inventories rose 0.4% to $976.0B, the twelfth straight increase and +3.2% year on year. Within durables, work in process rose 0.5% and materials 0.4%, while finished goods were virtually unchanged, suggesting the build is not concentrated in unsold finished product.
Backlogs
Unfilled orders reached $1,623.8B (+0.9% m/m, +9.0% y/y). Transportation equipment holds $1,019.0B, over 60% of the total, so backlog strength is partly a story about aircraft and vehicles.
Two readings
- Positive: shipments outpaced inventories and the ratio slipped, consistent with orders feeding production.
- Cautious: a long inventory build and a transportation-heavy backlog warrant monitoring; the 12-month average revision to new orders is 0.2 points, so figures will move.
Next data: the October advance report on November 25.
質疑で深める:国防・改定・次の注目点
Q&A Follow-Up: Defense, Revisions and the Road Ahead
Defense drag
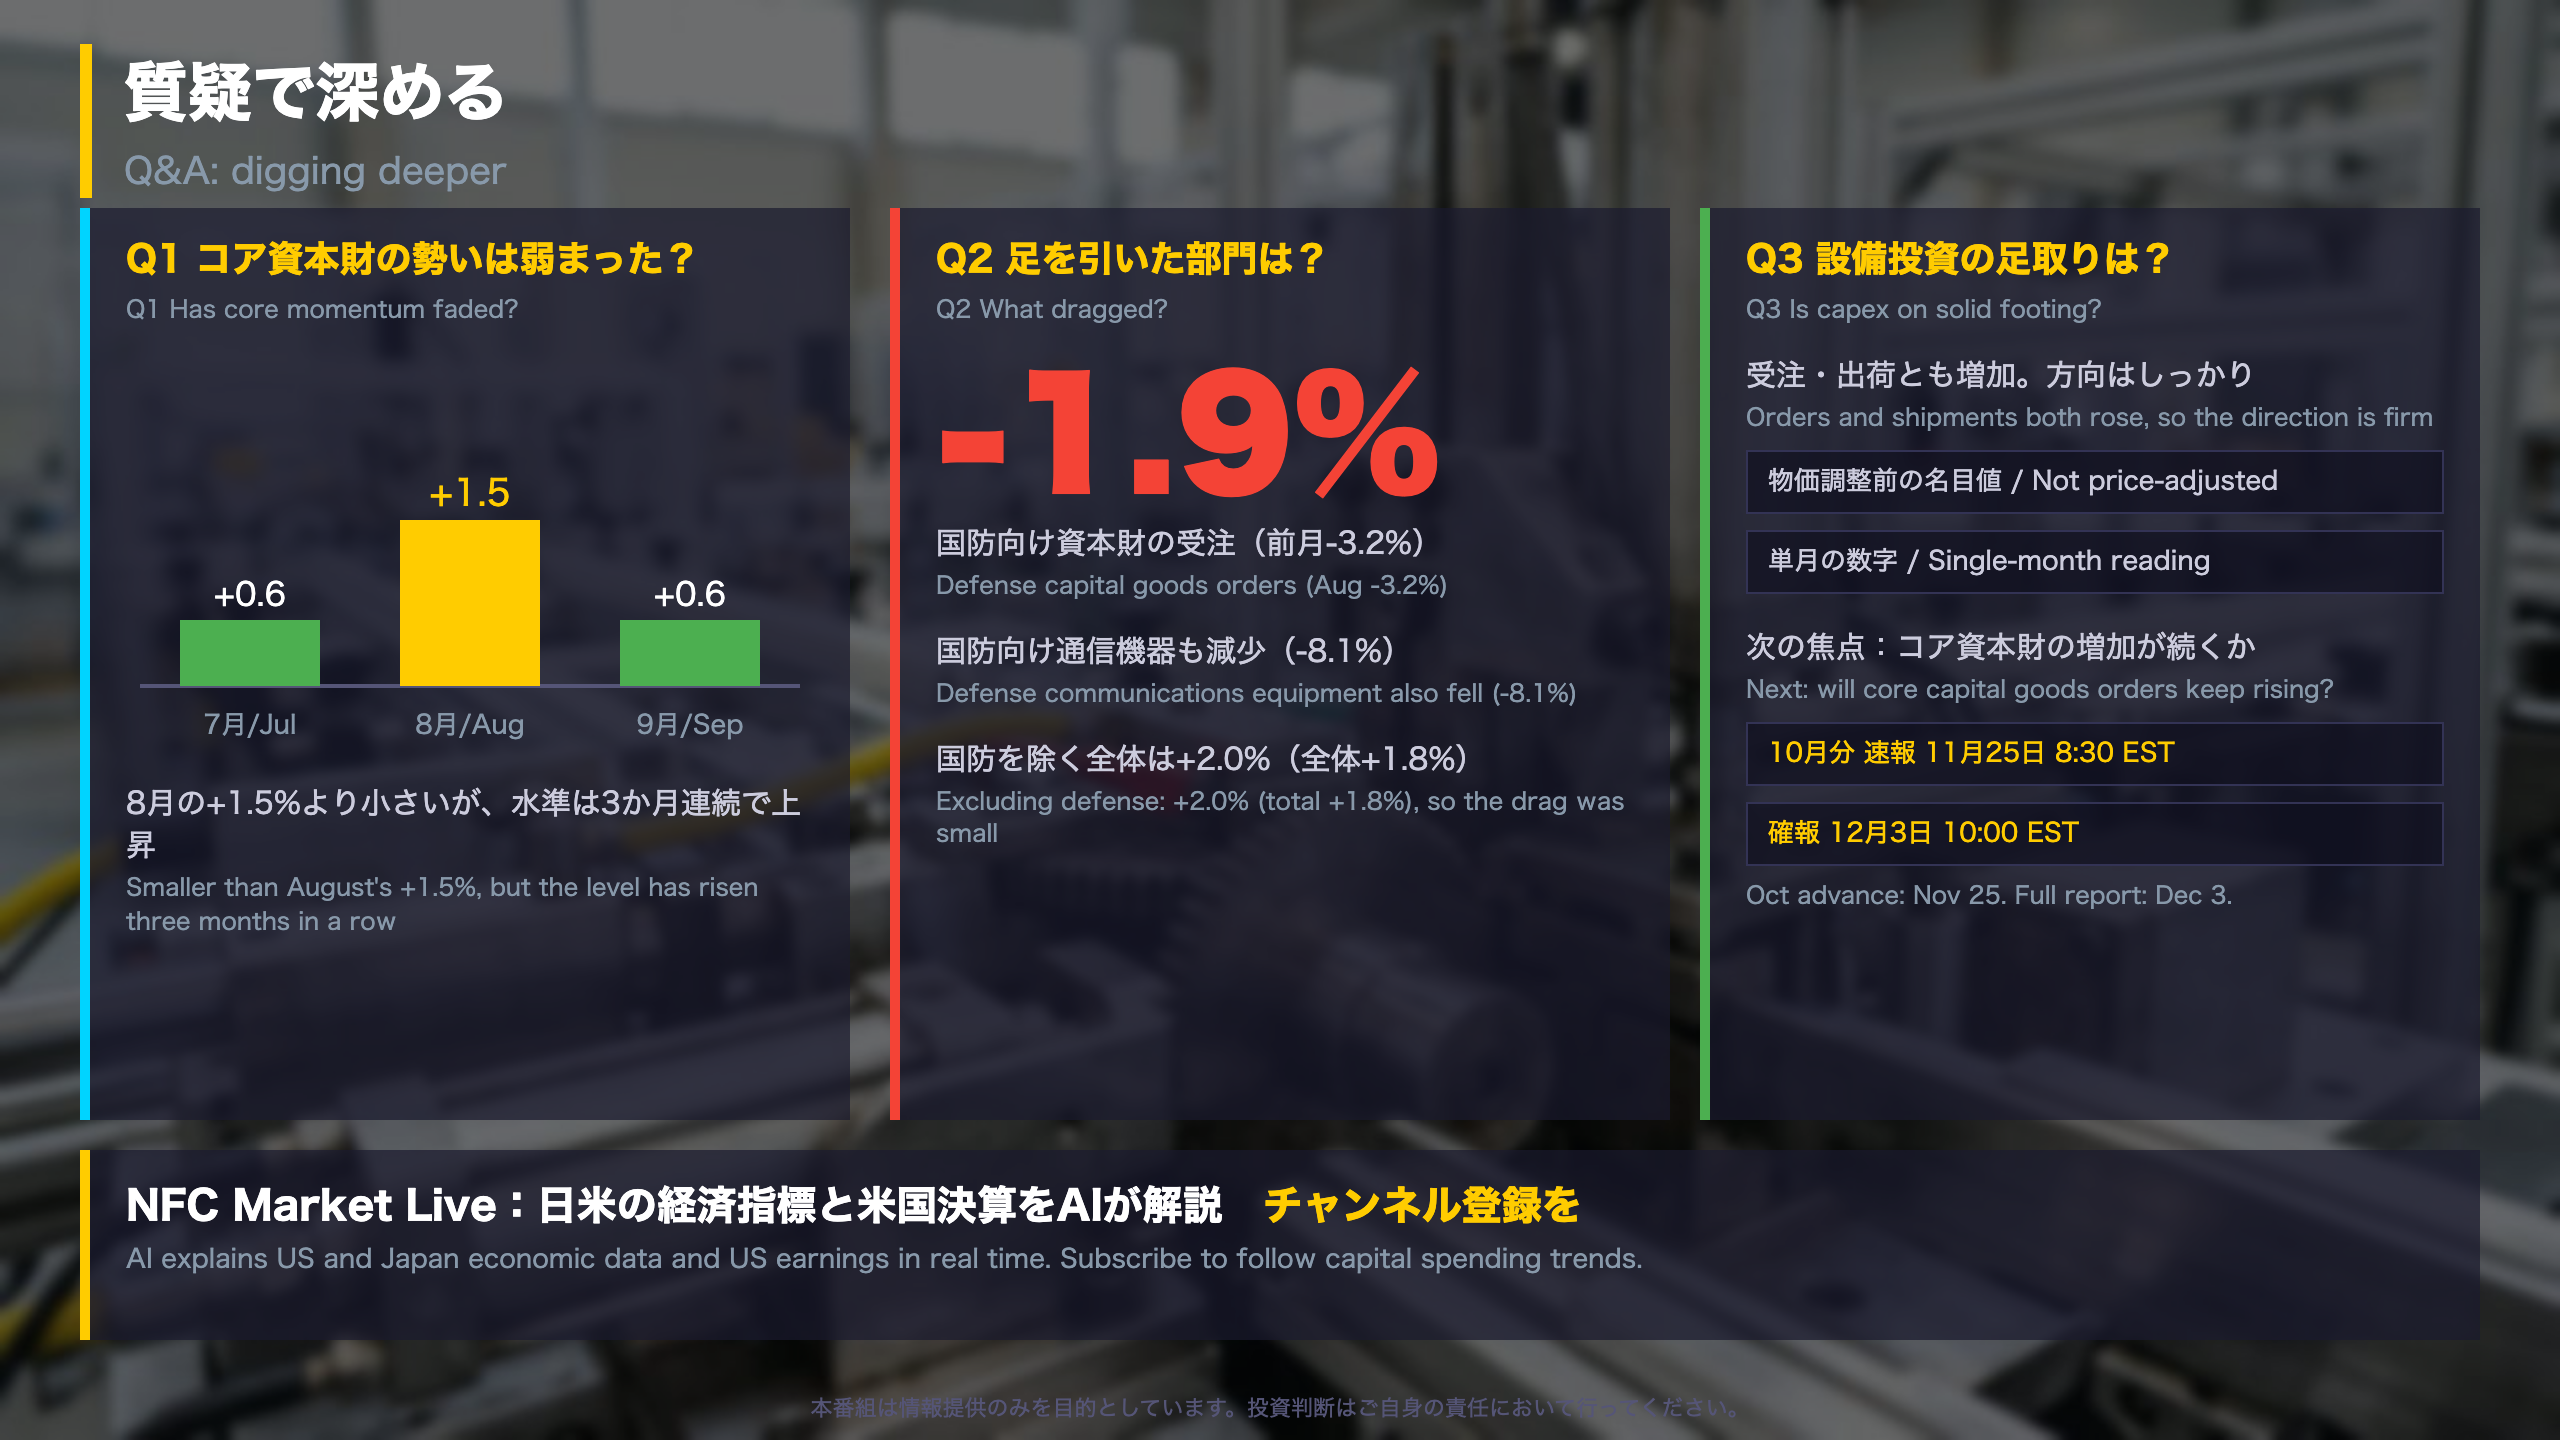
Defense capital goods orders fell 1.9% to $20.8B, extending declines of 3.2% (August) and 6.4% (July). Within defense, communications equipment dropped 8.1% while defense aircraft rose 5.8%. Excluding defense, total new orders rose 2.0%, slightly better than the 1.8% headline, so the defense drag was modest.
Revisions and reliability
August new orders were revised up to +0.3% from +0.1%, and August shipments to +0.1% from virtually unchanged. The Census Bureau stresses that the M3 panel is not based on a probability sample, so confidence intervals cannot be computed. Seasonal adjustment models will remain unchanged for the rest of 2026.
Balanced take
Positive: private-oriented core orders and shipments are rising together. Cautious: the monthly changes are small, nominal, and sensitive to aircraft timing; one report does not establish a trend.
Calendar
| Report | Release |
|---|---|
| October advance | Nov 25, 2026, 8:30 a.m. EST |
| October full | Dec 3, 2026, 10:00 a.m. EST |
| November advance | Dec 23, 2026 |
| November full | Jan 7, 2027 |
Disclaimer: This article is for informational purposes only. All investment decisions are made solely at your own risk.