📺 Watch the Full Video Analysis
This article was automatically generated by the NFC Market Live AI analysis system. (Updated: 2026-10-12 07:13 JST)
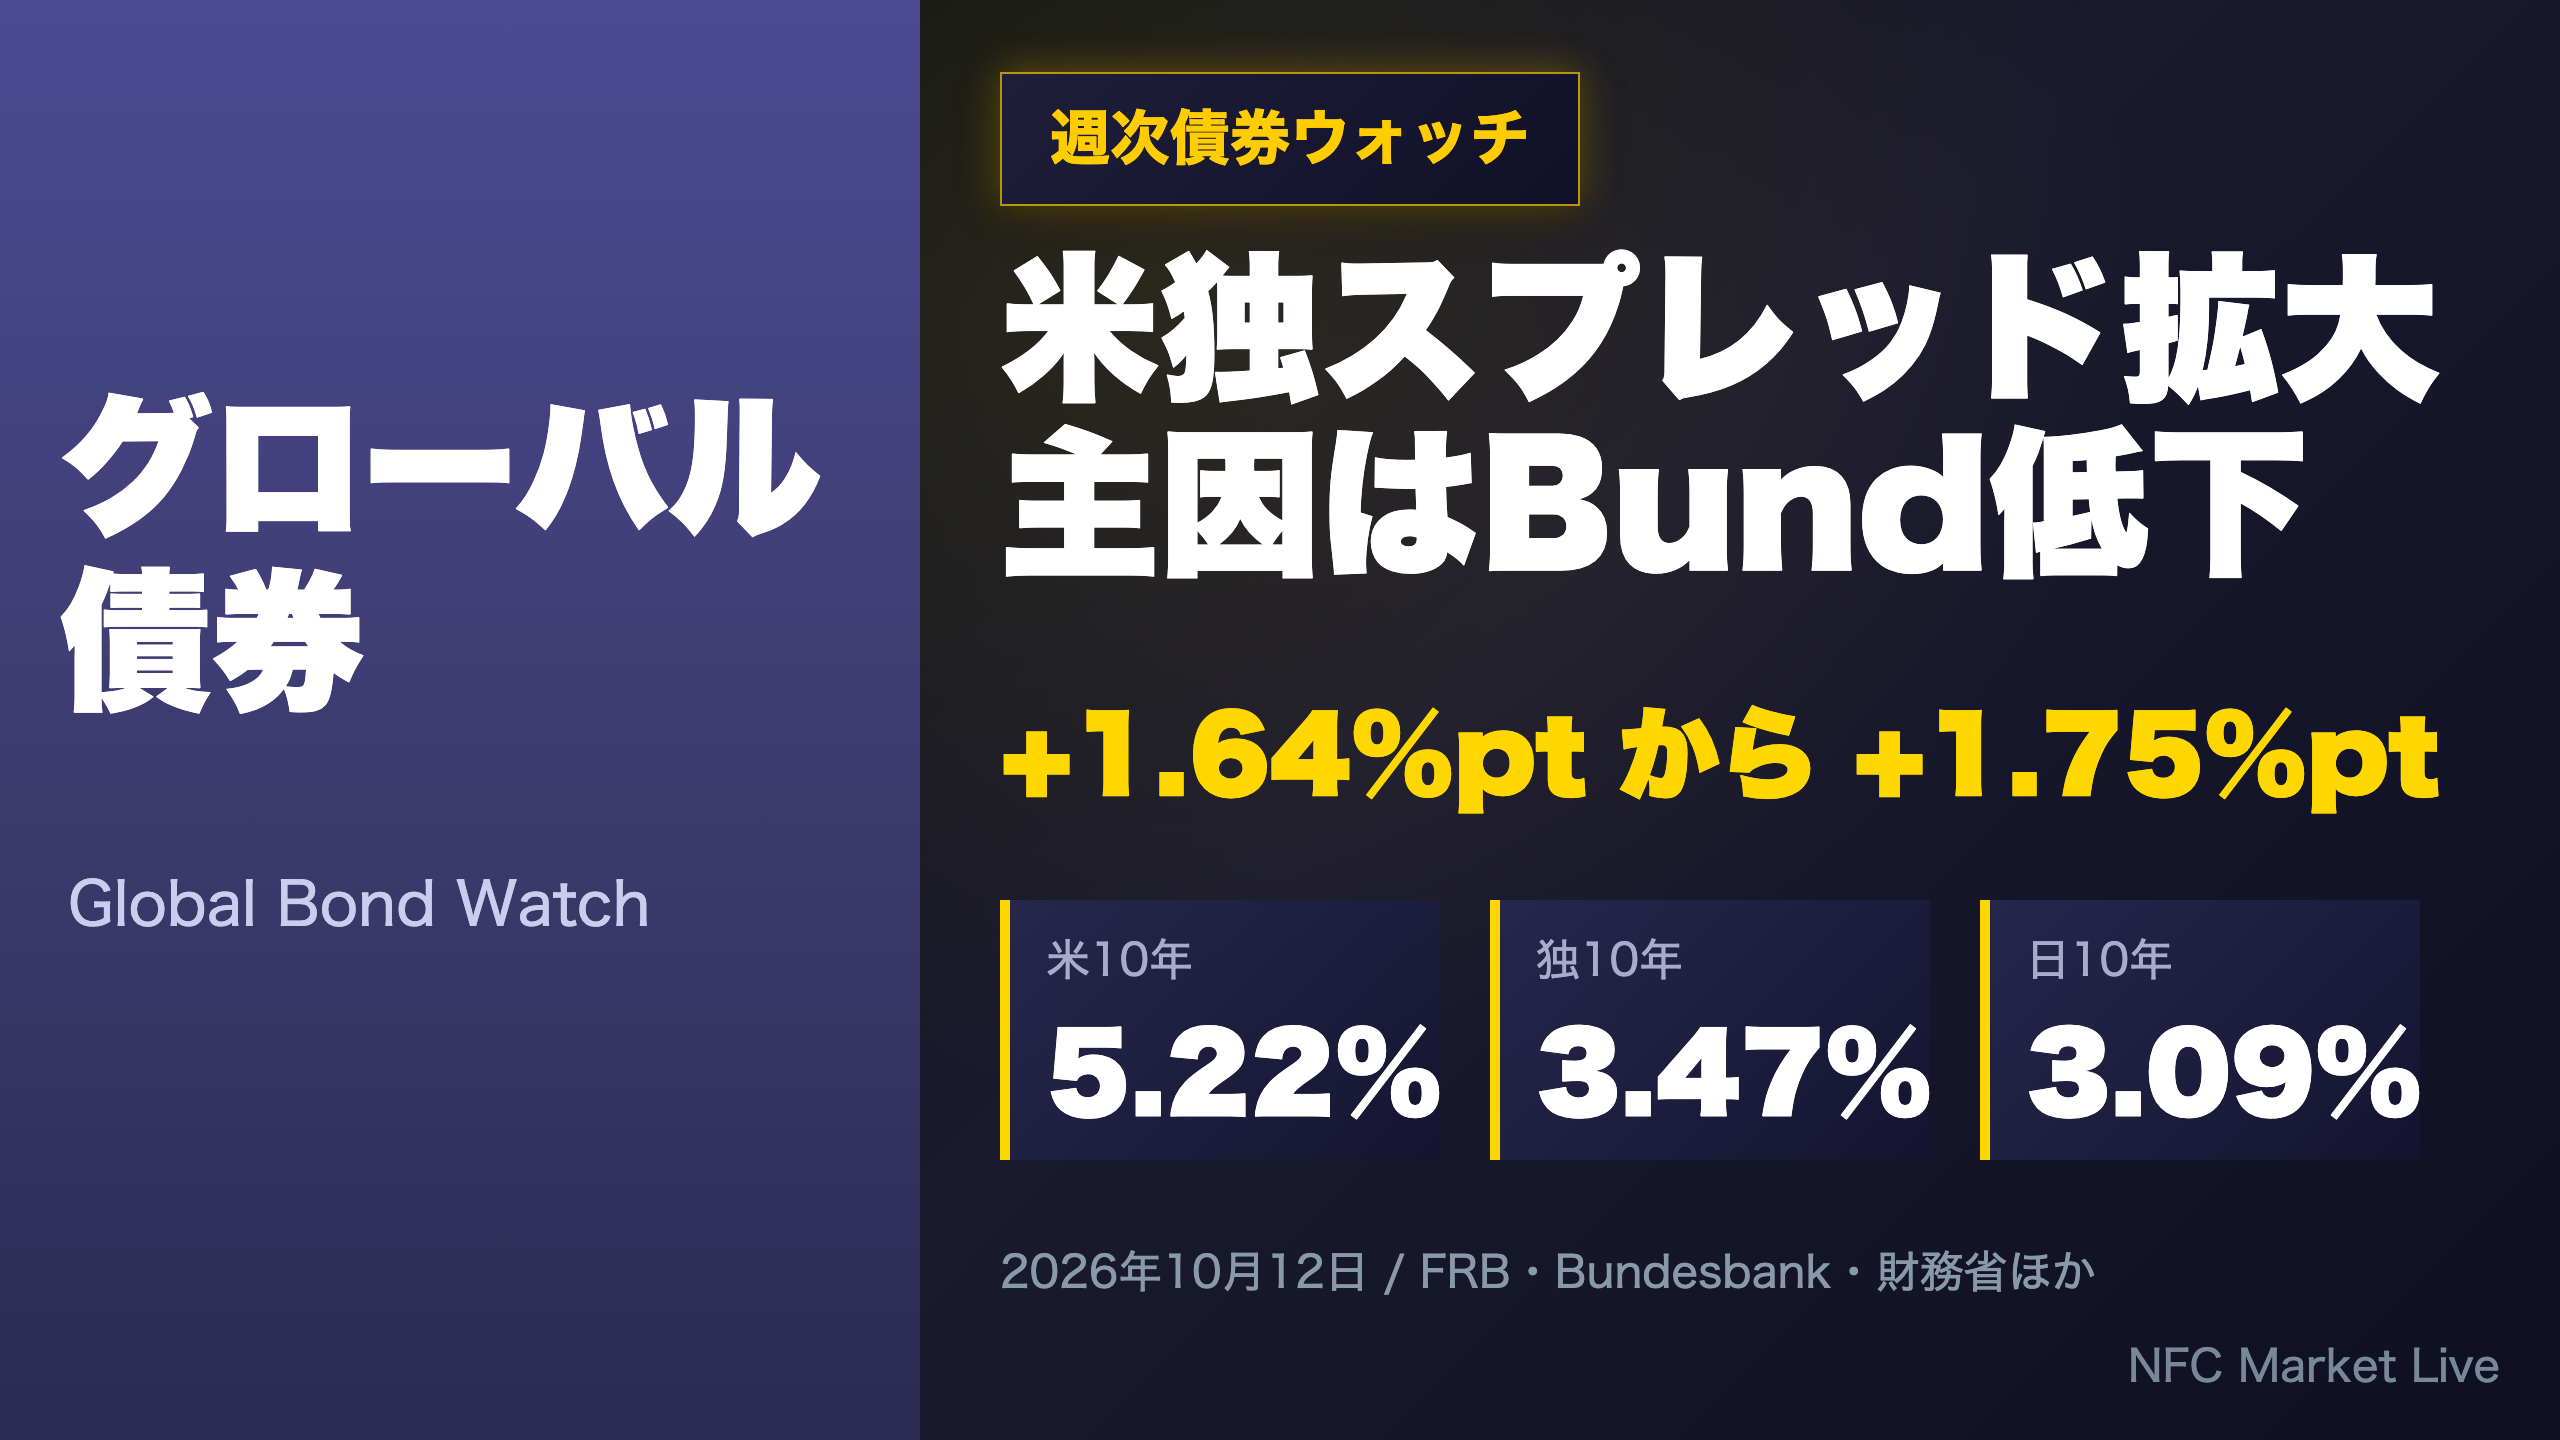
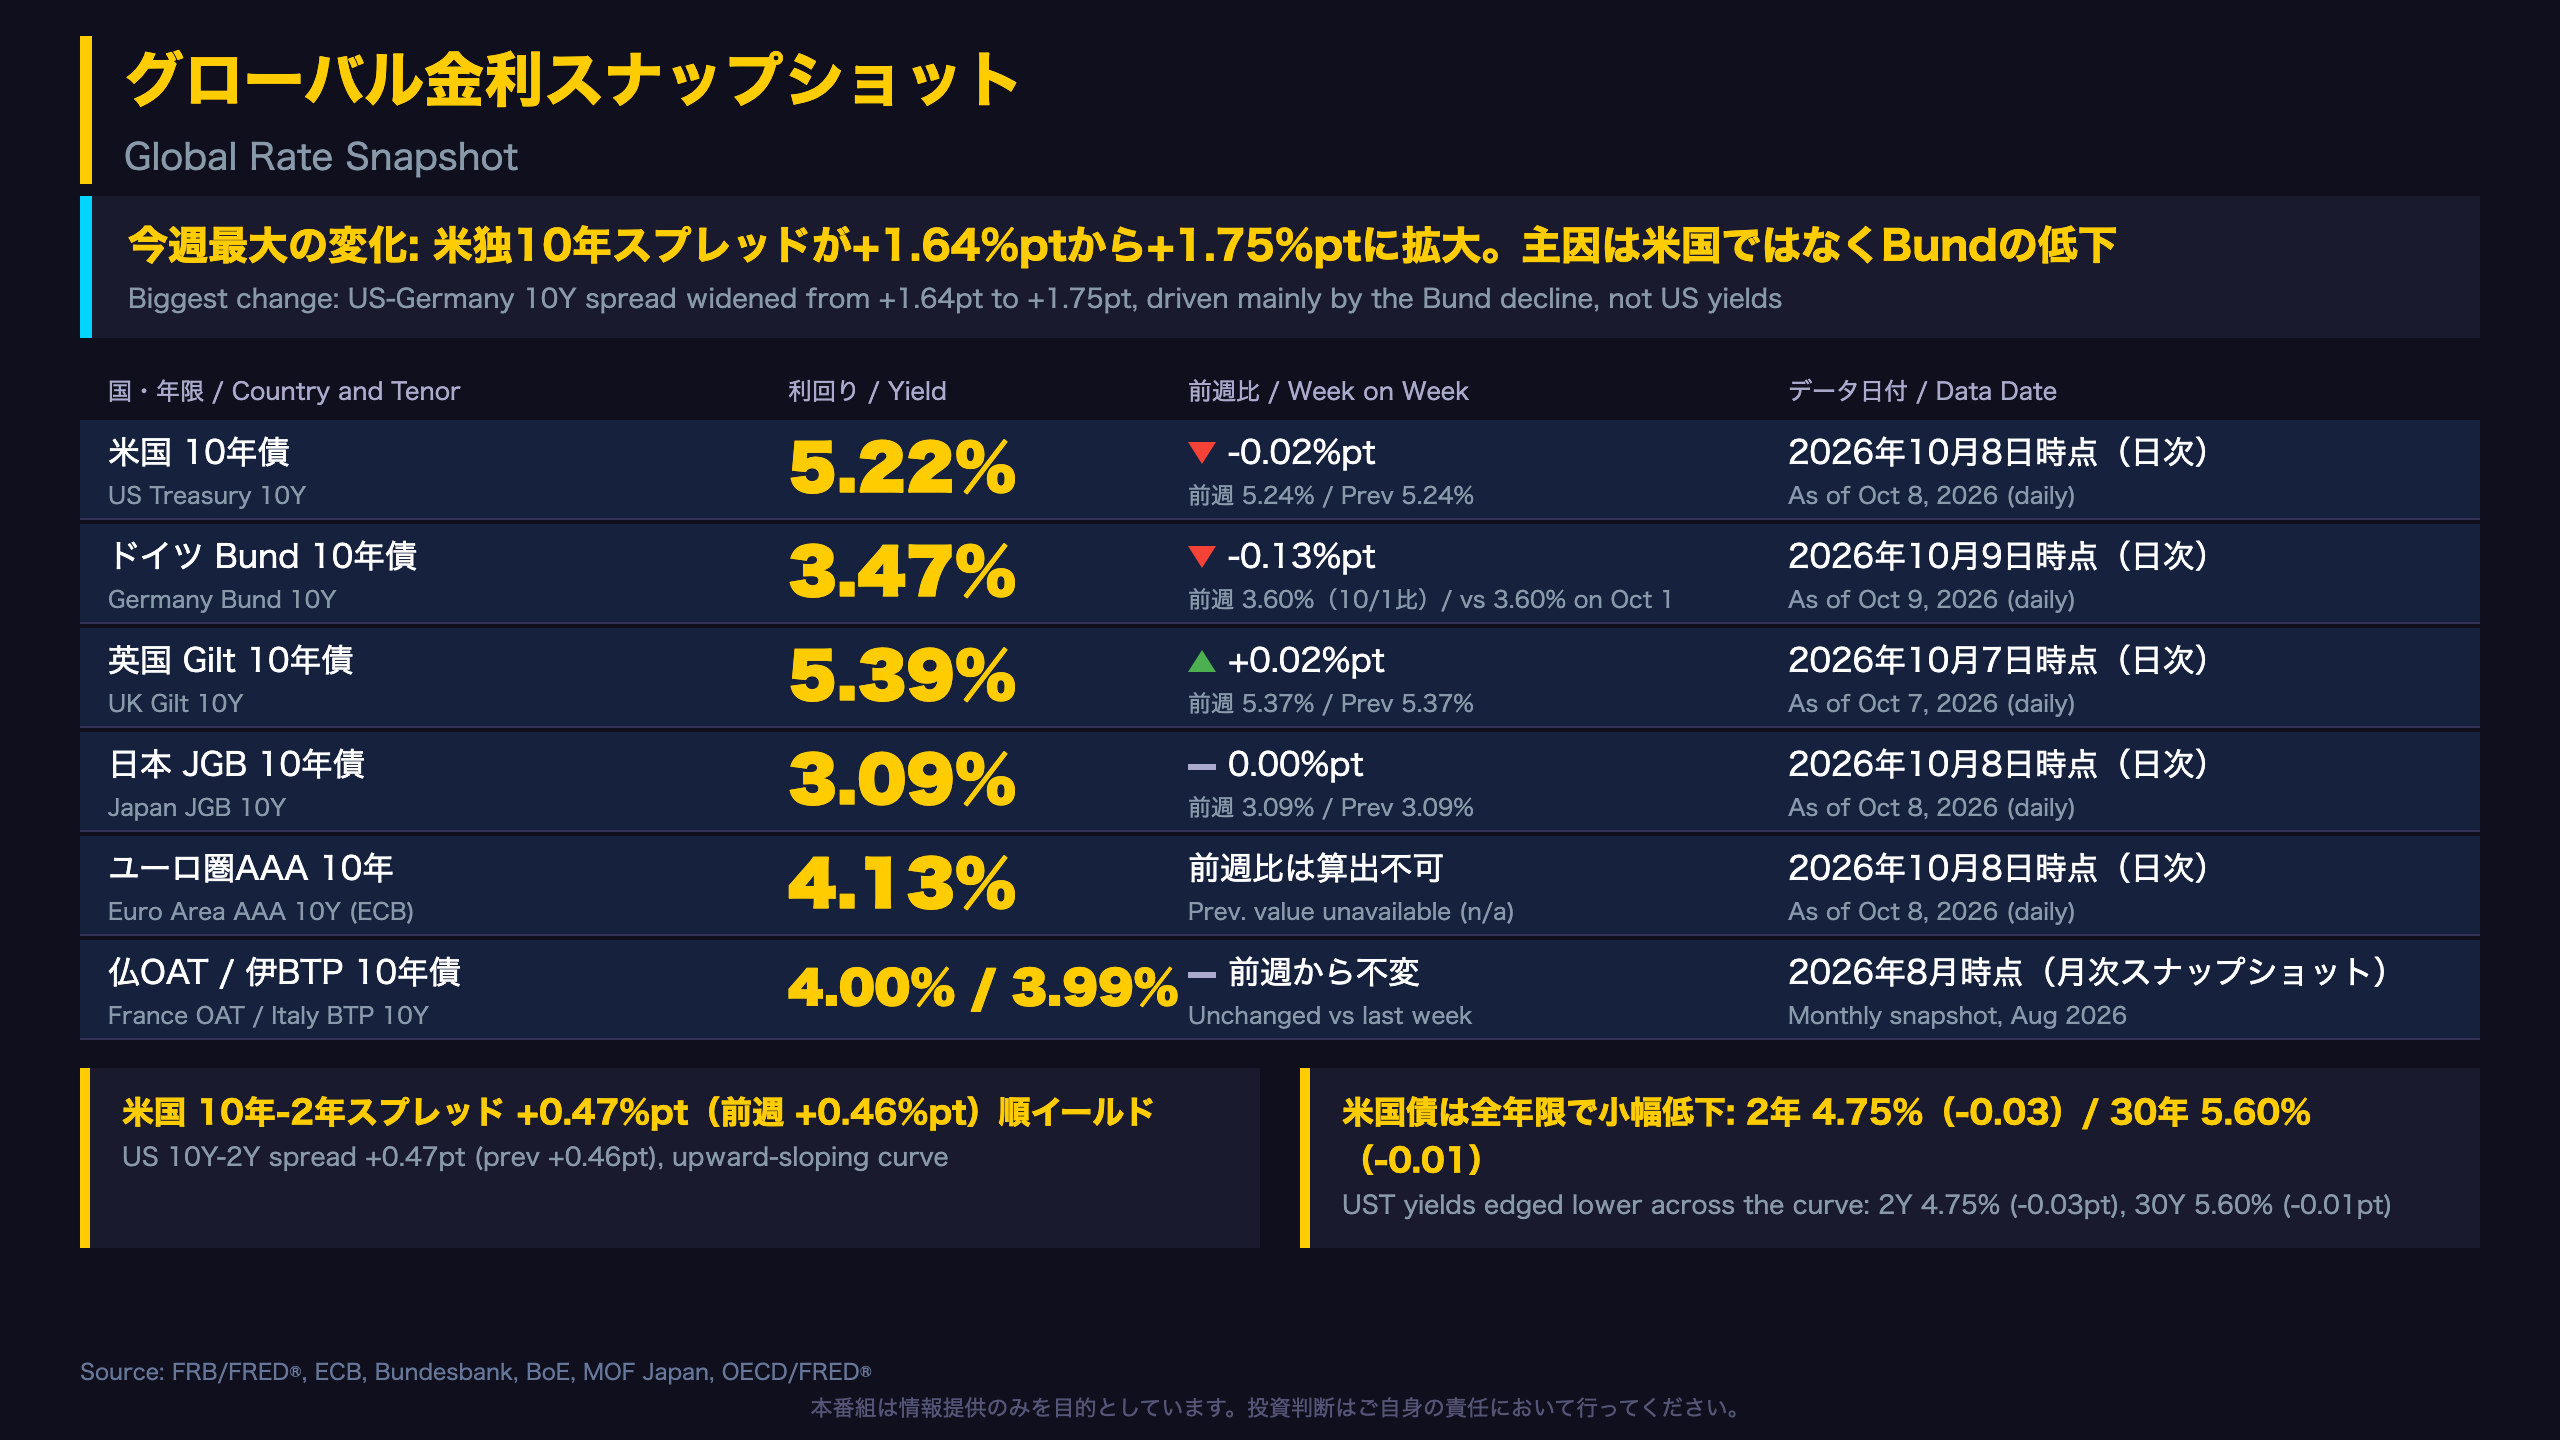
📊 The US-Germany 10Y spread widened to +1.75pt from +1.64pt. The US 10Y was nearly flat at 5.22% (-0.02pt), so the move mainly reflects the Bund falling from 3.60% to 3.47%.
📈 Demand looked firm: indirect bidders took 70.4% of the US 30Y auction and Japan’s 10Y auction drew a bid-to-cover of 3.76.
⚠️ Long-end yields remain elevated (US 30Y 5.60%, UK 10Y 5.39%). OAT/BTP are monthly figures, so the spread jump says little about French or Italian risk.
💡 We also cross-check the NFC HMM regimes against the spreads.
Data as of Oct 12, 2026.
グローバル金利スナップショット
Reading the Weekly Rate Snapshot
This snapshot compares yields from the data pulled on October 12, 2026 with the prior week’s pull. US yields come from the Federal Reserve’s H.15 release via FRED; the Bund from the Deutsche Bundesbank; the gilt from the Bank of England; JGBs from Japan’s Ministry of Finance.
What changed
- US: 2Y 4.75% (-0.03pt), 10Y 5.22% (-0.02pt), 30Y 5.60% (-0.01pt)
- Germany: 10Y Bund 3.47%, down 0.13pt from 3.60% (Oct 1 vs Oct 9 readings)
- UK: 10Y gilt 5.39%, up 0.02pt
- Japan: 10Y JGB 3.09%, unchanged
Why the US-Germany spread matters
The spread widened to +1.75pt from +1.64pt. Because the US 10Y barely moved, the widening is almost entirely the Bund leg. EUR/USD traders watch this rate differential, though the data alone does not establish a currency direction.
Caveats
Observation dates differ by a day or two across sources. The Bund’s reported five-day change (+0.02pt) differs from the week-on-week level change, which implies the drop came early in the window. French and Italian figures are monthly OECD data (August 2026) and sit outside this daily comparison.
Constructive: the US curve stays upward sloping (+0.47pt 10Y-2Y). Cautious: long-end levels are elevated, with US 30Y at 5.60%, UK 10Y at 5.39% and Japan 30Y at 4.14%.
米国債入札 Deep Dive
Inside This Week’s US Treasury Auctions
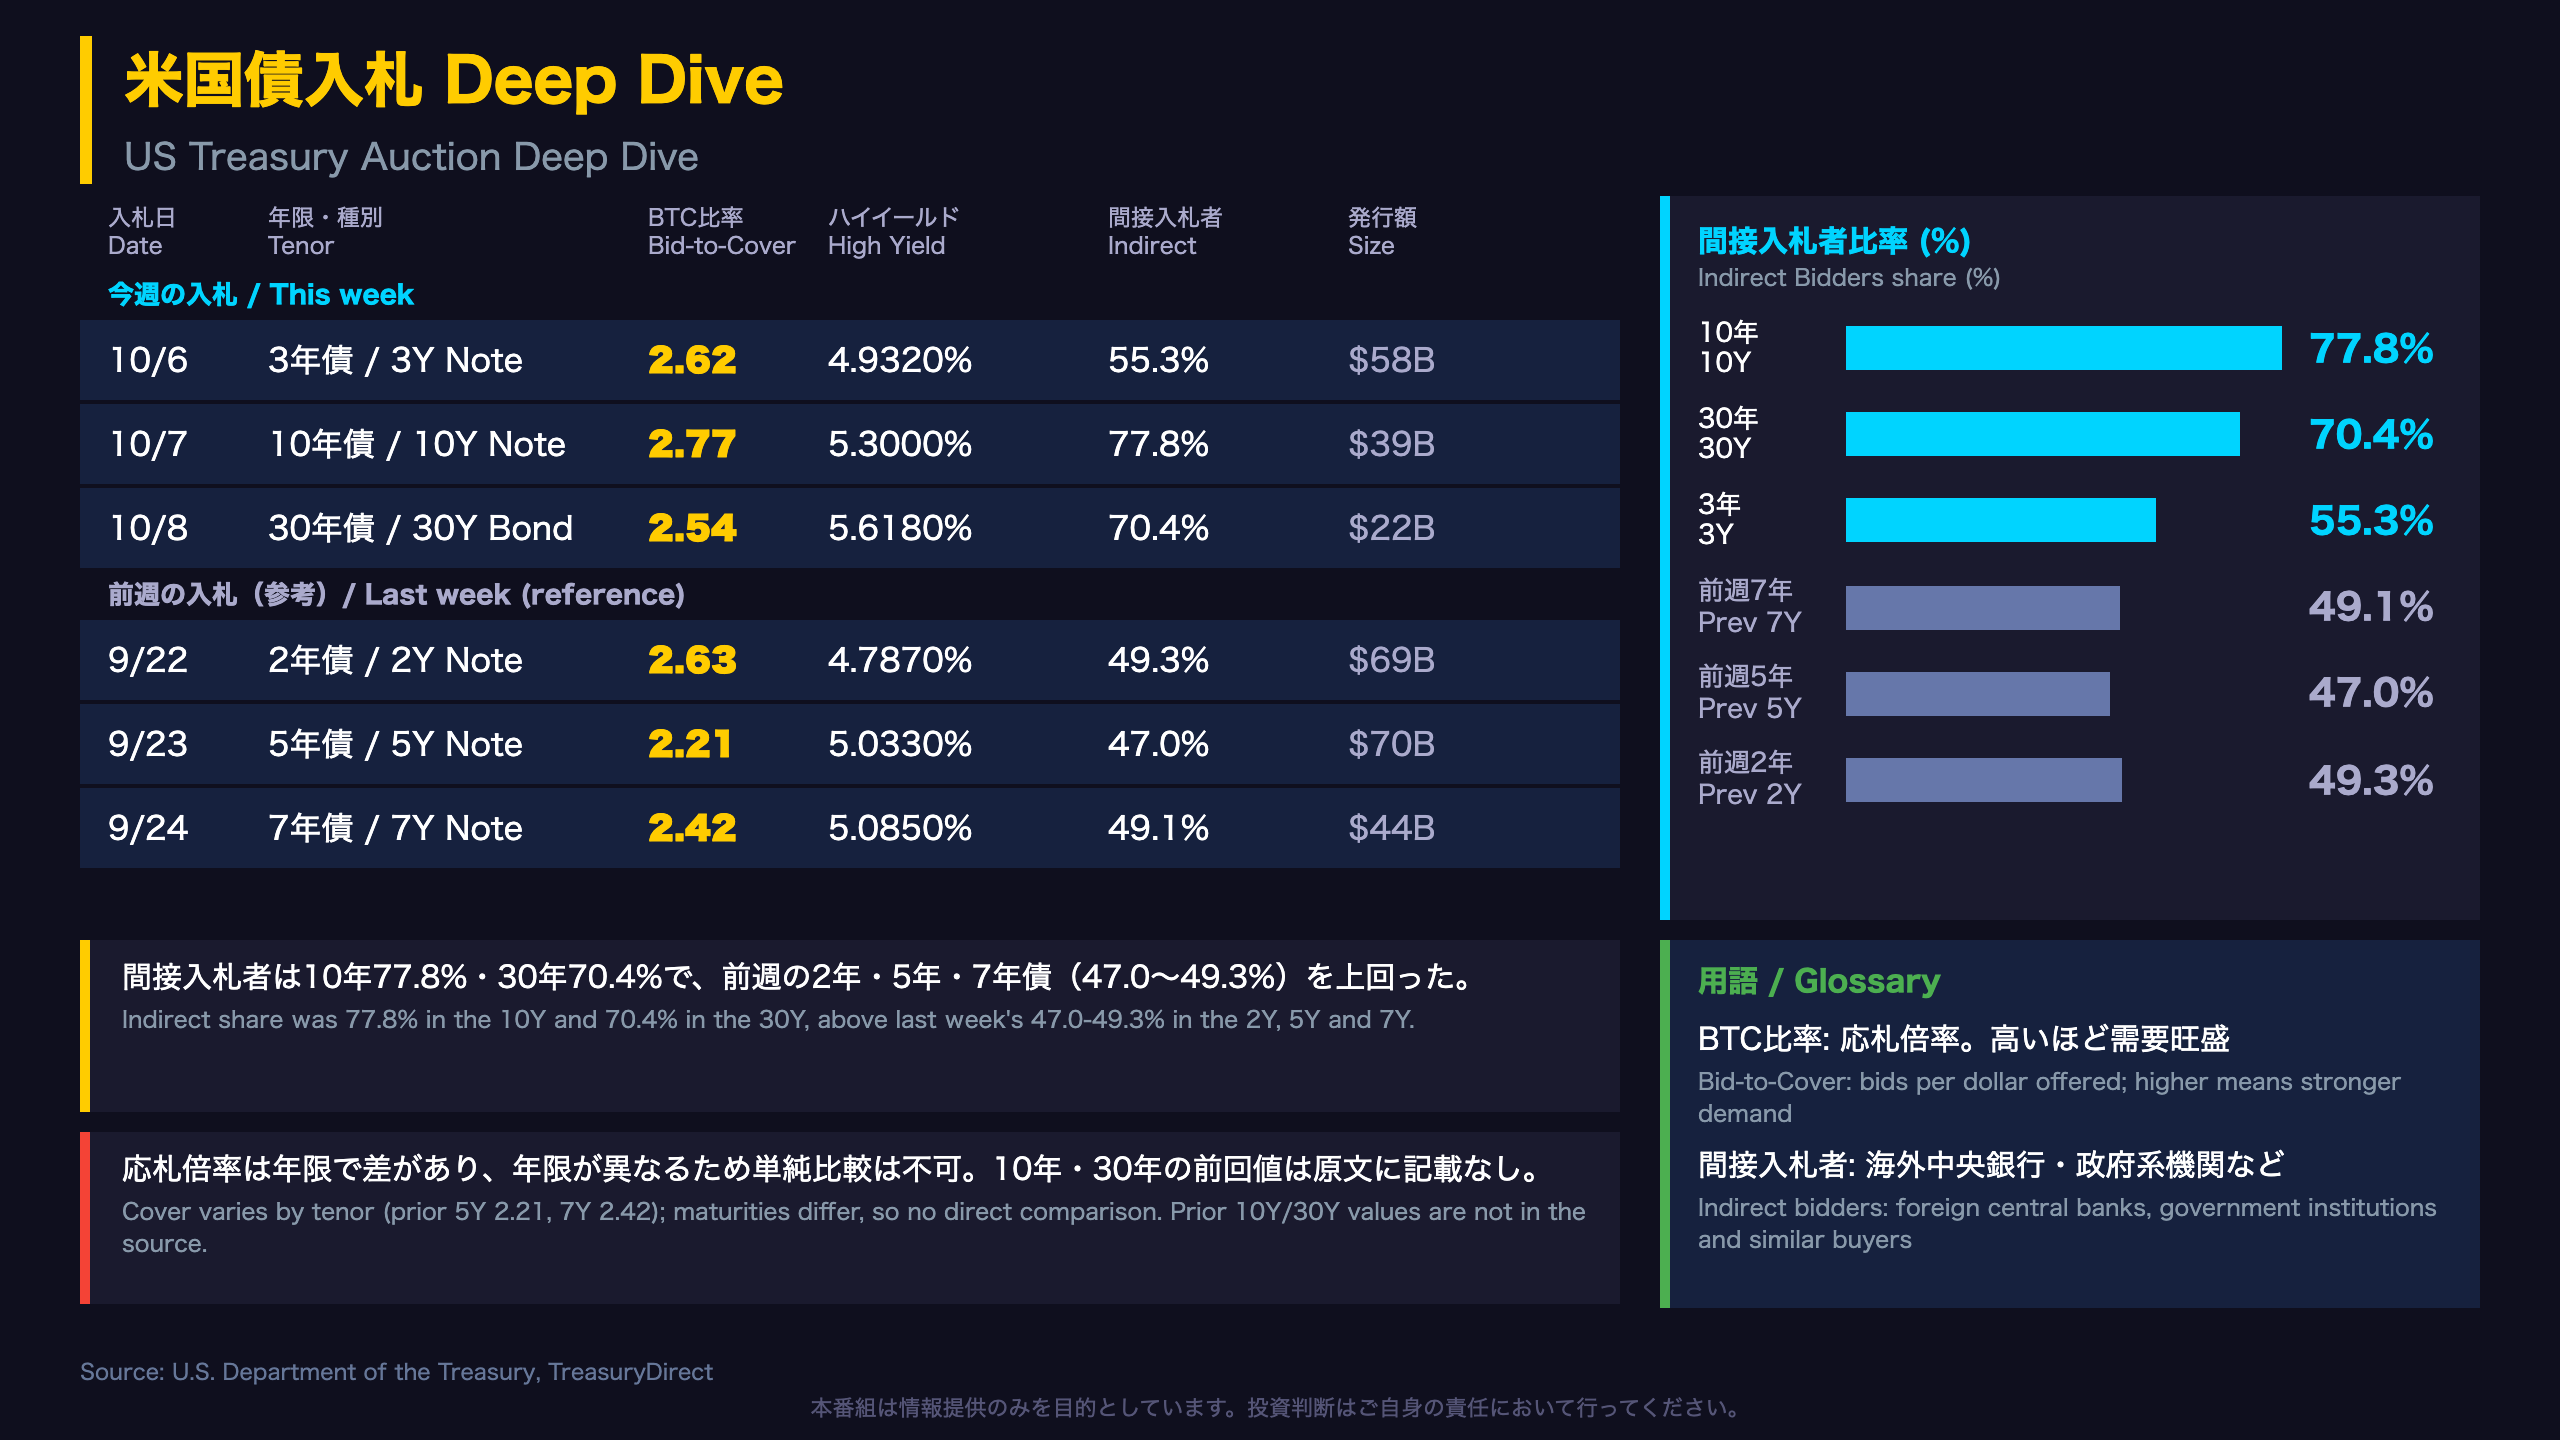
The US Treasury sells debt through regular auctions published via TreasuryDirect. Two metrics matter: the bid-to-cover ratio (bids received per dollar offered) and the indirect bidder share, which captures foreign central banks and similar buyers.
Coupon auctions
| Date | Tenor | Size | Bid-to-cover | Indirect |
|---|---|---|---|---|
| Oct 6 | 3Y | $58B | 2.62 | 55.3% |
| Oct 7 | 10Y | $39B | 2.77 | 77.8% |
| Oct 8 | 30Y | $22B | 2.54 | 70.4% |
The 30Y high yield of 5.618% sits 0.018pt above the same-day secondary yield of 5.60%. The source has no when-issued yield, so we cannot say whether the auction tailed.
Bills
The 4-week bill on Oct 8 drew 2.40 (vs 2.83 a week earlier), with indirect share at 49.2% (vs 56.1%) and a high rate of 4.048% (vs 3.956%). The 13-week bill slipped to 2.51 from 2.99.
Balanced read
- Constructive: indirect shares above 70% in the 10Y and 30Y exceed last week’s 47.0-49.3% in the 2Y, 5Y and 7Y.
- Cautious: the 30Y cover (2.54) is below the 10Y (2.77), and several bill auctions saw softer cover.
- Fiscal sustainability cannot be judged from auction data alone; deficit and issuance totals are outside this dataset.
ヨーロッパ債券市場
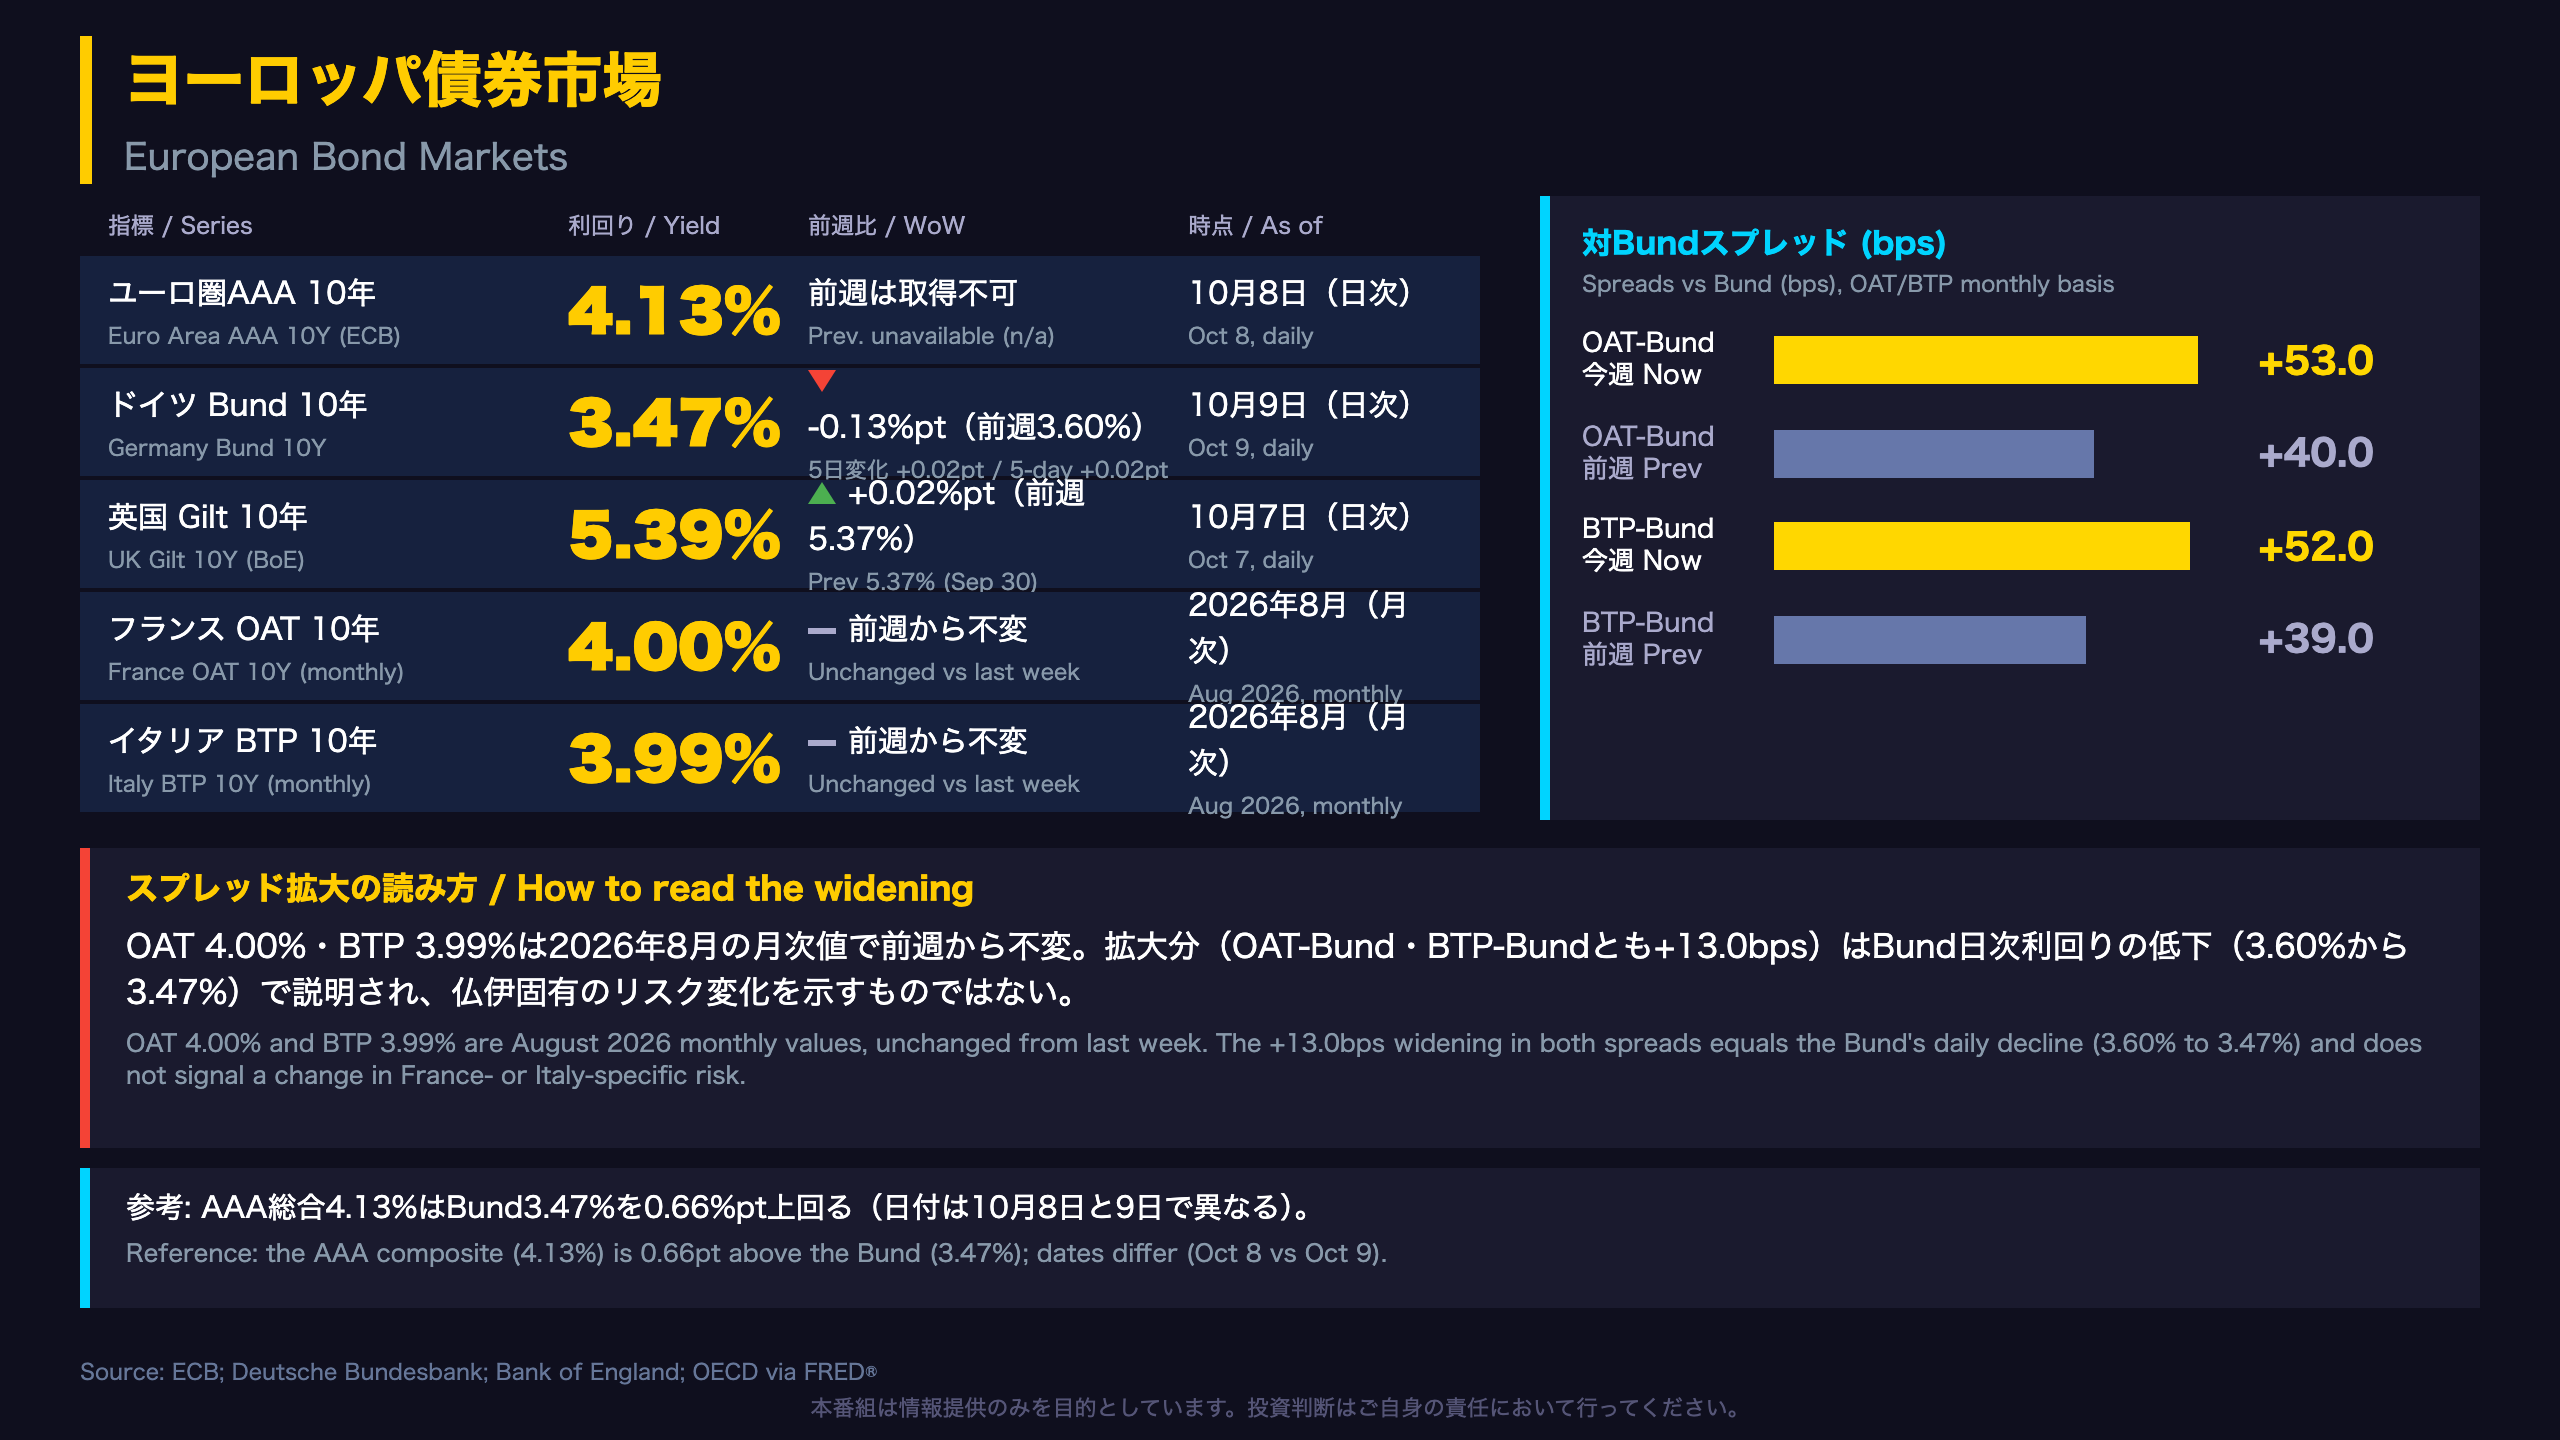
European Yields: Daily Data vs Monthly Snapshots
This section mixes sources with different frequencies, which matters for how the spreads are read.
- Euro area AAA 10Y (ECB yield curve statistics): 4.13% as of Oct 8. Last week’s value was unavailable, so no weekly change exists.
- Bund 10Y (Deutsche Bundesbank): 3.47% as of Oct 9 vs 3.60% on Oct 1 (-0.13pt); the five-day change shown is +0.02pt.
- Gilt 10Y (Bank of England): 5.39% as of Oct 7, +0.02pt.
- OAT/BTP 10Y (OECD via FRED, monthly): 4.00% and 3.99% for August 2026, unchanged from last week.
Why the spread jump is a data artifact
OAT-Bund rose to +53.0bps from +40.0bps, and BTP-Bund to +52.0bps from +39.0bps. Both moved by exactly +13.0bps, equal to the Bund’s drop, because the other leg is a frozen monthly value. The widening therefore says little about French or Italian risk until September monthly data arrives.
Two readings
- Constructive: no sign of stress in the daily gilt or US series; the gilt moved only 0.02pt.
- Cautious: the AAA composite (4.13%) sits 0.66pt above the Bund, with dates one day apart. The source does not explain the gap, and definitional differences may play a role.
For US readers: Gilts are UK government bonds, OATs are French and BTPs are Italian, with the Bund as the euro area benchmark.
日本国債・日銀政策金利
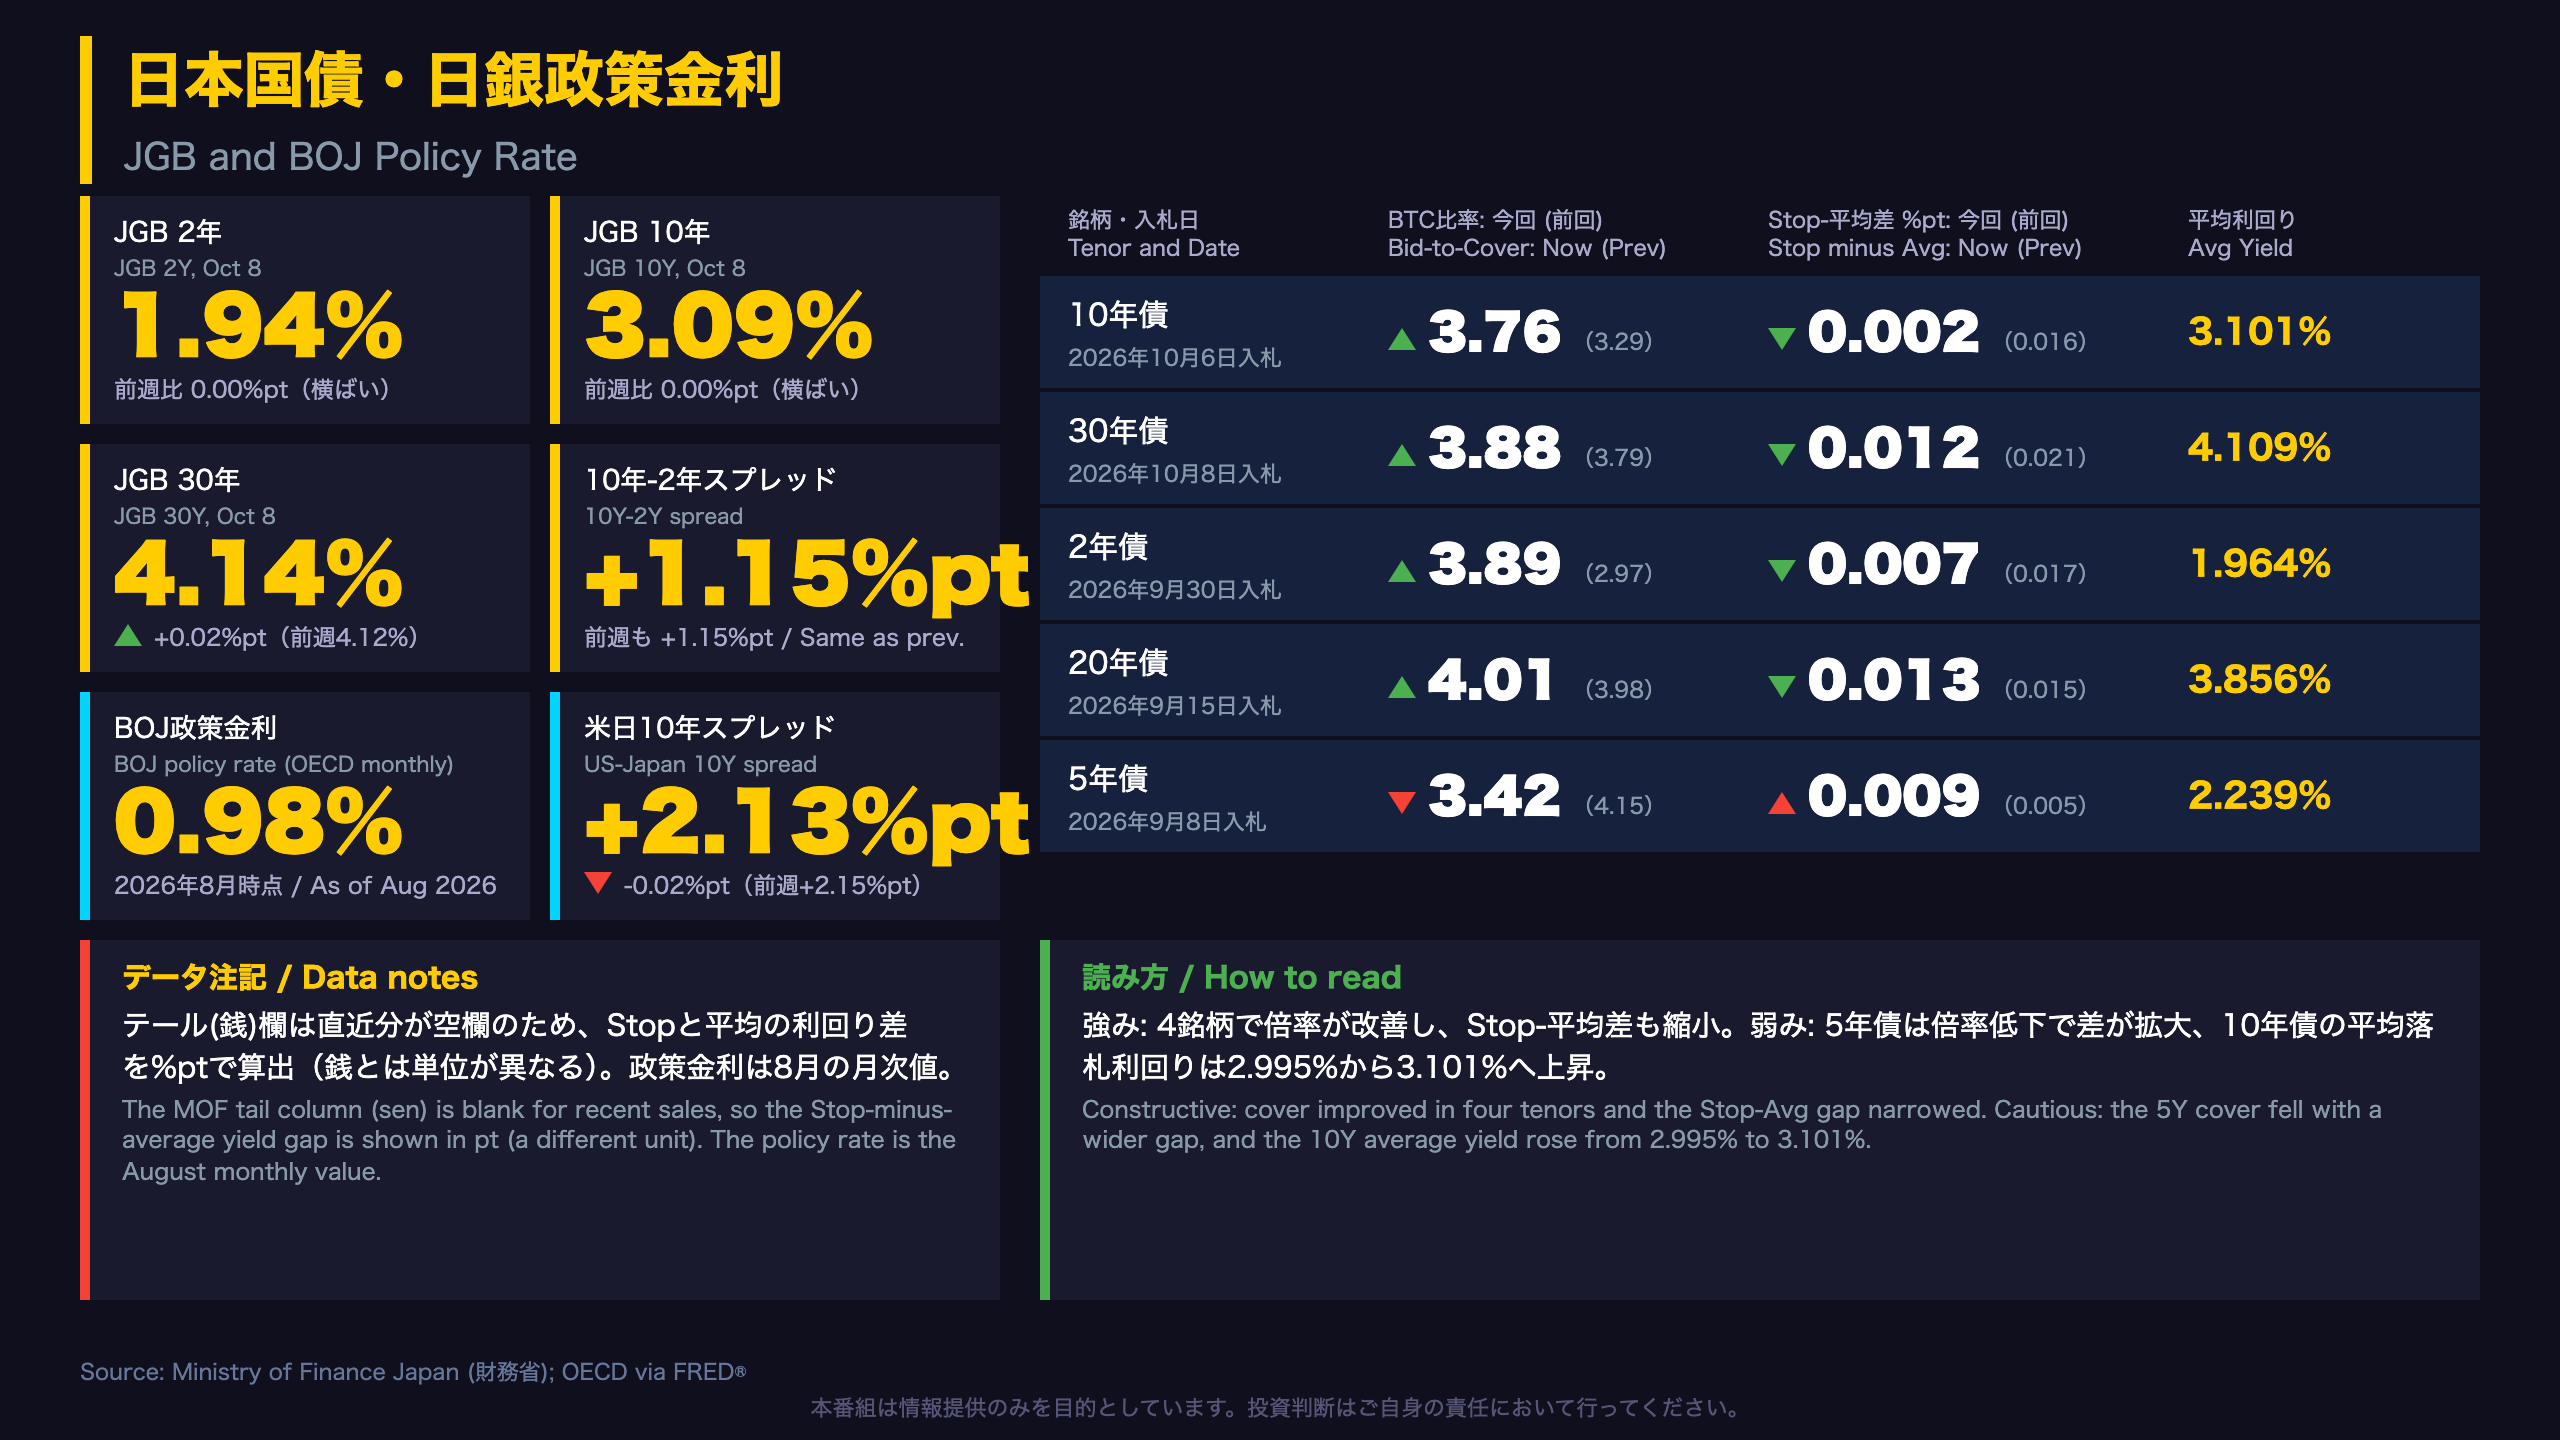
Japan: JGB Auctions and the BOJ Backdrop
Japan’s Ministry of Finance (MOF) publishes JGB yields daily and auction results after each sale. The BOJ policy rate here comes from OECD monthly data via FRED: 0.98% as of August 2026, so it may not reflect the latest decision.
Bid-to-cover trend
| Tenor | Latest | Previous | Before that |
|---|---|---|---|
| 10Y | 3.76 (Oct 6) | 3.29 (Sep 1) | 2.56 (Aug 4) |
| 30Y | 3.88 (Oct 8) | 3.79 (Sep 3) | 3.86 (Aug 6) |
| 2Y | 3.89 (Sep 30) | 2.97 (Aug 28) | 3.63 (Jul 30) |
| 5Y | 3.42 (Sep 8) | 4.15 (Aug 18) | 3.43 (Jul 9) |
Reading it
- Constructive: bid-to-cover improved in the 10Y, 30Y, 2Y and 20Y auctions, and the stop-out minus average yield gap narrowed (10Y: 0.016pt to 0.002pt).
- Cautious: the 5Y cover fell from 4.15 to 3.42, and the 30Y cover of 3.88 is below July’s 4.55. Average auction yields also rose (10Y: 2.995% to 3.101%; 2Y: 1.708% to 1.964%).
- The MOF tail column (in sen, a price measure) is blank for recent sales, so we computed the yield gap in percentage points; it is a different unit.
The US-Japan 10Y spread of +2.13pt (from +2.15pt) is the rate gap commonly cited alongside USD/JPY, though it does not establish a direction by itself.
スプレッドとHMMレジームの照合
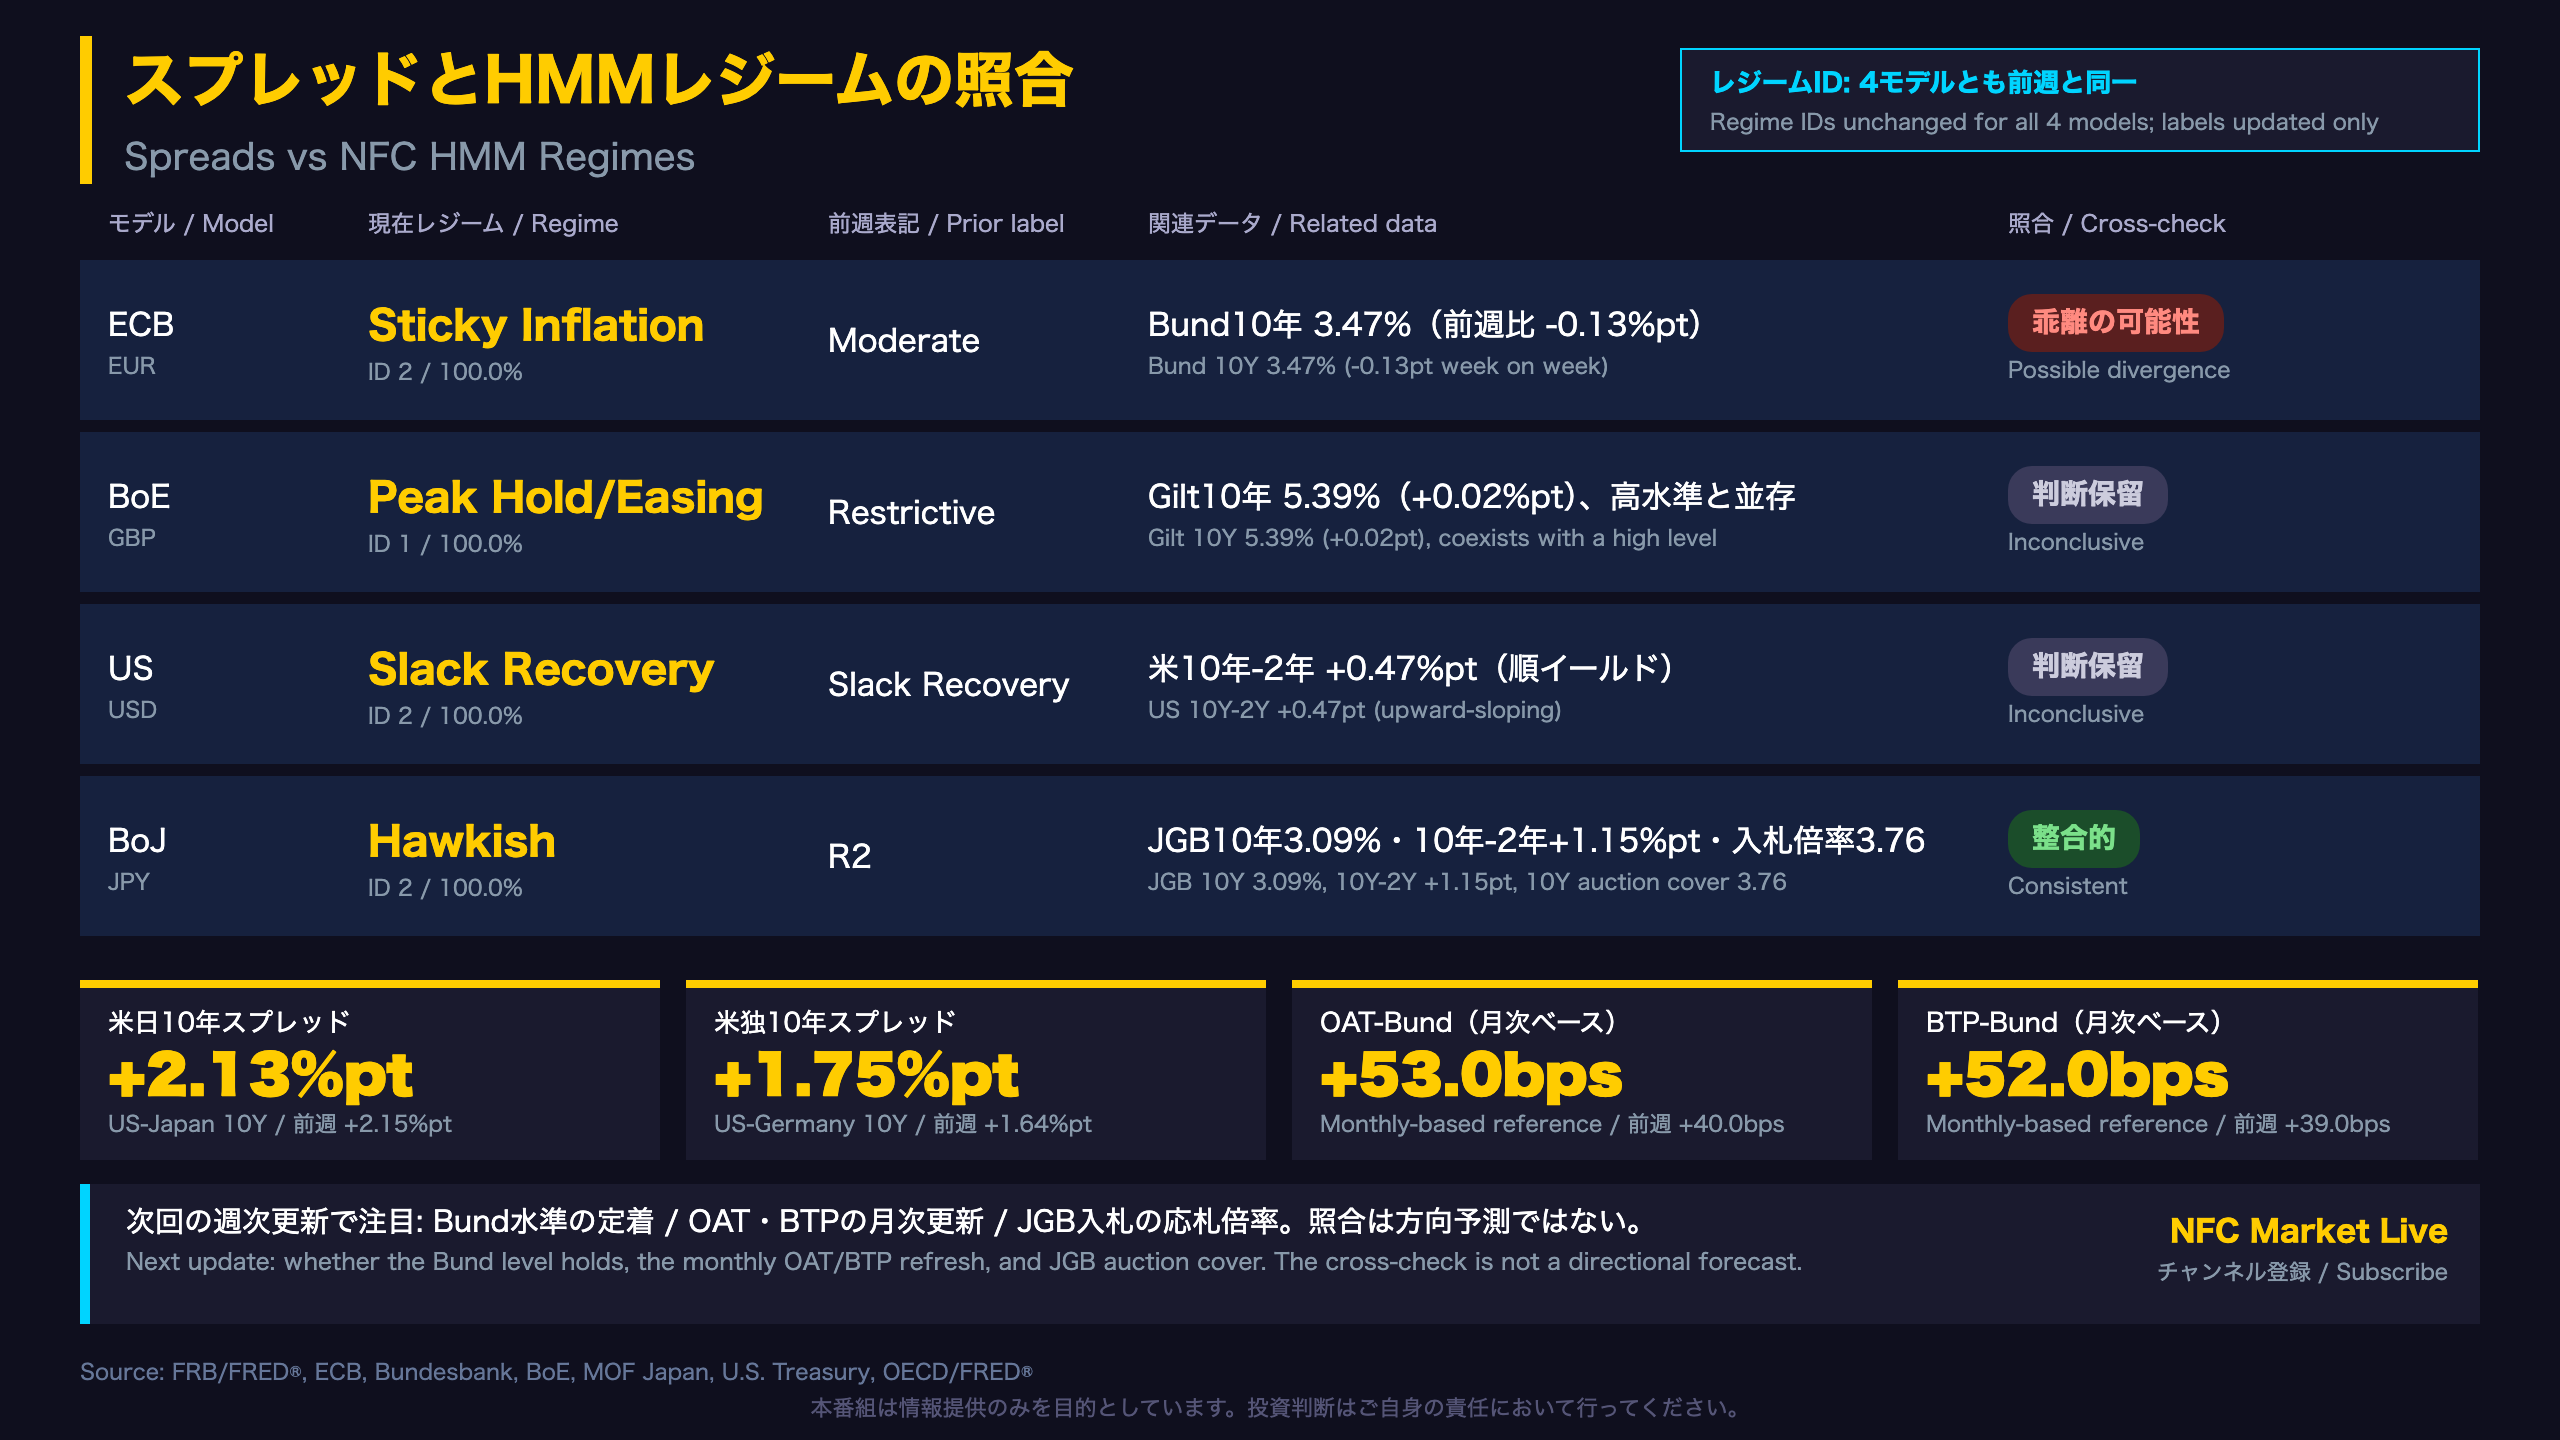
Cross-Checking the NFC HMM Regimes Against Rate Spreads
The NFC HMM is this channel’s proprietary model that classifies each central bank’s policy phase into regimes. All four regime IDs match last week; only the labels changed, so this week’s output does not signal a regime shift.
| Model | Prior label | Current label | ID |
|---|---|---|---|
| ECB | Moderate | Sticky Inflation | 2 |
| BoE | Restrictive | Peak Hold/Easing | 1 |
| US | Slack Recovery | Slack Recovery | 2 |
| BoJ | R2 | Hawkish | 2 |
Alignment check
- BoJ: Hawkish is consistent with JGB 10Y at 3.09%, a +1.15pt 10Y-2Y slope and a 3.76 10Y bid-to-cover.
- ECB: Sticky Inflation does not obviously match the 0.13pt Bund decline; a possible divergence, but one week of data is not conclusive.
- BoE and US: inconclusive. Gilts at 5.39% coexist with the Peak Hold/Easing label; the US curve is upward sloping (+0.47pt).
Spreads
US-Japan 10Y +2.13pt (prev +2.15pt); US-Germany 10Y +1.75pt (prev +1.64pt); OAT-Bund +53.0bps and BTP-Bund +52.0bps (monthly-based). These are often linked with USD/JPY, EUR/USD and European risk sentiment, but none alone supports a directional call.
Next
Watch whether the Bund holds near 3.47% and how OAT and BTP look once monthly data refreshes.
Disclaimer: This article is for informational purposes only. All investment decisions are made solely at your own risk.