This article was automatically generated by the NFC Market Live AI analysis system. (Updated: 2026-10-02 08:39 JST)
📄 Primary Source
総務省統計局
https://www.stat.go.jp/data/cpi/sokuhou/tsuki/pdf/kubu.pdf
📊 Japan’s Ministry of Internal Affairs released the Tokyo 23-ward CPI for September 2026.
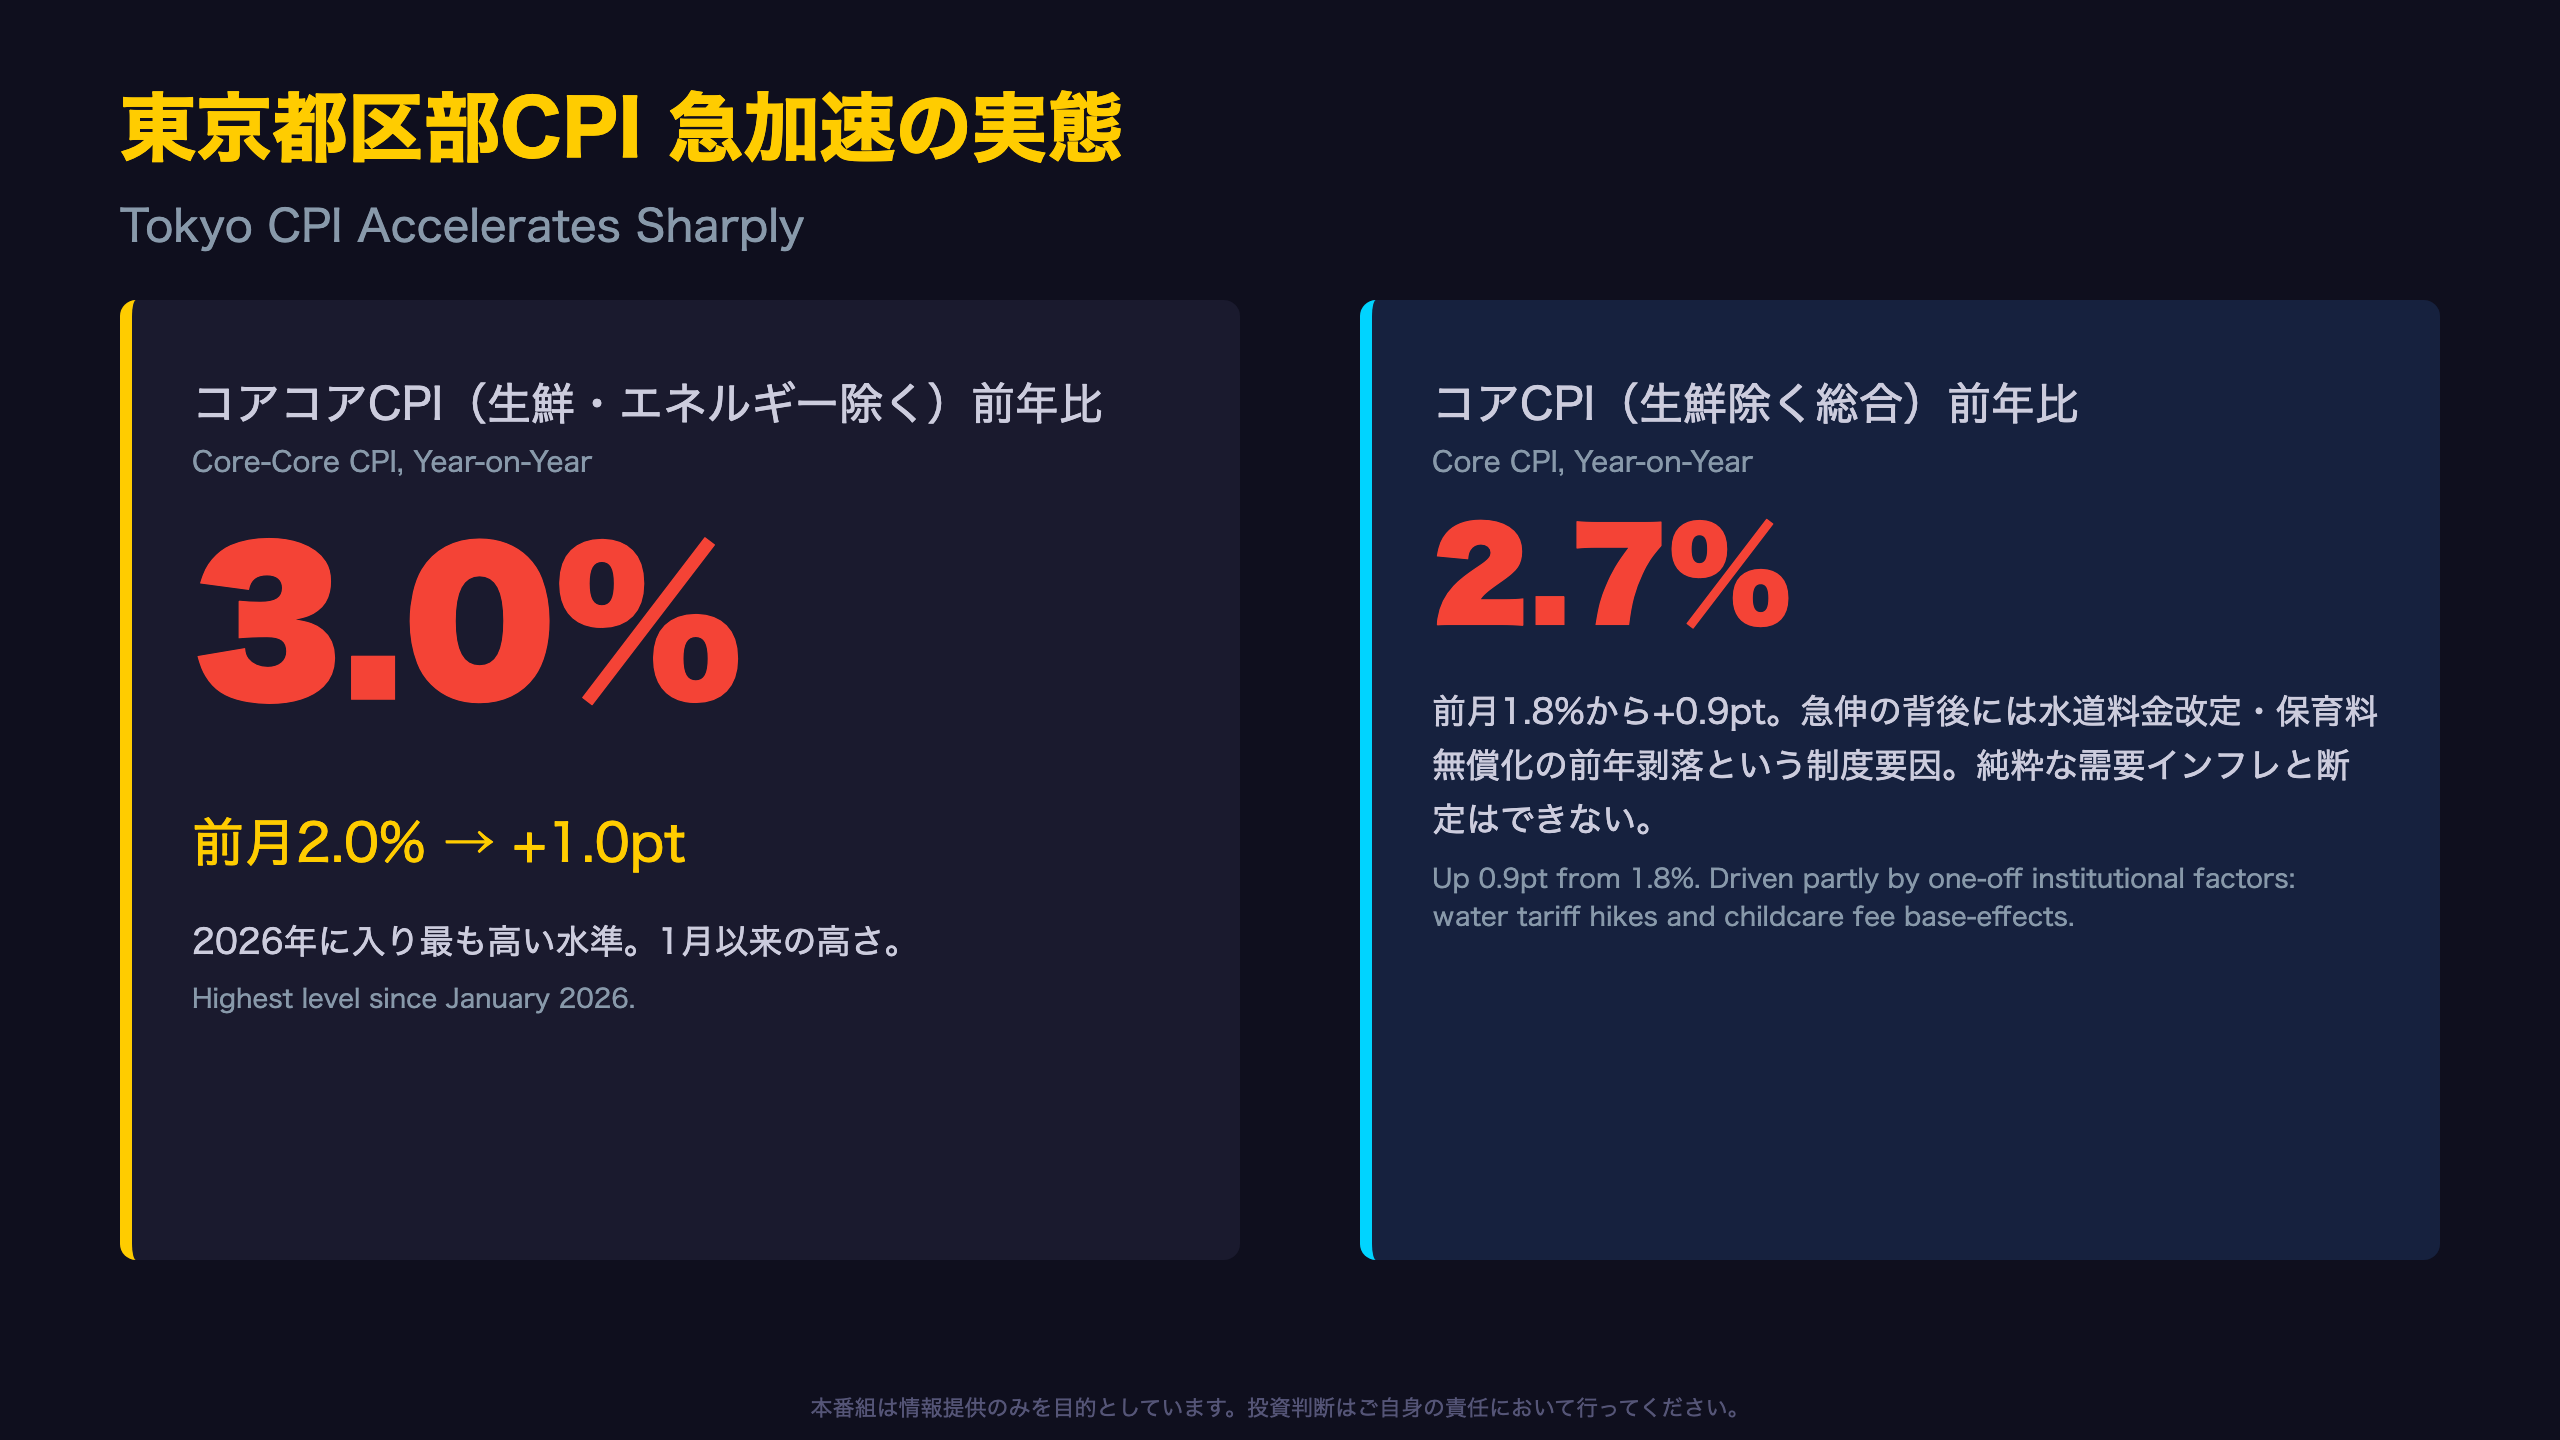
Core CPI (ex-fresh food) jumped to 2.7% YoY, Core-Core (ex-fresh food & energy) hit 3.0% — a sharp 0.9-1.0pt acceleration from August.
⚠️ However, much of this surge stems from institutional factors: a 65.6% water tariff hike and the year-over-year drop-off from Tokyo’s childcare fee waiver program, not pure demand-driven inflation.
💡 Still, underlying price pressures persist in hotel rates, overseas travel costs, and durable goods — signaling continued service-sector pass-through.
📅 Next national CPI release: October 2. Markets will watch whether Tokyo’s spike foreshadows a BOJ policy shift.
東京CPI急加速 — The Ultimate Summary
A Leading Indicator Flashes a Sharp Acceleration
The Tokyo 23-ward CPI, published roughly three weeks ahead of the national figure by Japan’s Ministry of Internal Affairs and Communications (MIC), is widely watched as Japan’s earliest inflation signal. For September 2026, the headline index rose 2.7% year-on-year, core CPI (ex-fresh food) rose 2.7%, and core-core CPI (ex-fresh food and energy) rose 3.0% — each up 0.8 to 1.0 percentage points from August.
“The year-on-year increase in the headline index widened by 0.8 points, from 1.9% in August to 2.7% in September,” according to the MIC release.
Context for International Readers
Unlike the U.S. CPI (released monthly by the Bureau of Labor Statistics) or the Eurozone HICP, Japan’s Tokyo CPI serves a unique function: it is a sub-national proxy report published before the national figure, giving investors an early read on inflation momentum. The Bank of Japan (BOJ) and Ministry of Finance both monitor this release closely ahead of policy meetings.
How Unusual Is This Jump?
Core-core CPI at 3.0% is the highest reading since January 2026, when it stood at 2.3%, following a steady decline through mid-2026 (to as low as 1.5% in May). The headline figure of 2.7% matches levels last seen in November 2025.
Market Implications
A surprise acceleration of this magnitude typically fuels speculation about an earlier or faster BOJ rate-hike path, which could support the yen and pressure Japanese Government Bond (JGB) prices. However, as the next slides explore, much of this jump appears driven by one-off institutional factors rather than pure demand-pull inflation — a nuance that matters greatly for how the BOJ interprets the data.
The next national CPI release is scheduled for October 2.
全国と東京の比較 — データで見る変化
National and Tokyo Figures Diverge
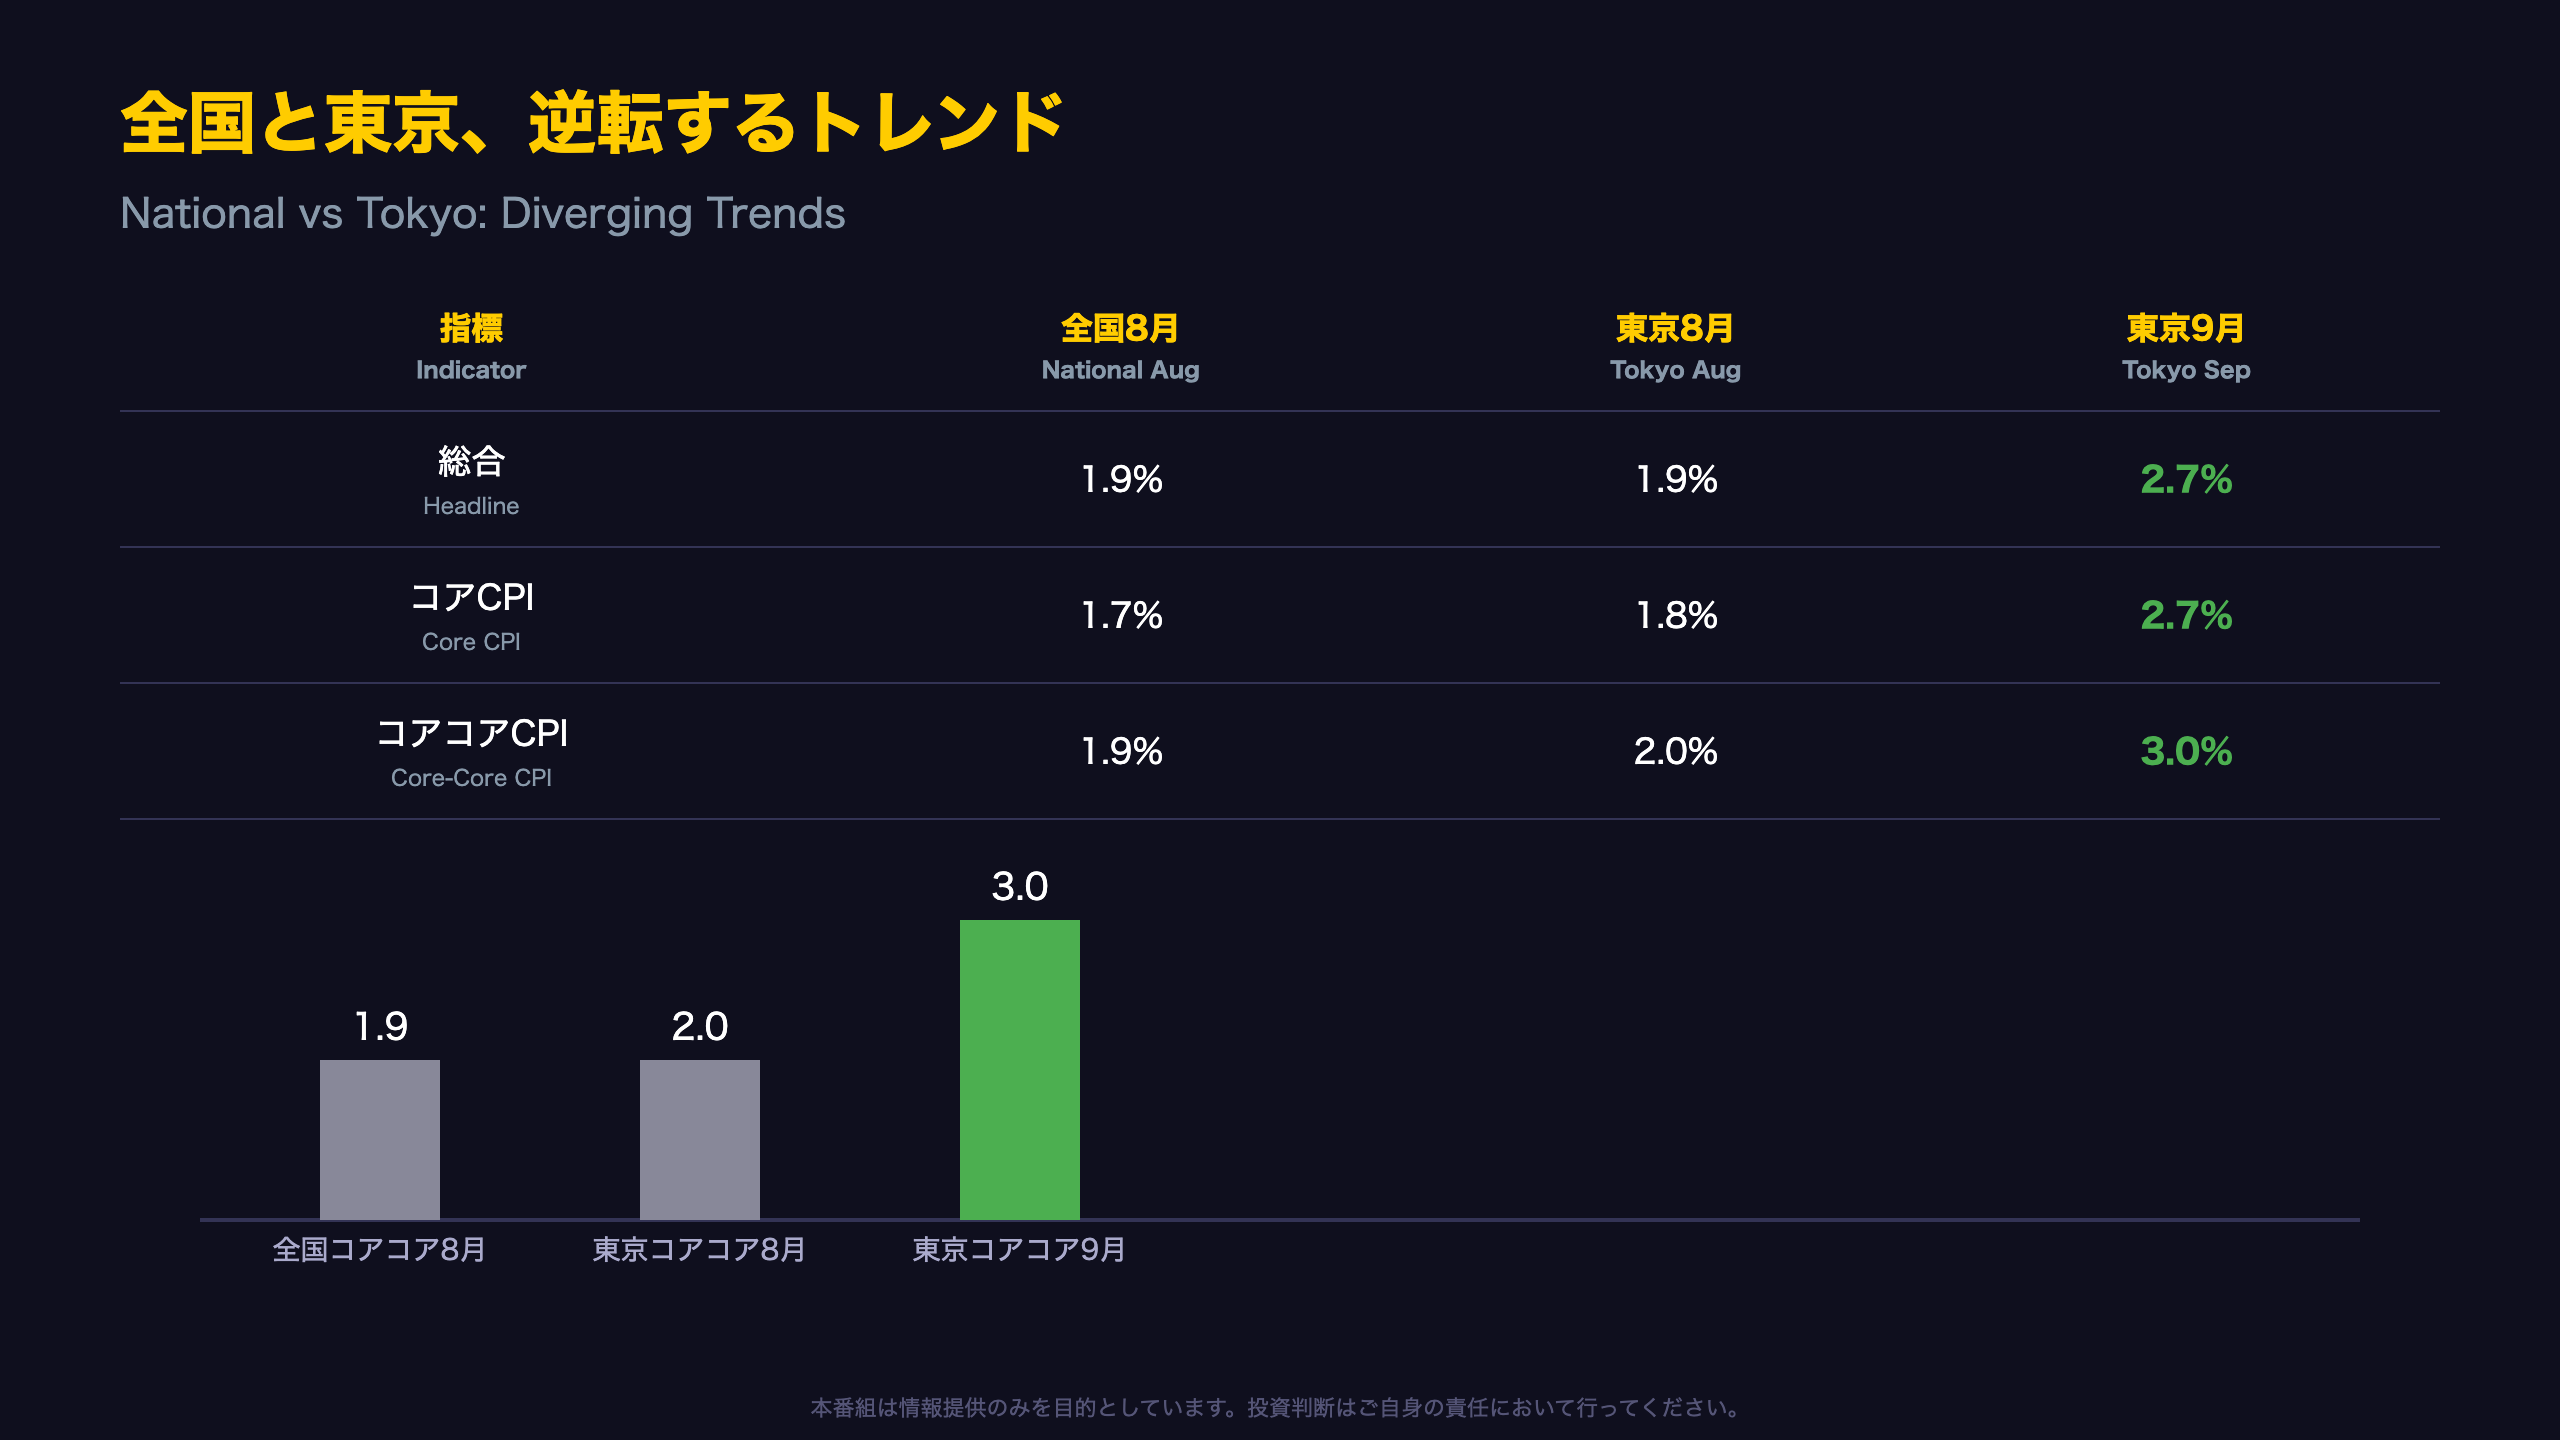
Japan’s national CPI for August (released September 18 by MIC) showed a decelerating trend: core CPI at 1.7% (down from 1.8% in July) and core-core flat at 1.9%. National energy prices were down 0.7% year-on-year, partly reflecting the government’s gasoline tax relief measures.
Tokyo Moves in the Opposite Direction
In stark contrast, Tokyo’s core CPI jumped from 1.8% in August to 2.7% in September, and core-core from 2.0% to 3.0%. This divergence highlights how Tokyo-specific institutional factors — water tariffs and childcare subsidies — can create sharp, temporary dislocations between the leading indicator and the national trend.
Unusually Large Month-on-Month Moves
Seasonally adjusted month-on-month changes were striking: +0.6% for the headline, +0.9% for core, and +0.7% for core-core. These figures dwarf the typical range seen over the past year (roughly -0.1% to +0.4%), suggesting a concentration of one-off price adjustments rather than broad-based momentum.
For Readers Familiar with the Fed/ECB Framework
Unlike the U.S. Fed, which targets PCE inflation with less month-to-month volatility, Japan’s CPI framework retains administered prices (utilities, childcare) that can swing sharply due to local government policy changes — a nuance international investors should weigh carefully when comparing Tokyo’s reading to global inflation benchmarks.
急伸の正体 — 水道料と保育料の寄与度
Decomposing the Surge: Institutional Drivers Dominate
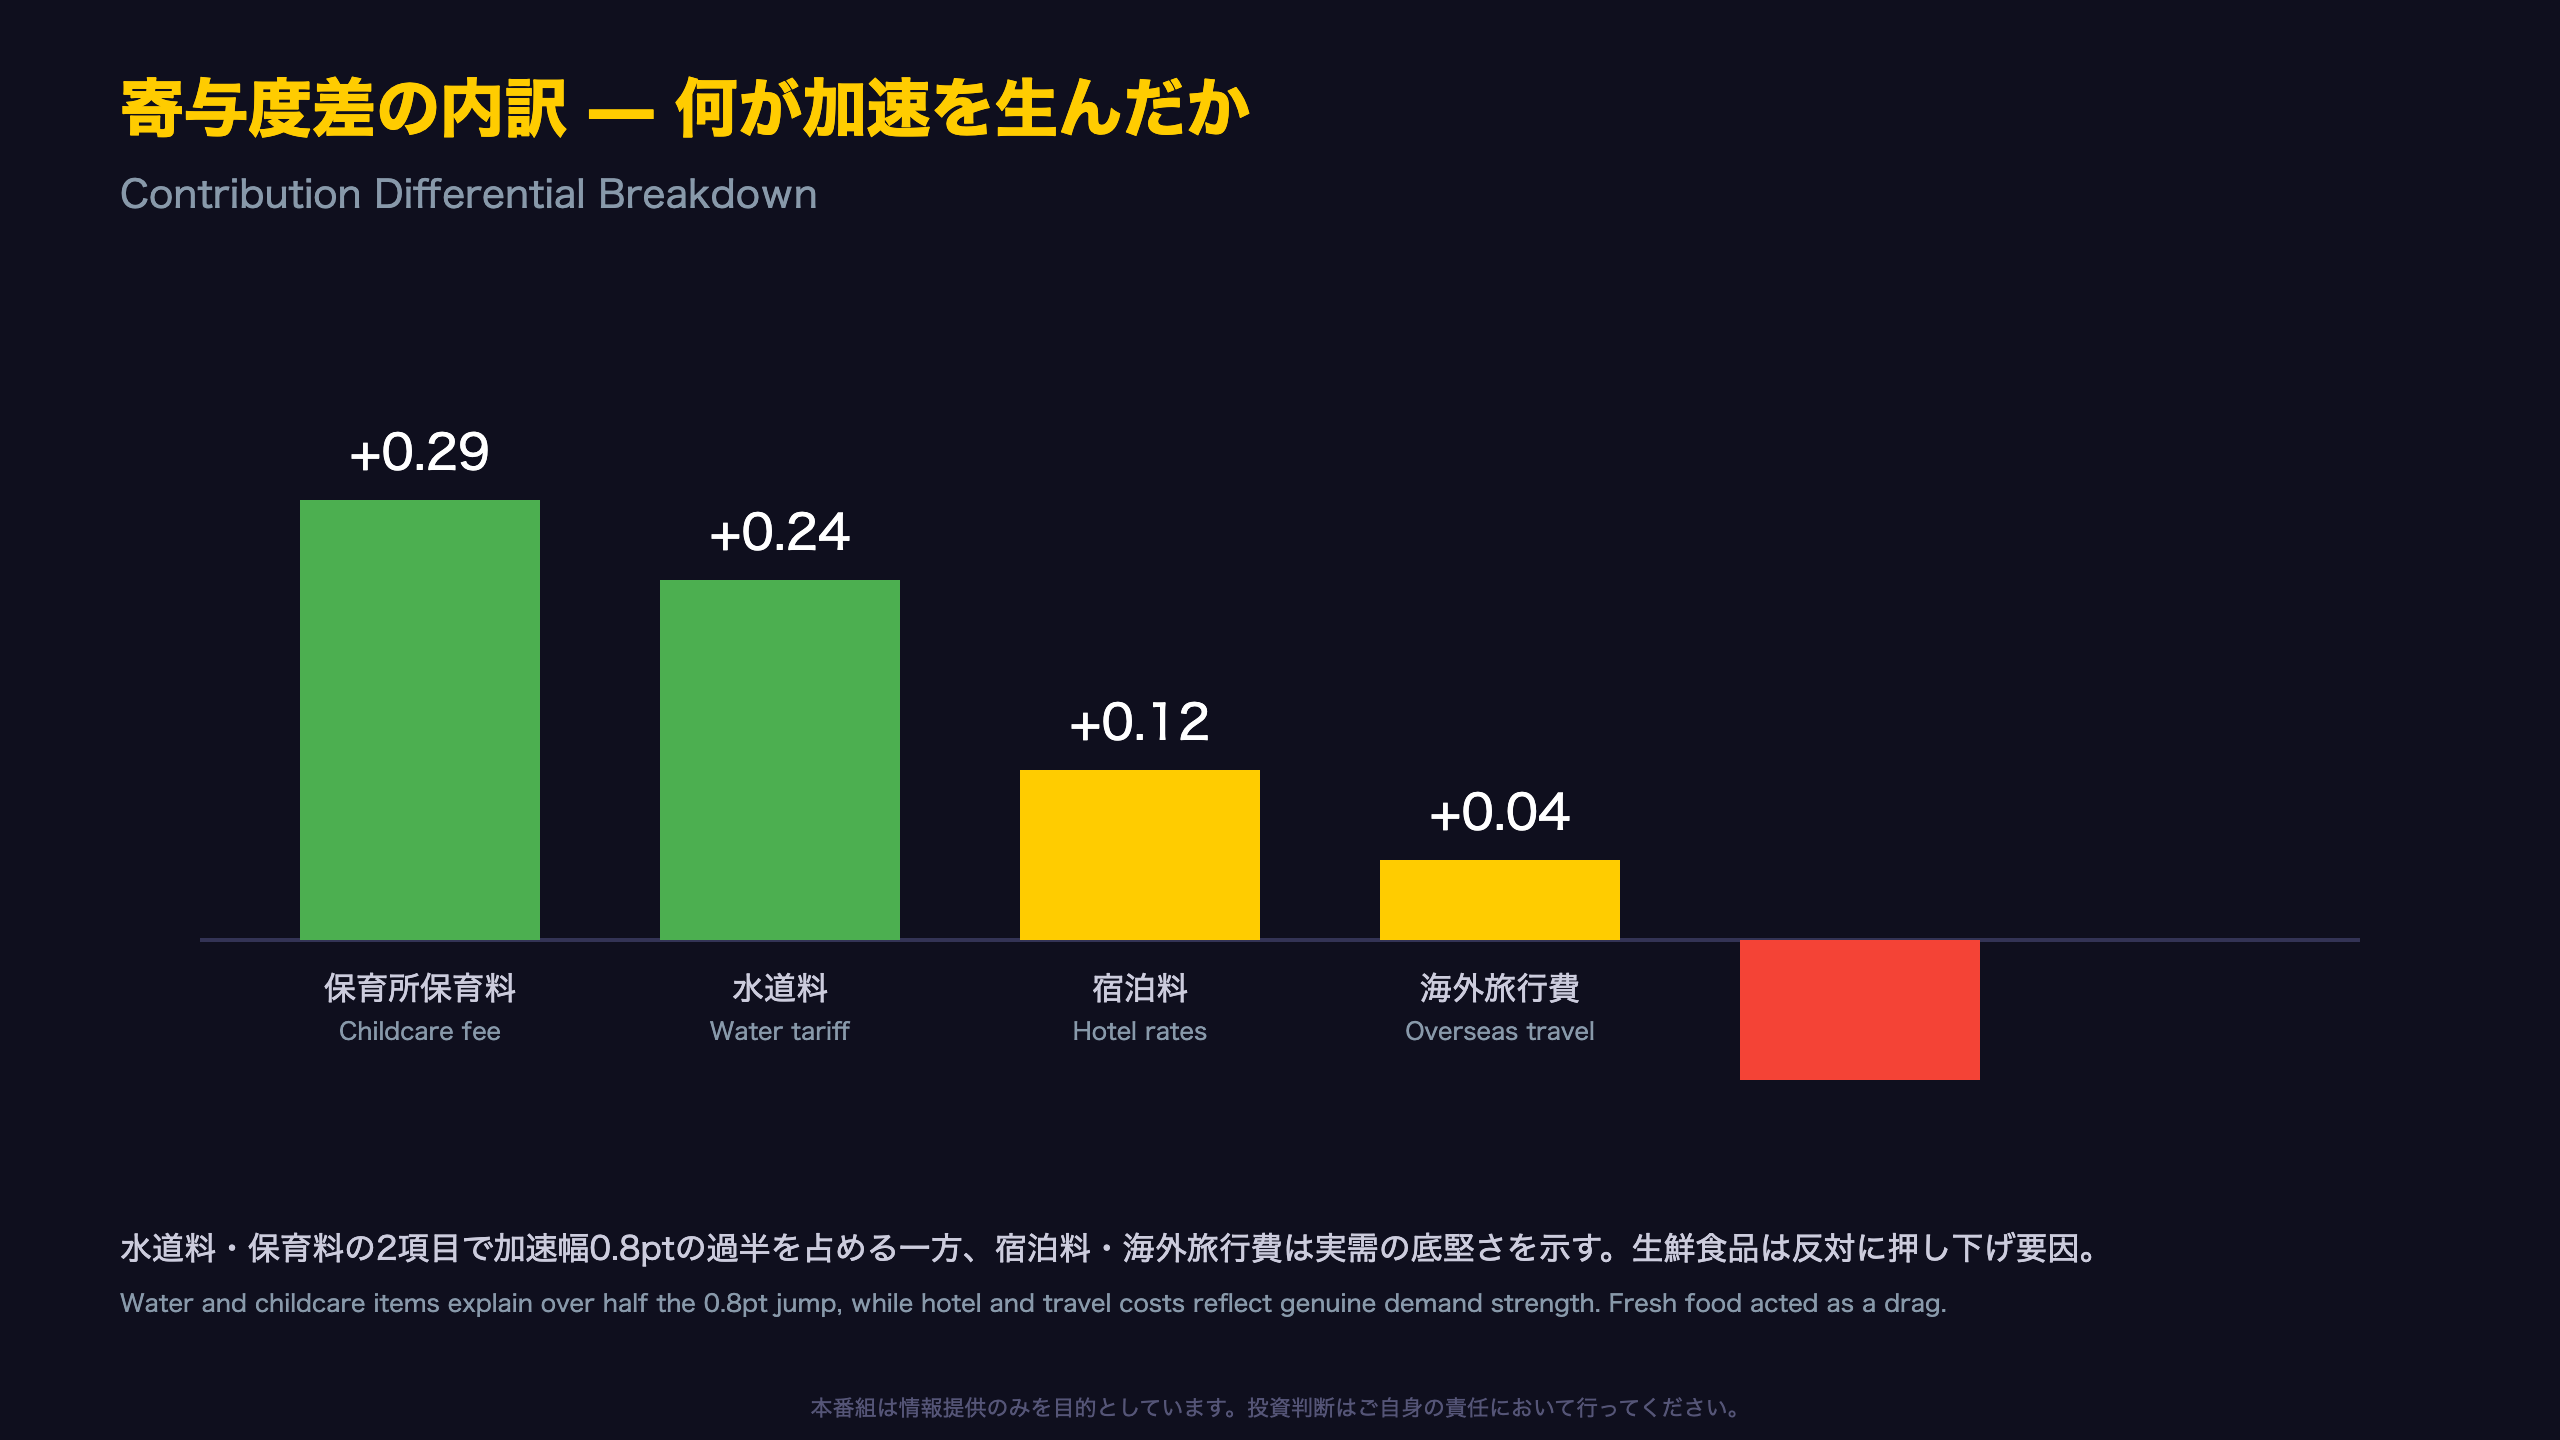
The 0.8-point acceleration in Tokyo’s headline CPI cannot be explained by broad demand growth alone. A line-by-line contribution analysis reveals a story dominated by administrative price resets.
Water Tariffs: The Single Largest Driver
Water and sewerage charges rose 29.5% year-on-year (weight 54, contribution 0.24 points), with water tariffs specifically up 65.6%. This reflects a Tokyo Metropolitan Government fee schedule revision, not a market-driven price increase.
Childcare Fee Base-Effect
Childcare fees (hoikujo hoikuryo) remained at -100.0% year-on-year (contribution -0.21), but the contribution differential versus August was +0.29 points — the largest single swing factor. This reflects a shift in the year-ago comparison base tied to Tokyo’s childcare fee waiver expansion in 2025, not an actual increase in household childcare costs.
“Childcare fees widened the headline’s year-on-year increase by 0.29 points,” the MIC report states.
Genuine Service-Sector Strength Also Present
Hotel rates swung from -1.4% to +4.6% year-on-year (contribution differential +0.12), and overseas package tour costs rose 23.5% (+0.04), both reflecting yen weakness and inbound tourism recovery — arguably genuine demand-side price pressure, distinct from the administrative factors above.
Two Readings, Both Valid
Inflation hawks may view persistent service-price gains as evidence of entrenched inflation momentum. Inflation skeptics could counter that, stripping out water tariffs and childcare base-effects, underlying inflation remains in the high-1% range — far from alarming. Both readings are consistent with the data; neither should be treated as definitive.
基調インフレの点検 — エネルギーと食料
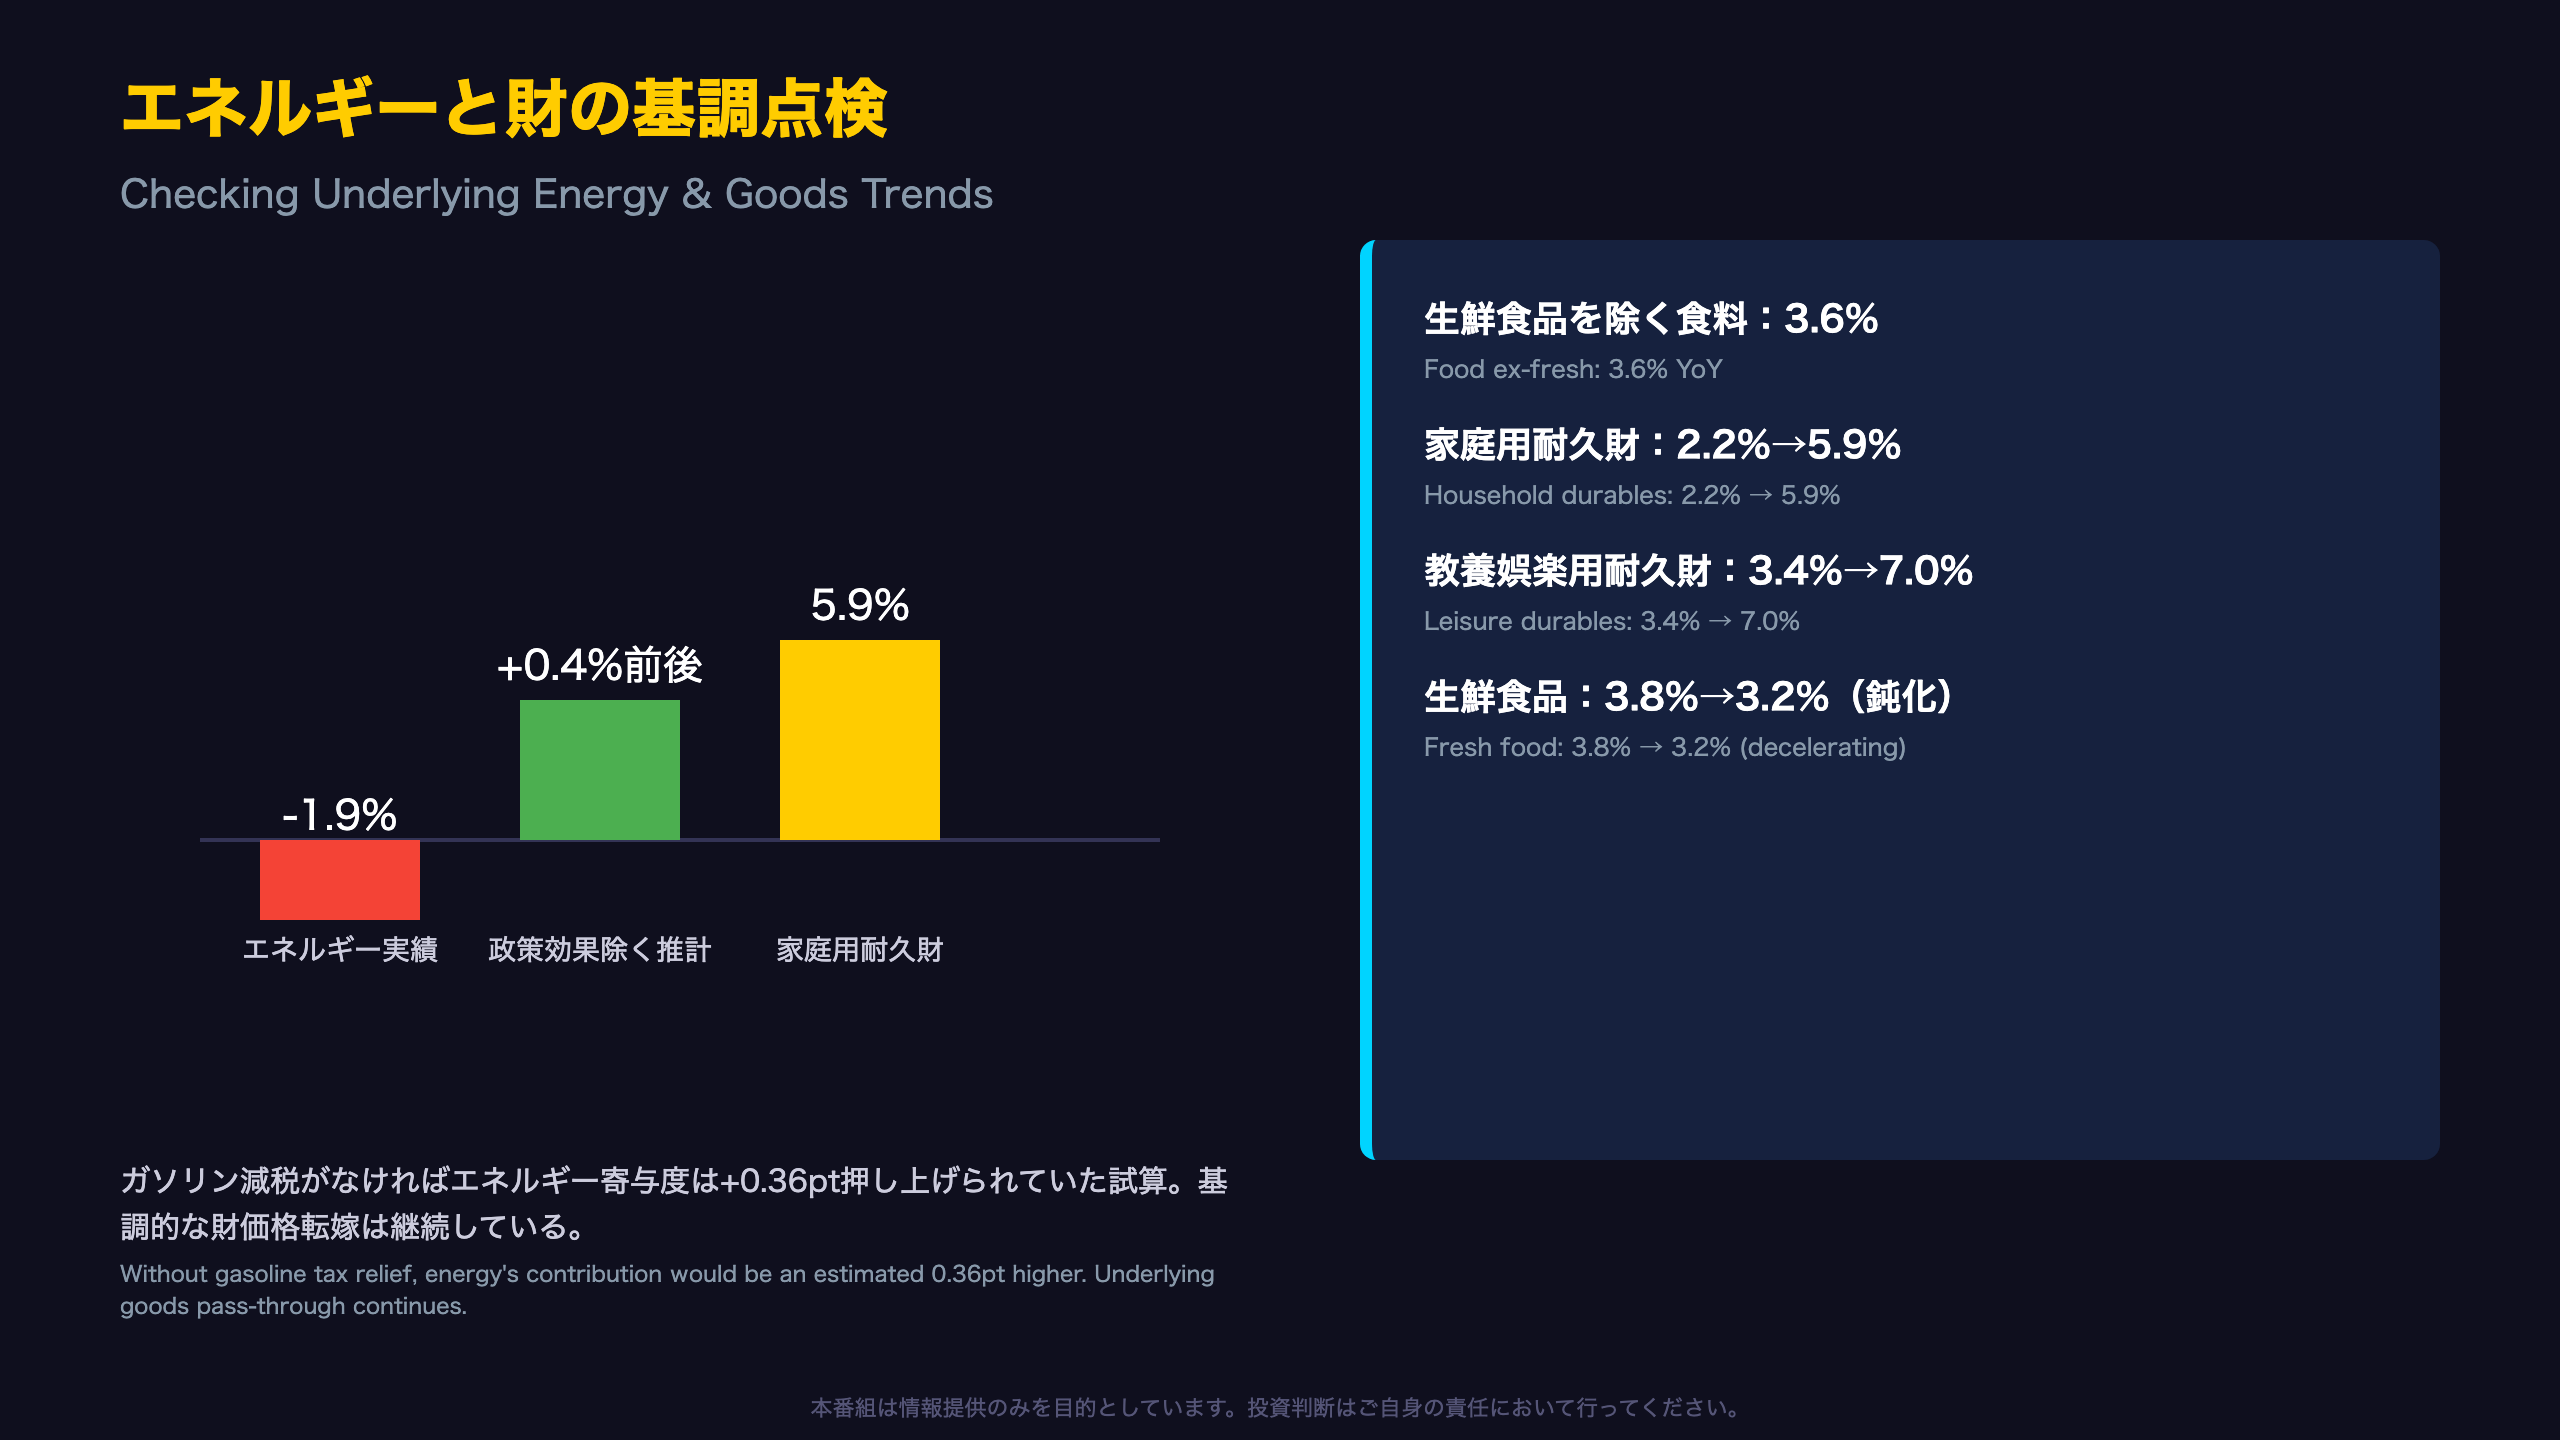
Strip Out Policy Effects, and Energy May Already Be Rising
Headline energy prices fell 1.9% year-on-year (contribution -0.08), which on the surface looks disinflationary. But the official release includes a crucial caveat.
“Estimated contribution of the gasoline provisional tax rate abolition and related policy effects: Energy -0.36 (-0.65 current month, +0.29 base-effect reversal),” according to the MIC data.
This estimate implies that, absent the temporary gasoline tax relief, energy’s year-on-year contribution would have been roughly 0.36 points higher — suggesting underlying energy prices, stripped of policy intervention, may already be trending upward. This is a critical nuance for investors used to reading energy CPI components at face value, as is common in U.S. CPI analysis.
Durable Goods and Food Show Persistent Pass-Through
Food excluding fresh items held flat at 3.6% year-on-year (contribution unchanged at 0.83), continuing its extended plateau at an elevated level.
More notably, durable goods accelerated sharply: household durables rose 5.9% (up from 2.2% in August, contribution differential +0.04) and leisure durables rose 7.0% (roughly doubling from 3.4%, contribution differential +0.03). Unlike the water and childcare items, these reflect genuine cost pass-through from a weaker yen and rising labor costs — not one-off administrative changes.
A Balanced Read
Fresh food inflation decelerated to 3.2% (contribution -0.15) as vegetable prices fell back (-5.3%), partially offsetting the headline’s upward pressure. The data, taken as a whole, reflects two forces working simultaneously: a temporary institutional spike and a steady, ongoing pass-through of costs through goods and services.
The next national CPI release is due October 2, and markets will be watching closely whether Tokyo’s institutional factors — or its underlying service-price strength — carry through to the national figures. The key question for the BOJ will be whether this acceleration changes the calculus on the pace of future rate normalization.
Disclaimer: This article is for informational purposes only. All investment decisions are made solely at your own risk.







