📺 Watch the Full Video Analysis
This article was automatically generated by the NFC Market Live AI analysis system. (Updated: 2026-08-28 08:42 JST)
📄 Primary Source
総務省統計局
https://www.stat.go.jp/data/cpi/sokuhou/tsuki/pdf/kubu.pdf
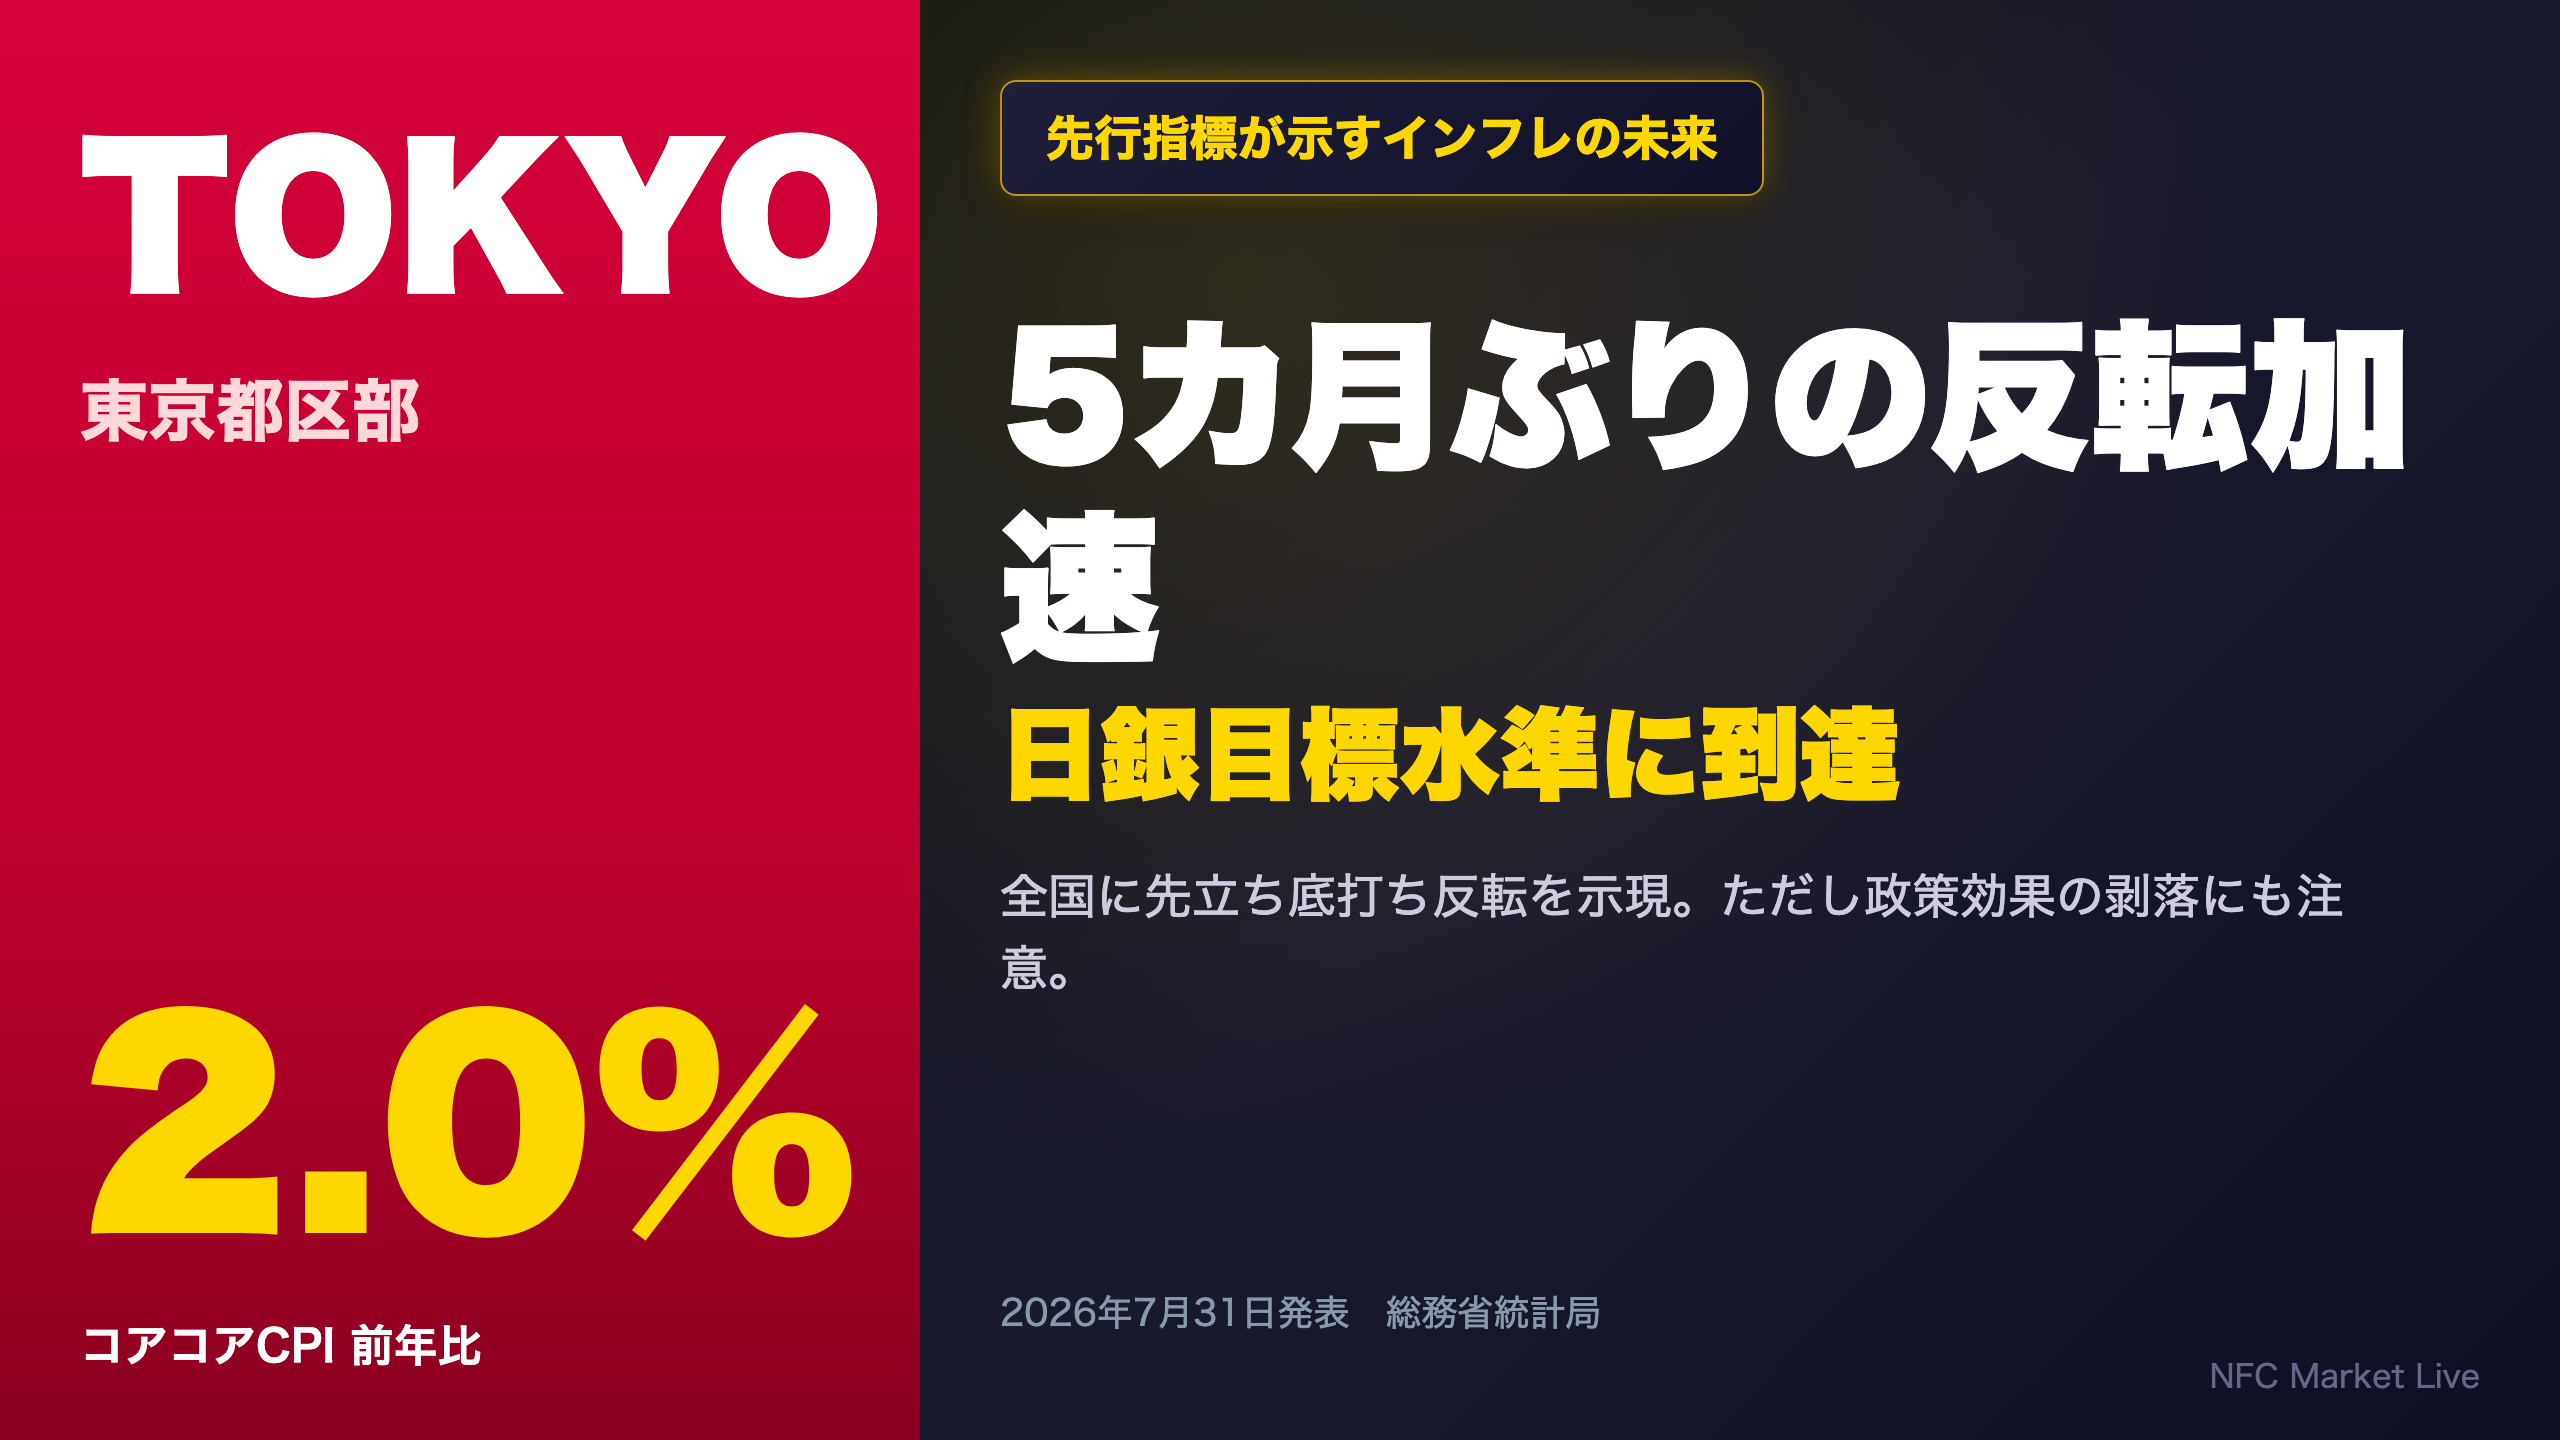
📊 Japan’s Ministry of Internal Affairs released the Tokyo 23-Ward CPI for July 2026.
Headline inflation accelerated to +2.0% YoY, and core-core inflation (ex fresh food & energy) also hit +2.0% — right at the BOJ’s price stability target. This marks a clear reversal after a slowdown trend that bottomed in May.
📈 Tokyo data leads national CPI by about a month. Tokyo’s core-core index bottomed in May, one month before the national reading turned in June-to-July.
⚠️ Caution: part of the acceleration reflects the fading base effect from the gasoline tax exemption policy, not purely organic demand-pull inflation.
💡 We break down what this means for the BOJ’s policy path and whether Tokyo’s stronger food & rent inflation will spread nationwide.
東京都区部CPI、5カ月ぶりの反転加速
Tokyo CPI Marks a Clear Inflation Inflection Point
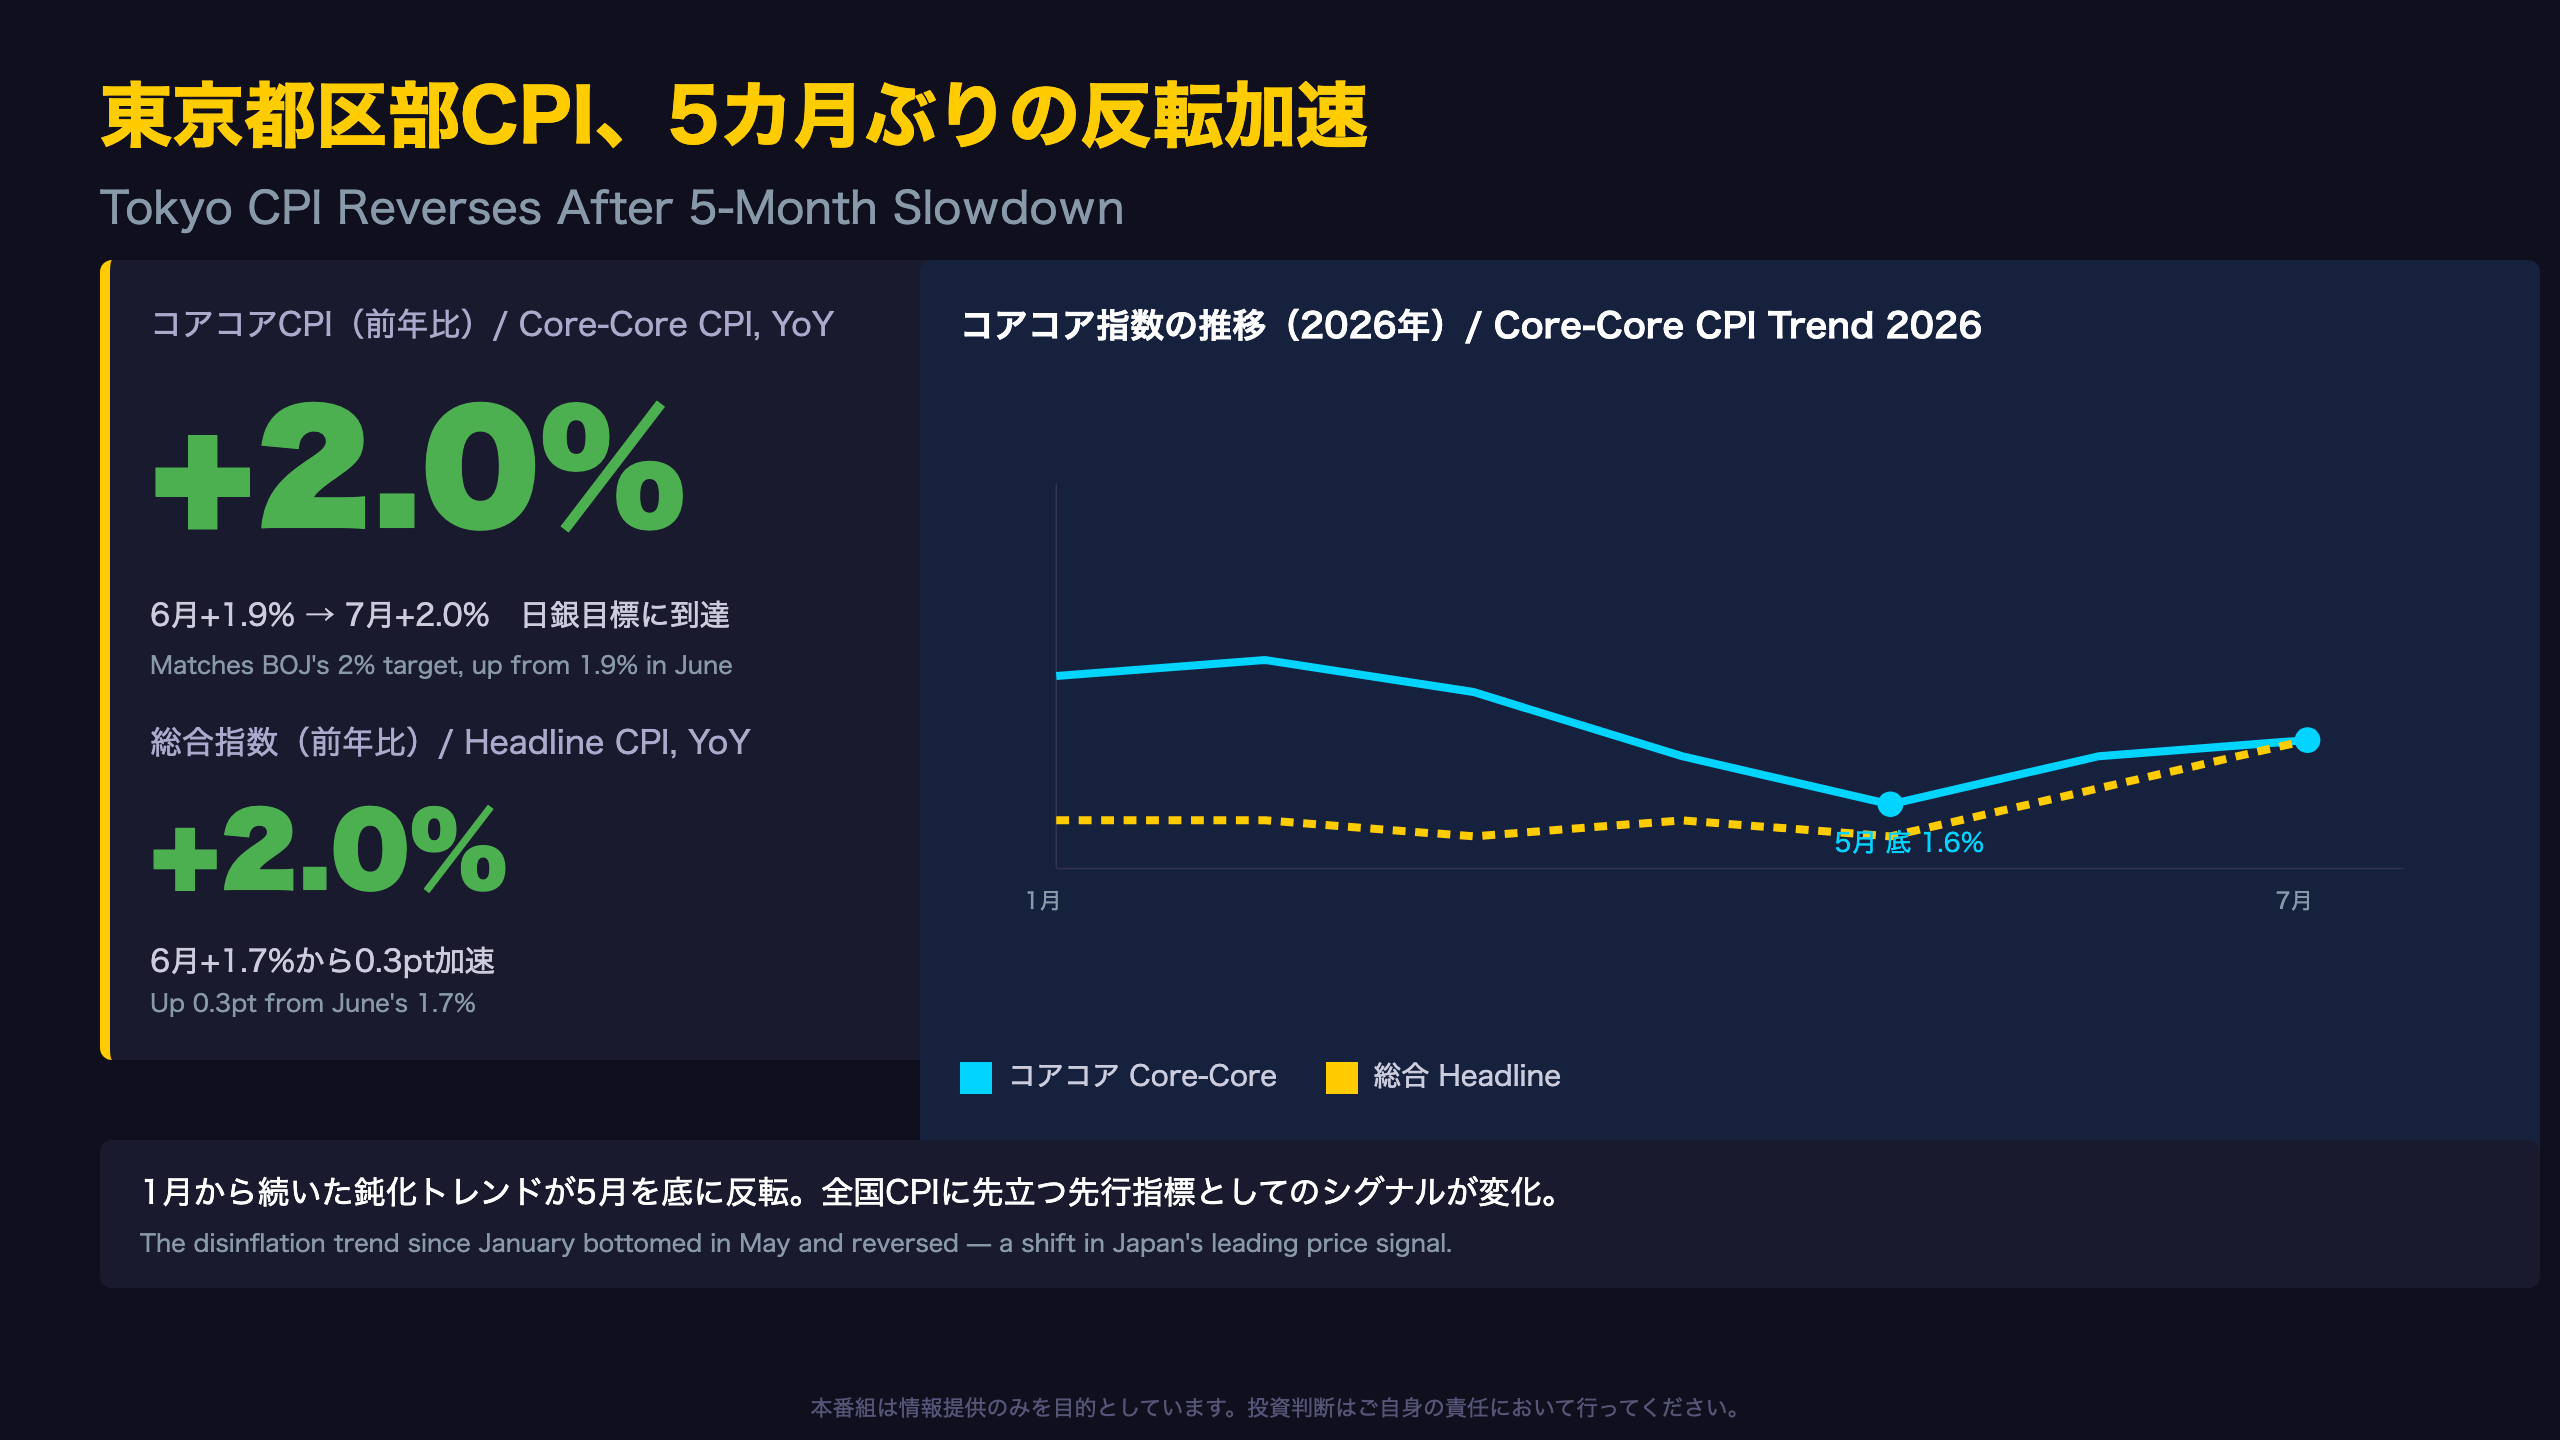
Japan’s Ministry of Internal Affairs and Communications (MIC) released the Tokyo 23-Ward CPI for July 2026, showing headline inflation at +2.0% YoY, core CPI (ex fresh food) at +1.9%, and core-core CPI (ex fresh food and energy) at +2.0% — precisely matching the Bank of Japan’s (BOJ) long-standing 2% price stability target.
What makes this release notable is the trajectory: core-core inflation had been steadily decelerating from +2.4% in January 2026 down to a low of +1.6% in May, continuing a broader disinflation trend that traced back to +3.1% in mid-2025. The reversal to +1.9% in June and +2.0% in July represents two consecutive months of acceleration — a meaningful inflection point.
For readers unfamiliar with Japan’s CPI reporting structure: unlike the US CPI (released once monthly for the entire country), Japan publishes a Tokyo 23-Ward “flash” estimate roughly three weeks before the national figure, making it the market’s primary early read on nationwide price trends.
Market implication: A firming core-core reading strengthens the case for continued BOJ policy normalization, though a single month of data should not be over-interpreted. The next Tokyo release (August data) is due August 28.
先行指標の証明——東京は全国より1カ月早く底打ち
Quantifying Tokyo’s One-Month Lead
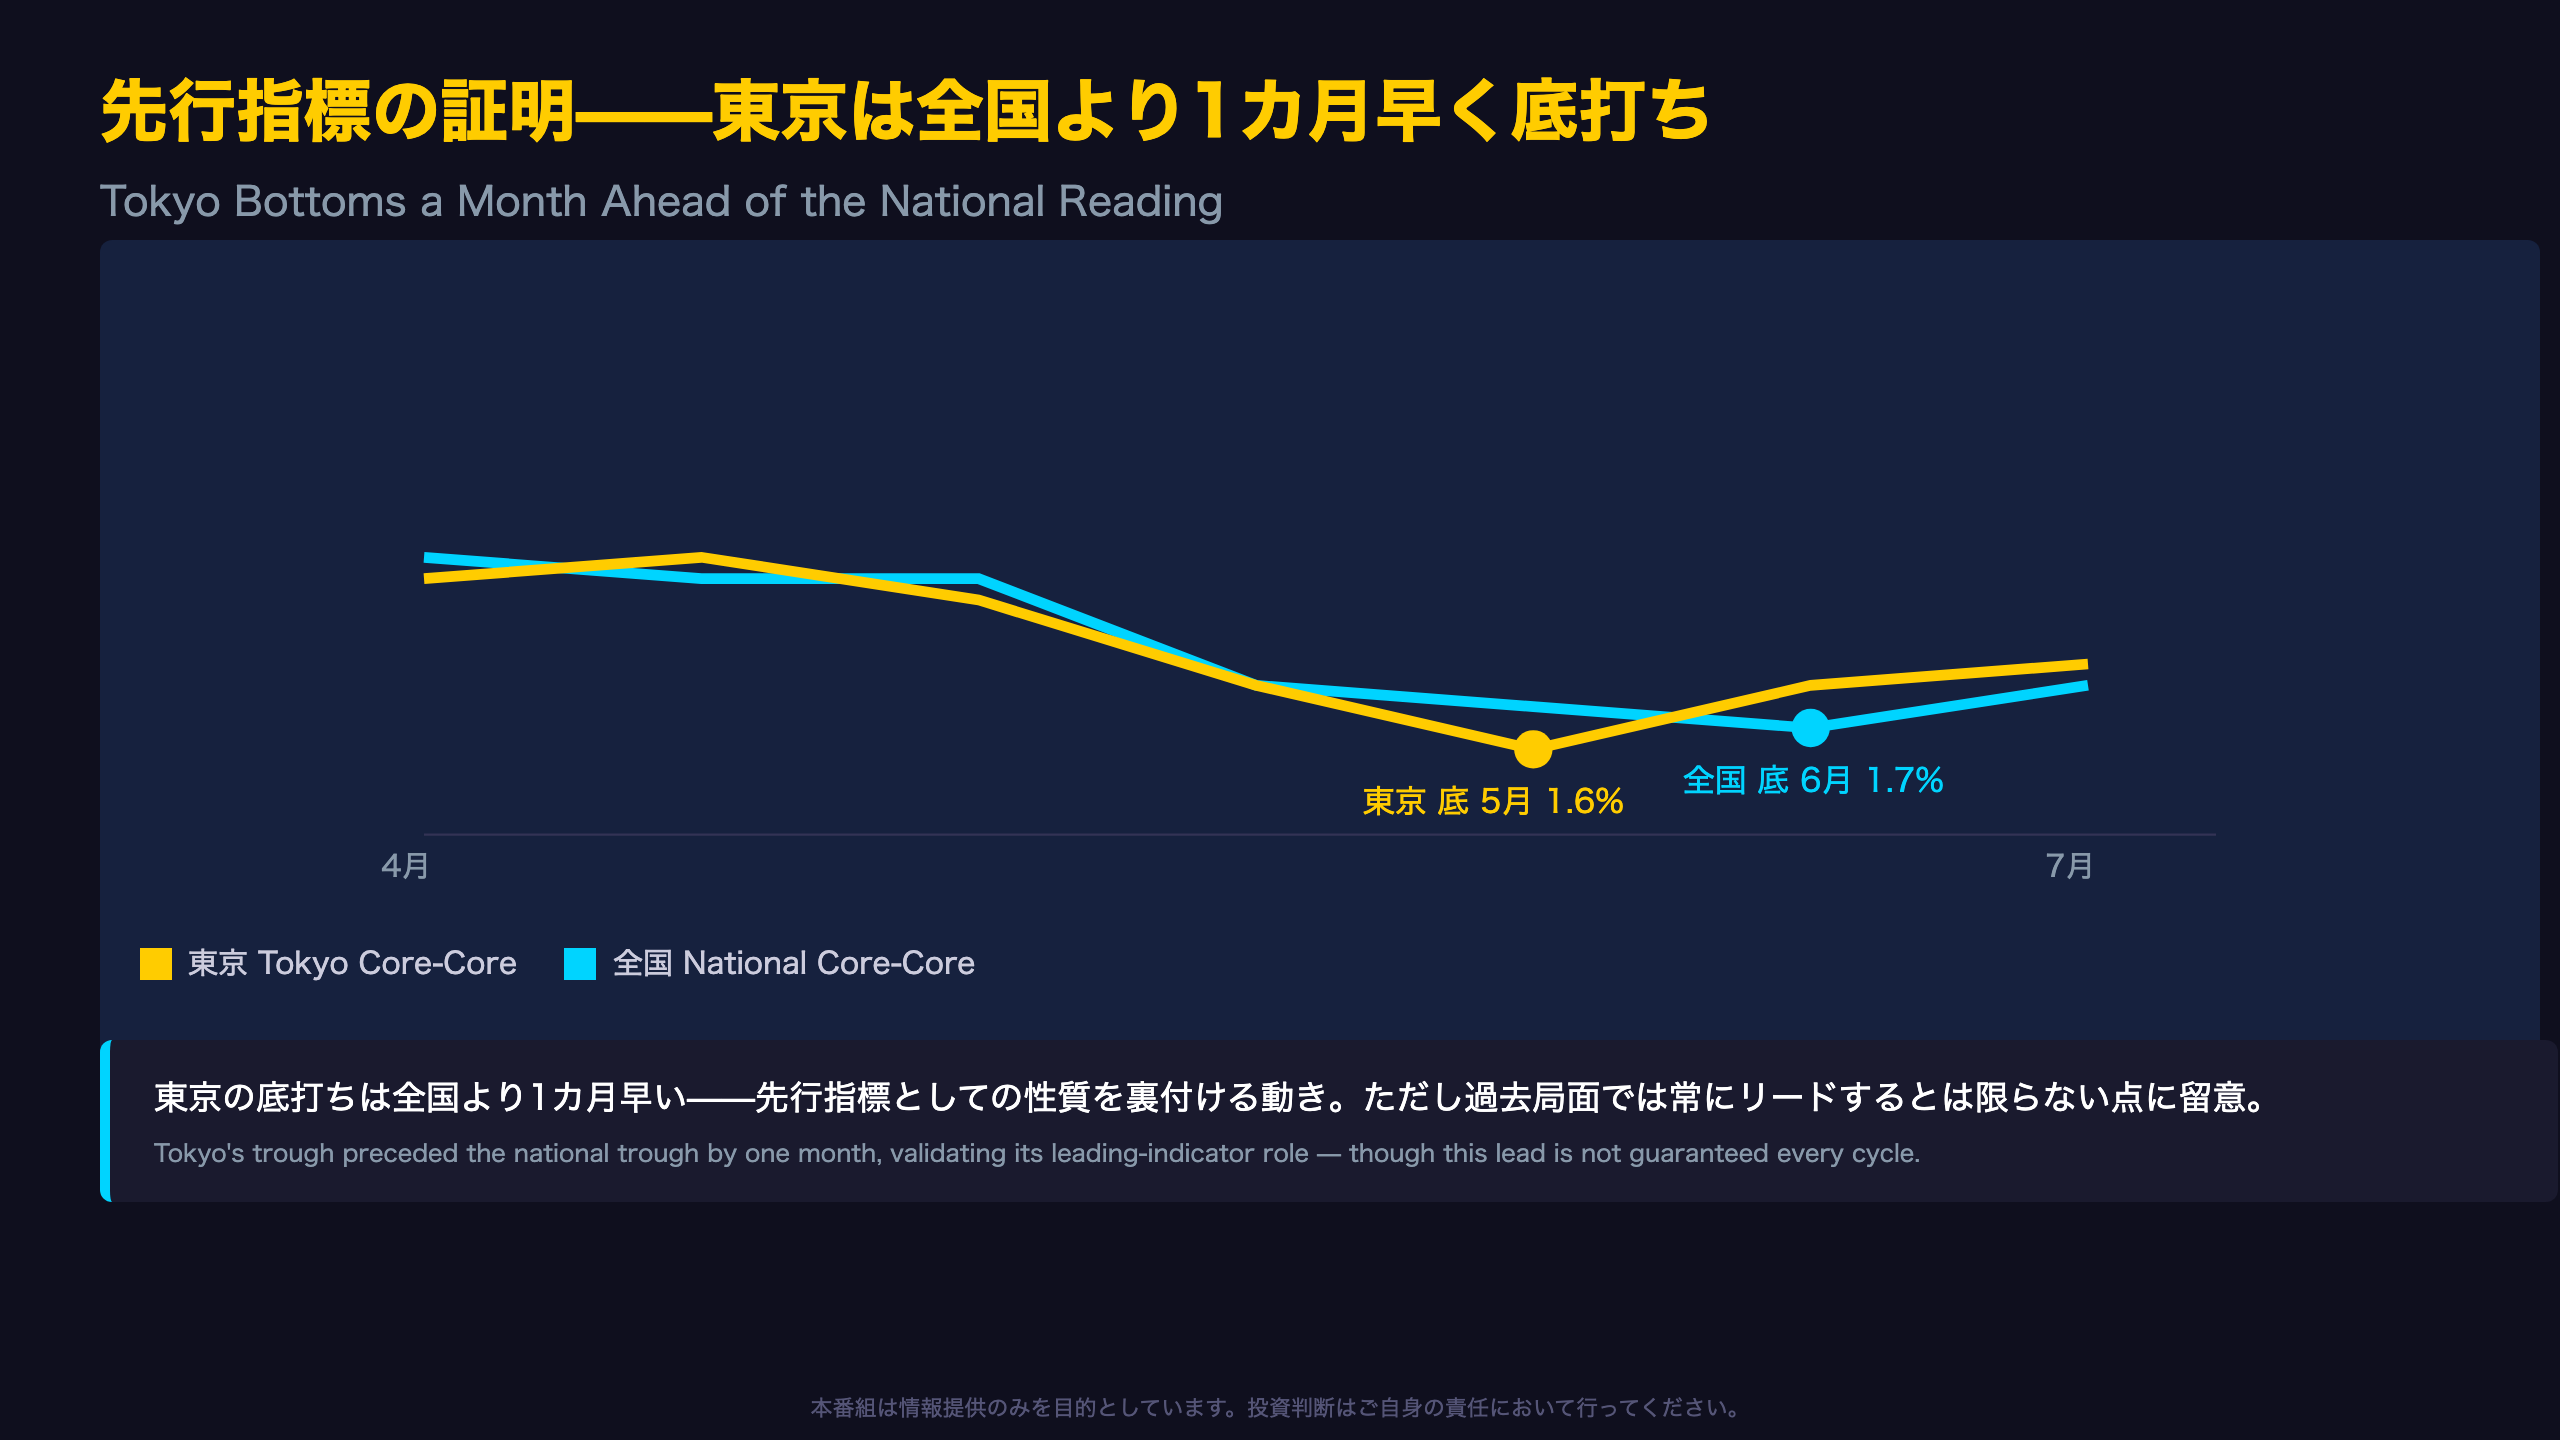
Comparing the monthly path of core-core CPI (ex fresh food and energy) between Tokyo and the national aggregate reveals a clear timing gap:
| Month | Tokyo Core-Core | National Core-Core |
|---|---|---|
| April | +1.9% | +1.9% |
| May | +1.6% (trough) | +1.8% |
| June | +1.9% | +1.7% (trough) |
| July | +2.0% | +1.9% |
Tokyo bottomed in May; the national figure bottomed a month later, in June. This empirically validates the MIC’s own framing of the Tokyo release as a “flash indicator released ahead of the national results.” For context, US investors can think of this similarly to how certain regional Fed surveys (e.g., the Philly Fed or Empire State index) are watched as early reads ahead of national ISM data — though Japan’s Tokyo-national CPI relationship is structurally embedded in the statistics bureau’s own release calendar, not just a market convention.
Caveat: this one-month lead was observed in a single cycle. During the 2025 H2 disinflation phase, Tokyo and national CPI moved almost in lockstep, so investors should treat the lead time as indicative rather than a fixed rule. Differing basket weights — Tokyo’s housing cost weight is notably higher — likely contribute to the phase difference.
加速の内訳——エネルギー基調転換と政策効果の混在
Energy’s ‘Reversal’ Is Partly a Policy Base-Effect Illusion
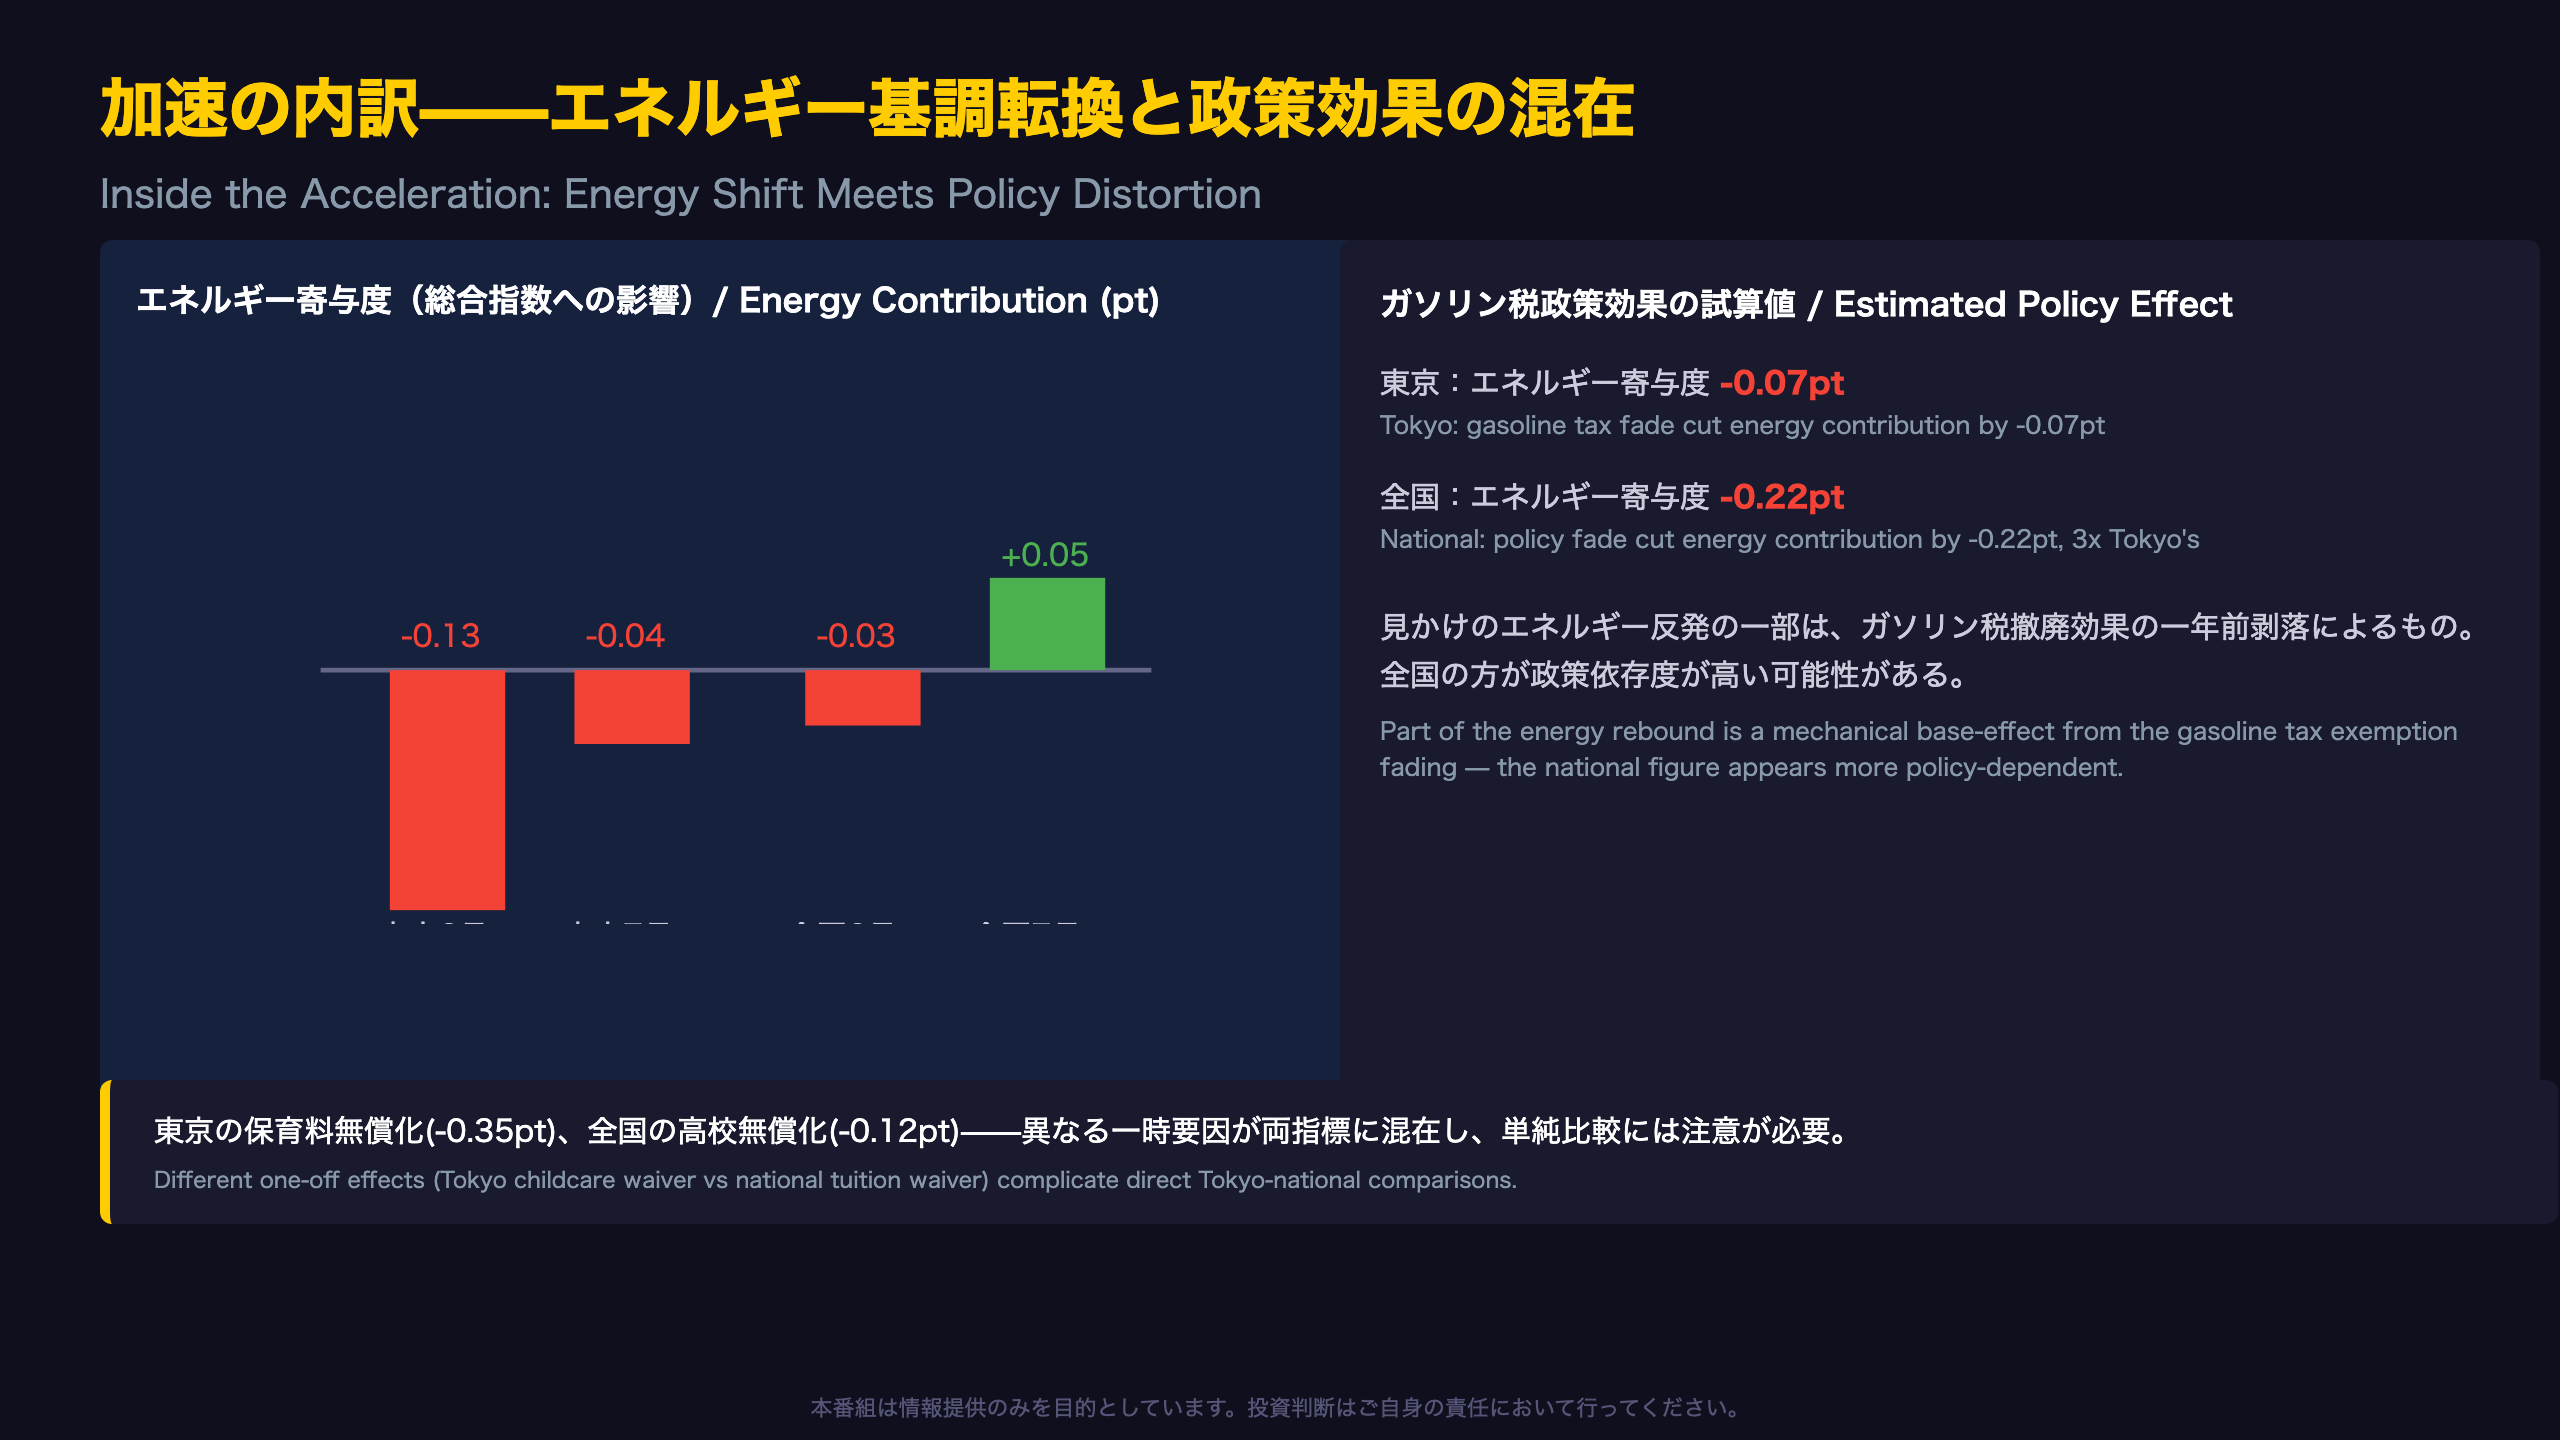
Tokyo’s energy prices fell 0.7% YoY in July, a smaller decline than June’s -2.3%, contributing +0.09 points to headline CPI acceleration. Nationally, energy swung from -0.4% in June to +0.6% in July — an even sharper reversal.
But MIC’s own supplementary estimate reveals a crucial nuance:
“Estimated contribution of the gasoline provisional tax exemption policy: Energy: -0.07pt (Tokyo), -0.22pt (National), reflecting both the current-month effect and the fading of last year’s base effect.”
In plain English: part of what looks like an energy price rebound is actually the mechanical fading of a one-off tax policy from a year ago — not a genuine reacceleration in energy demand or prices. Notably, the national figure’s policy distortion (-0.22pt) is roughly three times larger than Tokyo’s (-0.07pt), suggesting the nationwide energy rebound is even more policy-dependent than Tokyo’s.
Adding to the complexity: Tokyo’s “miscellaneous expenses” category fell -6.5% YoY (-0.35pt contribution) due to a local childcare fee waiver program, while nationally, education costs fell -3.8% (-0.12pt) due to a high-school tuition waiver. These are two different one-off policy effects hitting different categories in each dataset — a reminder that direct Tokyo-vs-national comparisons require careful category-by-category adjustment, a nuance often missed in simplified headline coverage. For US-based readers: this is broadly analogous to how one-off fiscal stimulus checks or utility subsidy programs can distort US CPI subcomponents in a given month.
東京が映す構造的な強さ——食料とサービス、家賃の先行
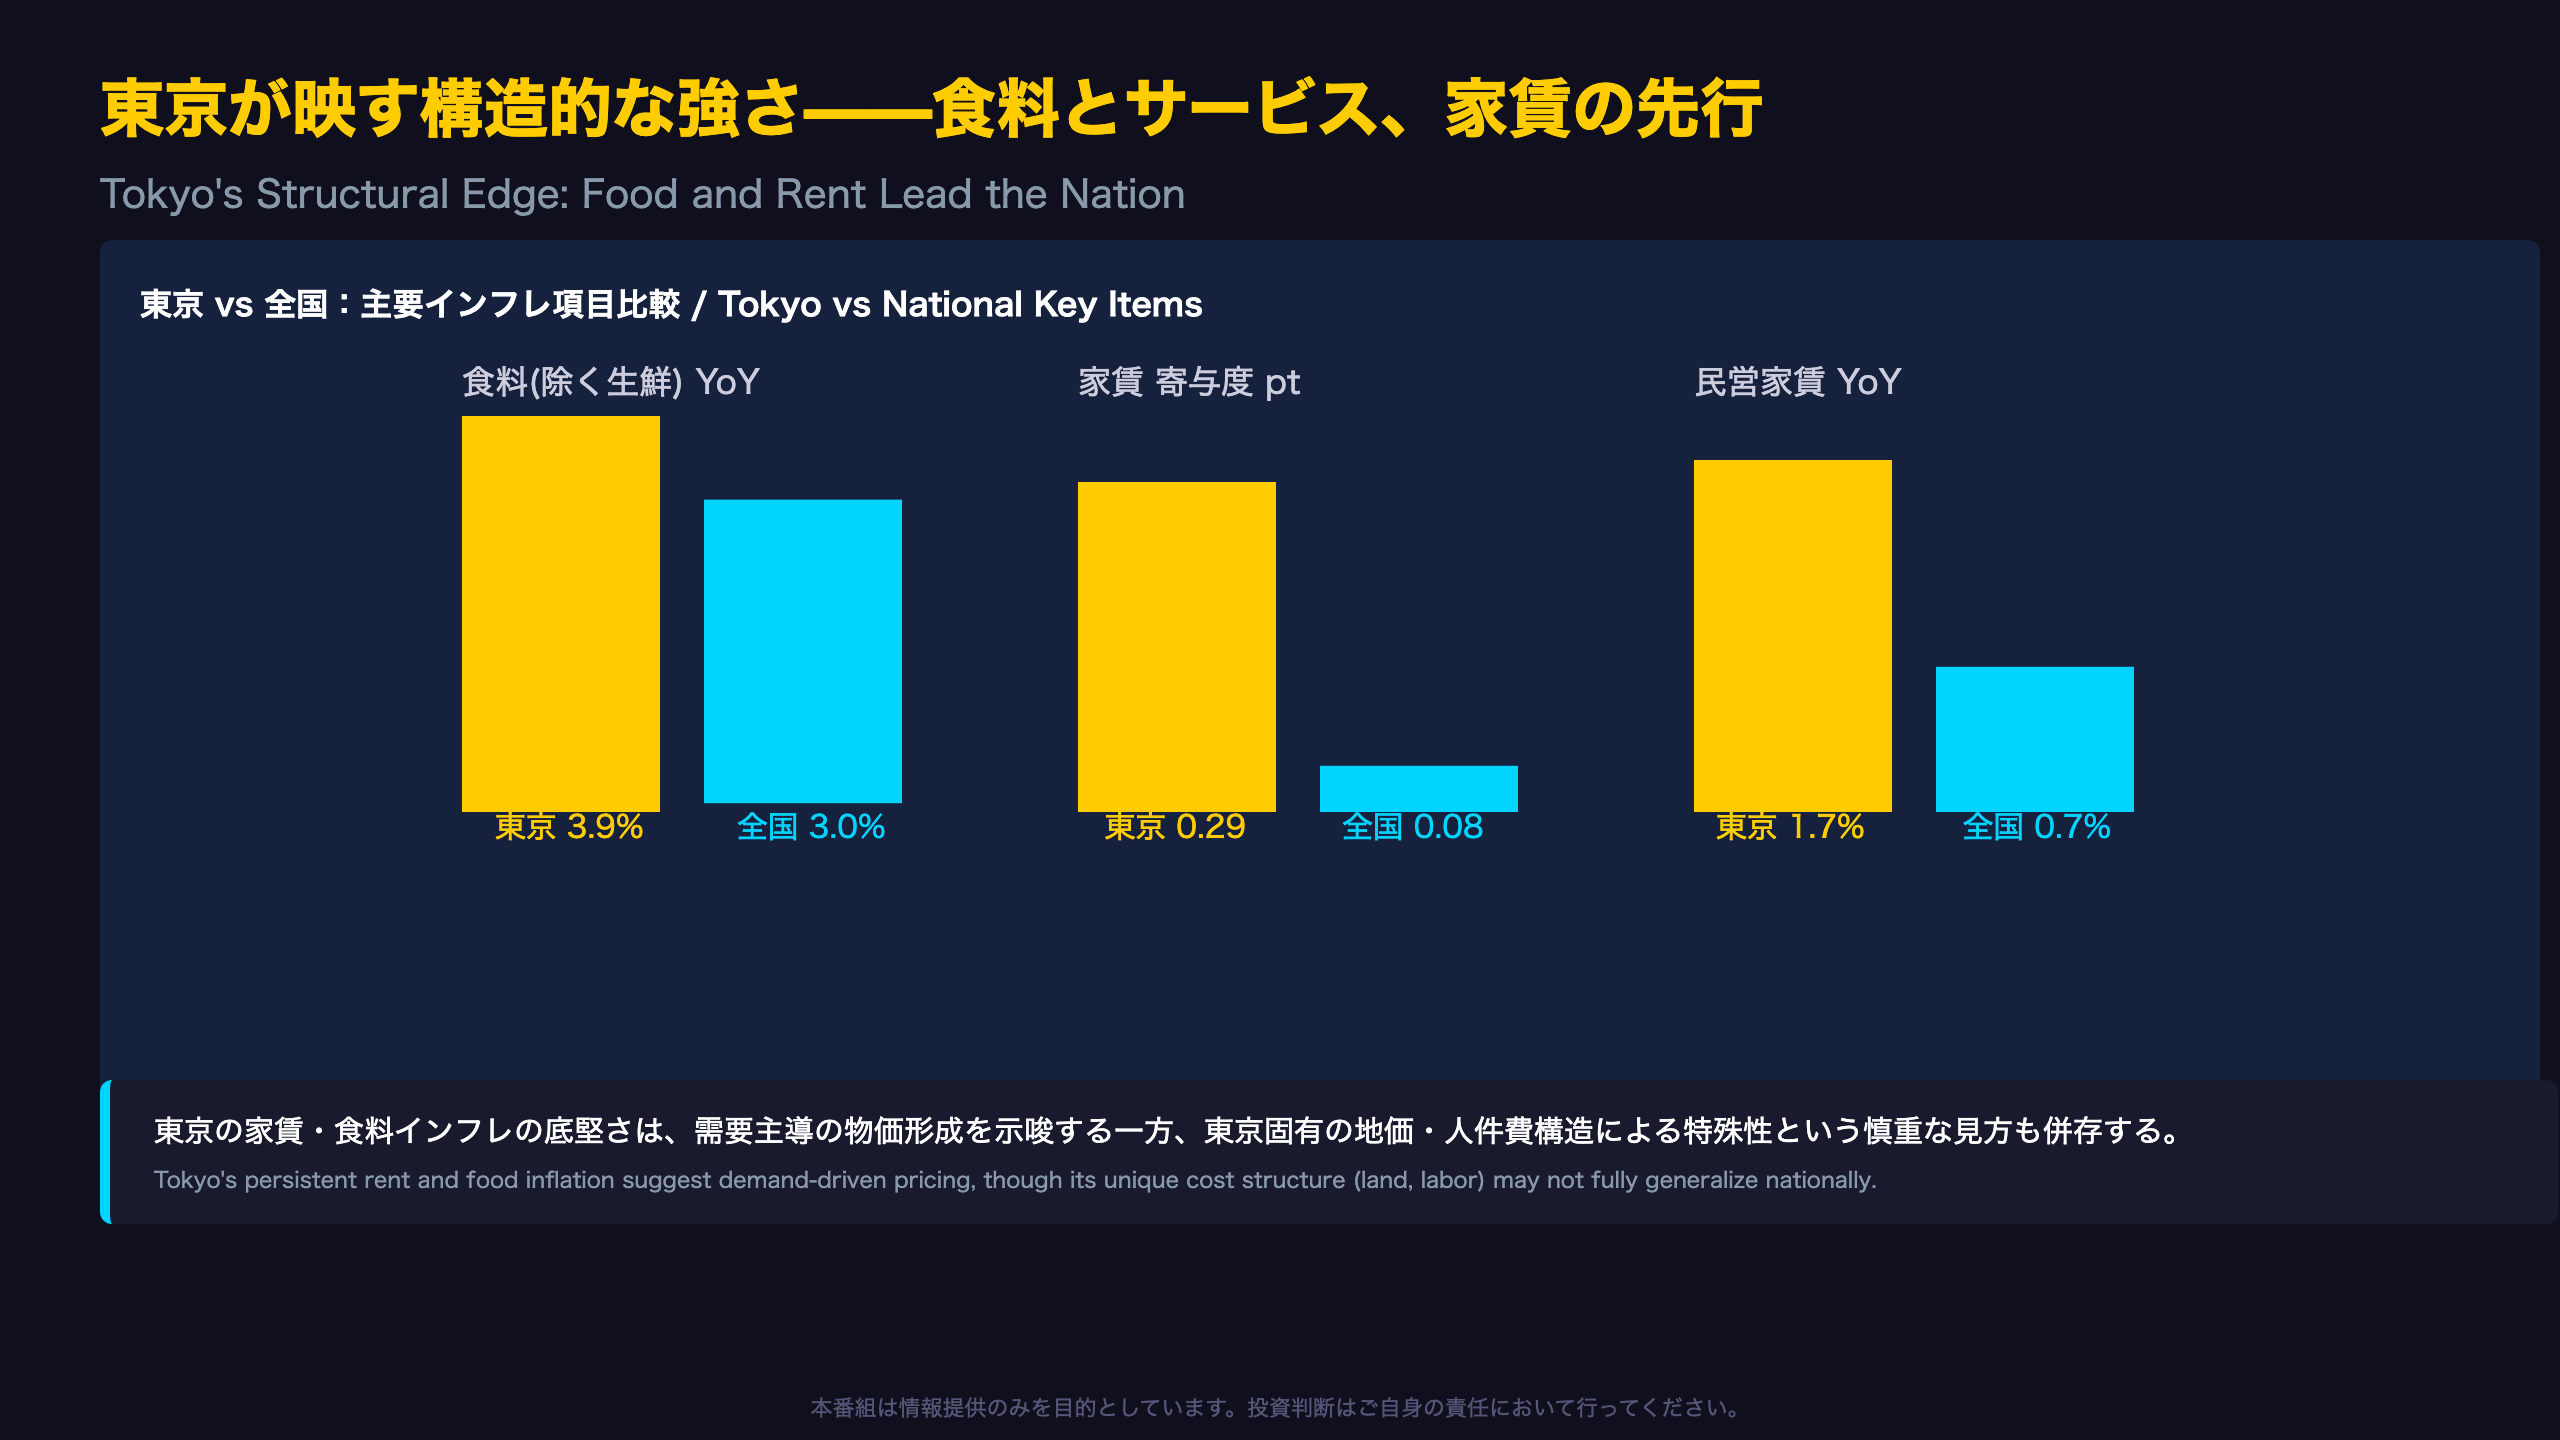
Tokyo’s Structural Edge in Food and Housing Costs
Food inflation excluding fresh items held flat at +3.9% YoY in Tokyo (contributing 0.93pt), while the national figure eased slightly to +3.0% (0.72pt). The 0.9-point gap suggests Tokyo’s dining-out and prepared-food segments — categories highly exposed to labor shortages and wage pass-through — remain more resilient than the national average.
The rent divergence is even starker:
| Category | Tokyo | National |
|---|---|---|
| Rent (overall contribution) | +1.3% (0.29pt) | +0.5% (0.08pt) |
| Private-sector rent | +1.7% | +0.7% |
For context, Japan’s rent index is famously one of the “stickiest,” slowest-moving CPI subcomponents — a structural quirk that differs from the US CPI, where Owners’ Equivalent Rent (OER) is a major, faster-moving driver of core inflation. The fact that Tokyo’s rent contribution is more than triple the national figure likely reflects Tokyo’s tight housing supply and rising property valuations, and could presage a gradual, lagged pass-through to the national rent index over coming quarters.
Bull case: Tokyo’s persistent rent and food inflation strengthen the argument that Japan’s inflation is becoming more demand-driven and structurally embedded — a key precondition the BOJ has cited for sustainable 2% inflation.
Bear/skeptical case: Tokyo’s cost structure (elevated land prices, labor costs concentrated in the capital) is not necessarily representative of the rest of Japan, and a mechanical read-through to the national rent index cannot be assumed without further confirmation.
日銀へのインプリケーション——目標到達、されど見極めが焦点
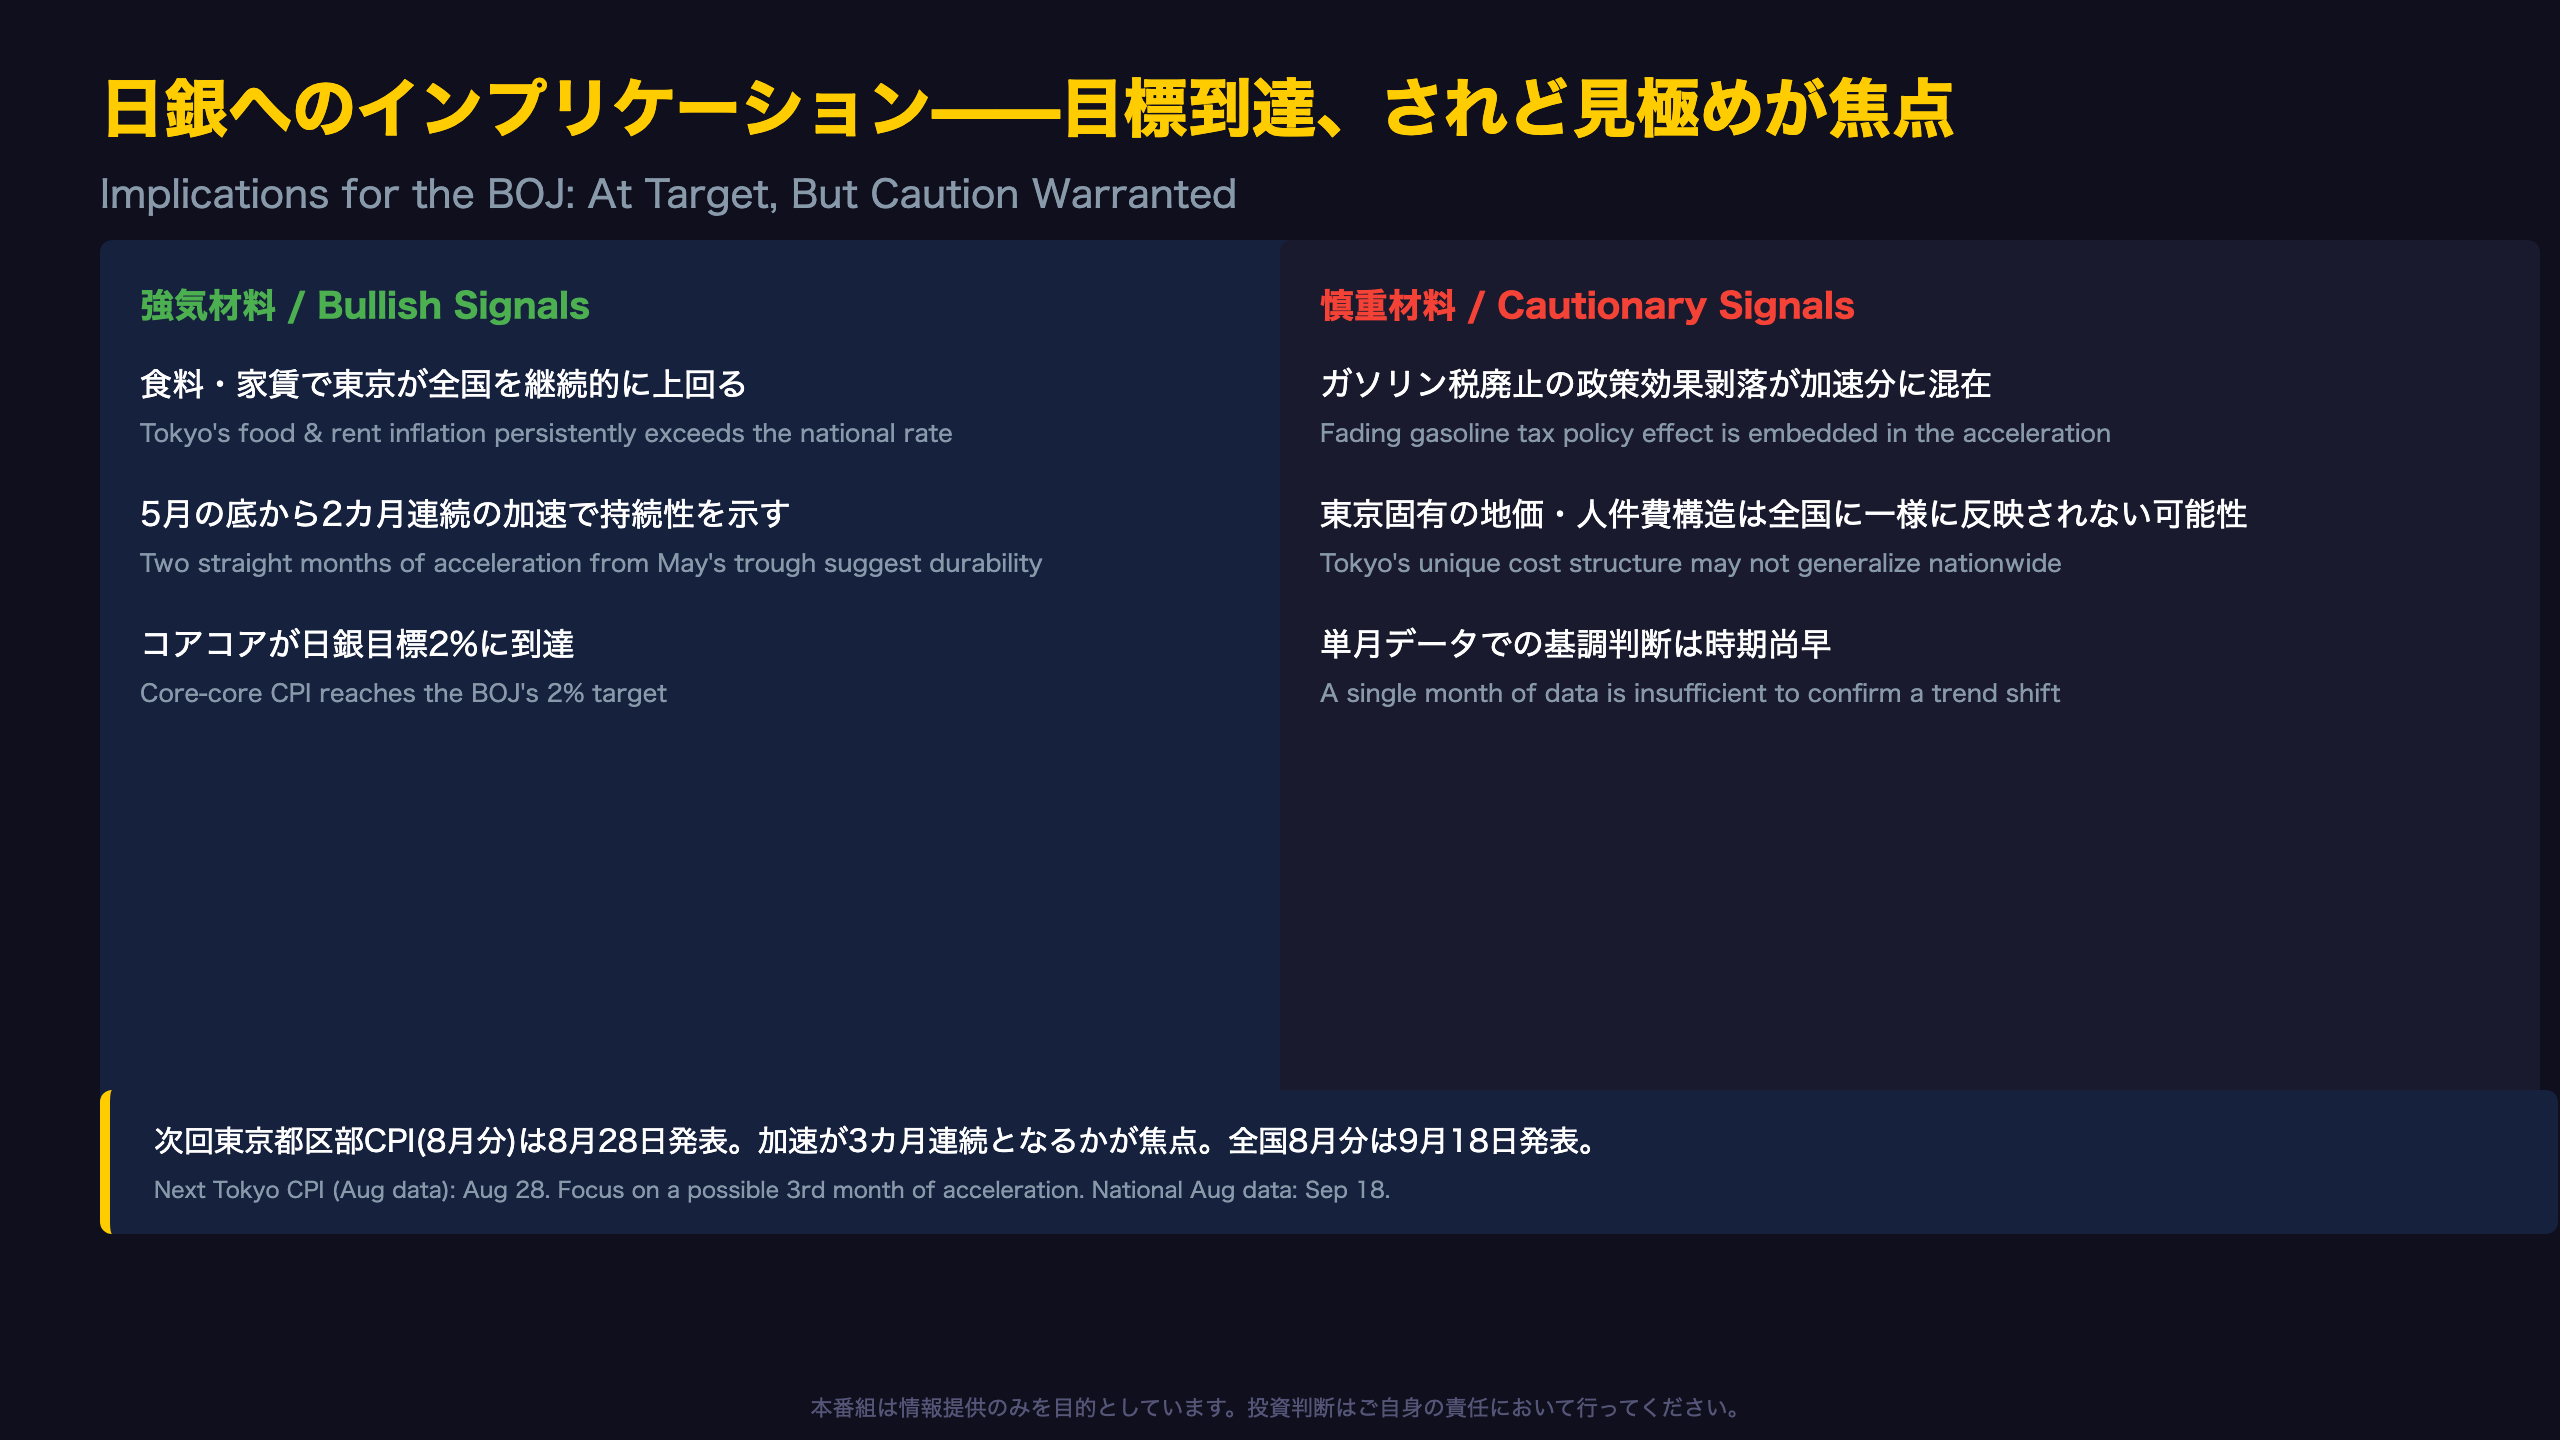
Conclusion: Genuine Reversal or Temporary Noise?
The key takeaway from Tokyo’s July 2026 CPI release is that core-core inflation accelerated for a second straight month from May’s low of +1.6% to +2.0% — precisely matching the BOJ’s price stability target. Combined with the national CPI’s own one-month-delayed reversal, this reinforces Tokyo’s track record as a genuine leading indicator for Japan-wide inflation.
The bull case
- Tokyo continues to outpace the nation in sticky, demand-driven categories like food and rent
- Two consecutive months of acceleration from a clear trough suggests more than mere statistical noise
The cautious case
- Part of the acceleration stems from the fading gasoline tax exemption policy effect, meaning the “underlying” inflation rate may be somewhat softer than the headline suggests
- Tokyo’s unique cost structure (land prices, labor costs concentrated in the capital) may not translate uniformly to the rest of Japan
- A single month of data is statistically insufficient to declare a durable trend shift
For BOJ watchers: the central bank will likely weigh this Tokyo/national CPI pattern alongside wage growth data and the output gap at its next policy meeting, rather than reacting to a single data point. Markets pricing further rate normalization should watch for confirmation in the next release rather than front-running the signal.
The next Tokyo CPI release (August data) is scheduled for August 28, 2026, with focus on whether acceleration extends to a third month. National August data follows on September 18, 2026.
Disclaimer: This article is for informational purposes only. All investment decisions are made solely at your own risk.







