📺 Watch the Full Video Analysis
This article was automatically generated by the NFC Market Live AI analysis system. (Updated: 2026-08-27 09:07 JST)
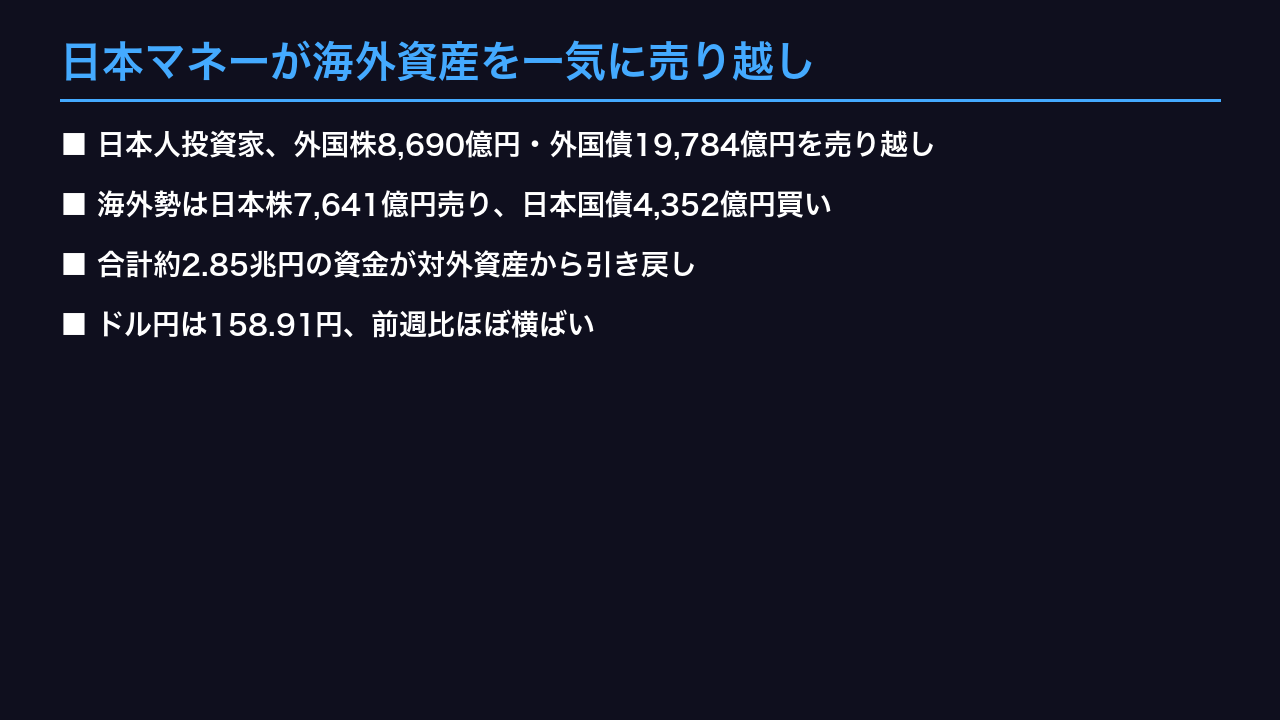
According to Japan’s Ministry of Finance weekly securities flow data (week of Aug 16-22), Japanese residents sold ¥869.0bn of foreign equities and ¥1,978.4bn of foreign long-term bonds — a combined ¥2.85 trillion pullback from overseas assets.
📊 This bond outflow ranks as the 2nd-largest weekly figure in the past year.
📈 Meanwhile, foreign investors sold ¥764.1bn of Japanese equities but bought ¥435.2bn of JGBs.
💴 USD/JPY held at 158.91, continuing to ease off its July peak of 163.71.
We break down what this sharp reversal from two weeks of aggressive resident buying means — with balanced analysis of both the risks and resilience in the data.
日本マネーが海外資産を一気に売り越し
Understanding Japan’s Weekly Portfolio Flow Data
Japan’s Ministry of Finance (MOF) publishes “Trends in International Transactions in Securities” every Thursday, tracking contracted (not settled) transactions between Japanese residents and foreign investors across equities, long-term bonds, and short-term bills. This is one of the highest-frequency portfolio flow datasets available for Japan, conceptually similar to the US TIC (Treasury International Capital) report but published weekly rather than monthly.
The Headline Reversal
For the week of Aug 16-22, Japanese residents sold 869.0 billion yen of foreign equities and 1,978.4 billion yen of foreign long-term bonds — a combined outflow of roughly 2.85 trillion yen (~$18bn). This follows two consecutive weeks of aggressive buying (+1,391.3bn equities and +1,137.3bn bonds in the prior week alone).
Cross-Border Contrast
Foreign investors sold 764.1 billion yen of Japanese equities but bought 435.2 billion yen of Japanese government bonds (JGBs) — a bifurcated signal that contrasts with the broad-based domestic selling on the resident side.
Market Implications
Large resident outflows from foreign assets are theoretically yen-supportive (repatriation flows), yet USD/JPY closed the week at 158.91, barely changed from 159.21 the prior week. This divergence between flow direction and FX price action is a recurring feature of MOF weekly data and should not be over-interpreted from a single week.
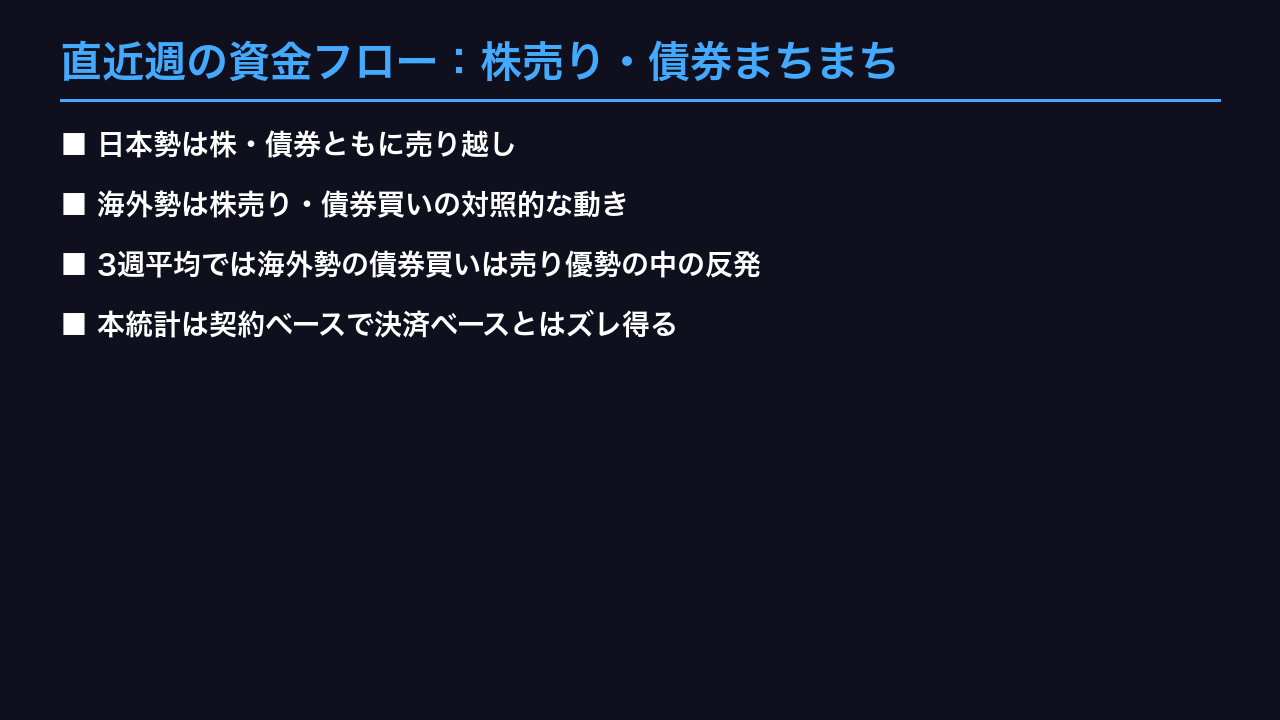
直近週の資金フロー:株売り・債券まちまち
Asset-Class Divergence
Japanese residents sold both foreign equities (-¥869.0bn) and foreign bonds (-¥1,978.4bn), while foreign investors showed a split pattern: selling Japanese equities (-¥764.1bn) while buying JGBs (+¥435.2bn). This bifurcation among foreign investors echoes a classic \”flight to quality\” pattern seen in global markets, where equities are sold while sovereign debt is accumulated — though one week of data cannot confirm risk-aversion as the driver.
Three-Week Trend Check
Over the trailing three weeks (Aug 2-22), foreign long-term bond flows averaged approximately -¥290bn per week. This means the latest week’s inflow is a partial rebound within an otherwise selling-biased month, rather than a clean directional shift.
Comparison to US TIC Data
Unlike the monthly US TIC report, which aggregates net foreign purchases of US securities with roughly a six-week lag, Japan’s MOF weekly release offers near-real-time positioning signals, though on a contract-date basis that can diverge from settlement-based statistics like the Balance of Payments.
Market Implications
The bond-buying, equity-selling pattern from foreign investors is not, on its own, strong evidence of a broad risk-off rotation into JGBs; subsequent weeks should be monitored before drawing conclusions for JGB yields or the Nikkei.
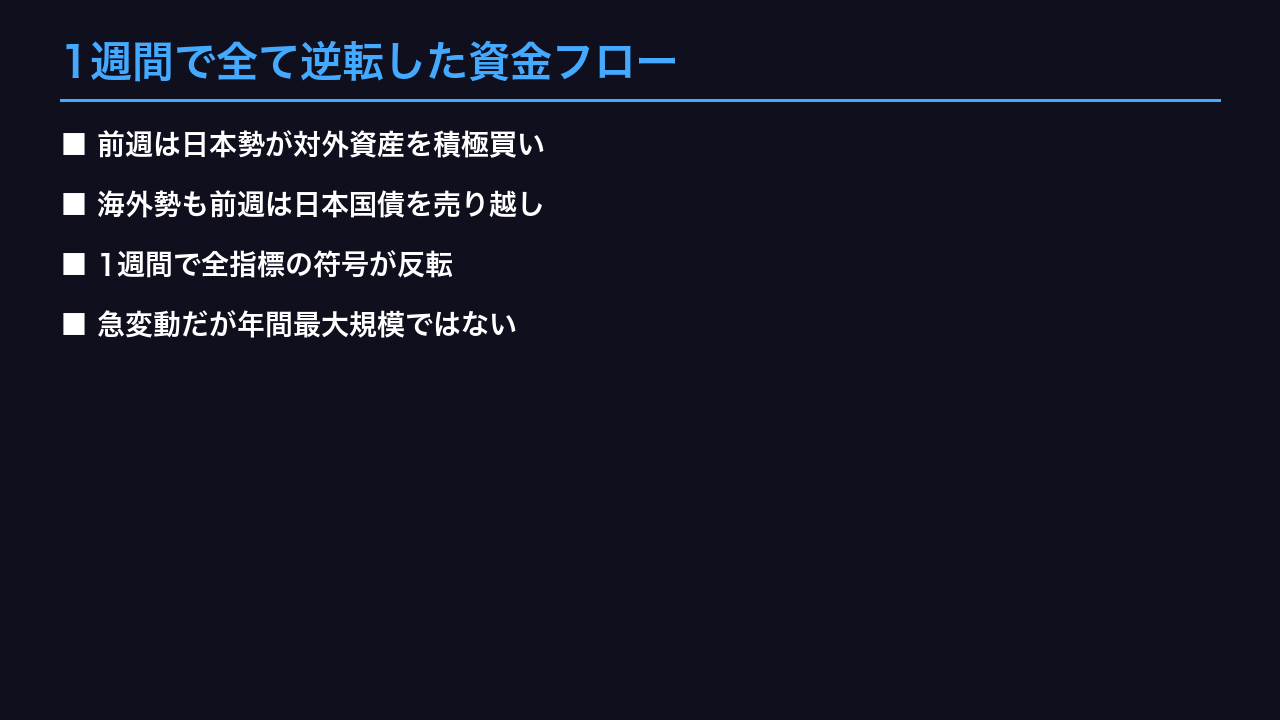
1週間で全て逆転した資金フロー
Measuring the Swing
The magnitude of this reversal is notable: resident foreign-equity flows swung from +¥1,391.3bn to -¥869.0bn (a ¥2,260.3bn shift), while foreign-bond flows swung from +¥1,137.3bn to -¥1,978.4bn (a ¥3,115.7bn shift). Both rank among the larger two-week swings observed in the past year.
Historical Precedent
Similar whiplash has occurred before. Foreign equity flows into Japan swung from -¥4,448.1bn (week of Mar 22-28) to +¥2,951.8bn (week of Apr 4) — a nearly ¥7.4 trillion swing in a single week. By that yardstick, this week’s roughly ¥3 trillion reversal, while significant, is not the largest of the year.
A Possible (Unconfirmed) Driver
The report itself provides no explanation. One plausible but unverified hypothesis: with USD/JPY pulling back from its July 25 peak of 163.71, some investors may have been locking in foreign-currency translation gains — though this is a single hypothesis, not a confirmed causal link.
What to Watch Next
If next week’s data shows continued resident selling of foreign bonds, that would support a more structural reading. A rebound toward buying would instead point to a one-off adjustment.
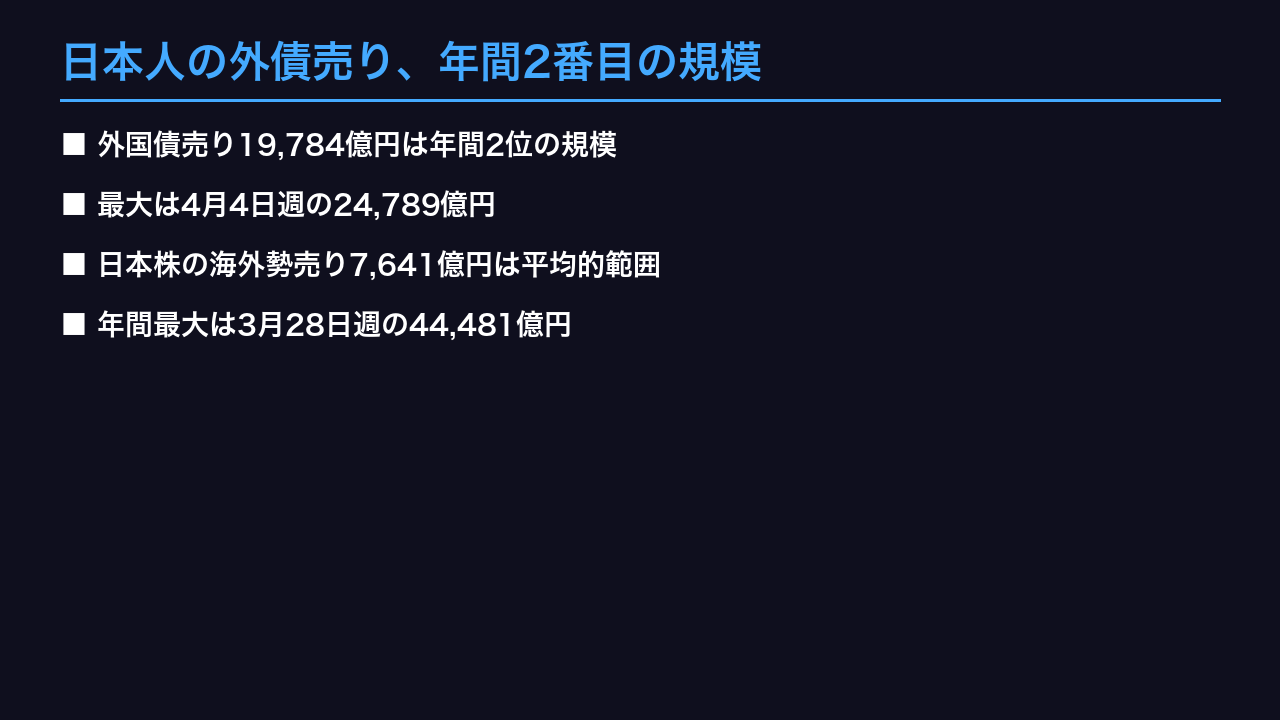
日本人の外債売り、年間2番目の規模
Ranking Resident Bond Outflows Over the Past Year
| Week | Net Outflow (JPY bn) |
|---|---|
| Mar 29-Apr 4 | -2,478.9 |
| Aug 16-22 (this week) | -1,978.4 |
| Feb 15-21 | -1,900.8 |
| Dec 21-27 | -1,049.6 |
| Mar 8-14 | -955.8 |
This week’s outflow is the second-largest of the past year for resident foreign-bond selling — a statistically notable data point in its own right.
Putting Foreign Equity Selling in Context
By comparison, foreign investors’ 764.1 billion yen sale of Japanese equities looks modest against past extremes:
– Mar 22-28: -4,448.1bn
– Mar 15-21: -2,511.0bn
– Sep 7-13: -2,032.8bn
– Jun 21-27: -1,817.5bn
Cross-Market Context
For investors used to US TIC data, this kind of week-to-week bond flow volatility is larger than typically seen in US Treasury holdings data, partly because Japan’s weekly release captures gross portfolio decisions with less smoothing than monthly aggregates.
Caveat
A single week ranking second-highest of the year is a striking fact, but it is not sufficient evidence of a structural shift in Japanese residents’ allocation to foreign bonds. Confirmation requires persistence across subsequent releases.
円は158円台で底堅い:フローと為替の乖離
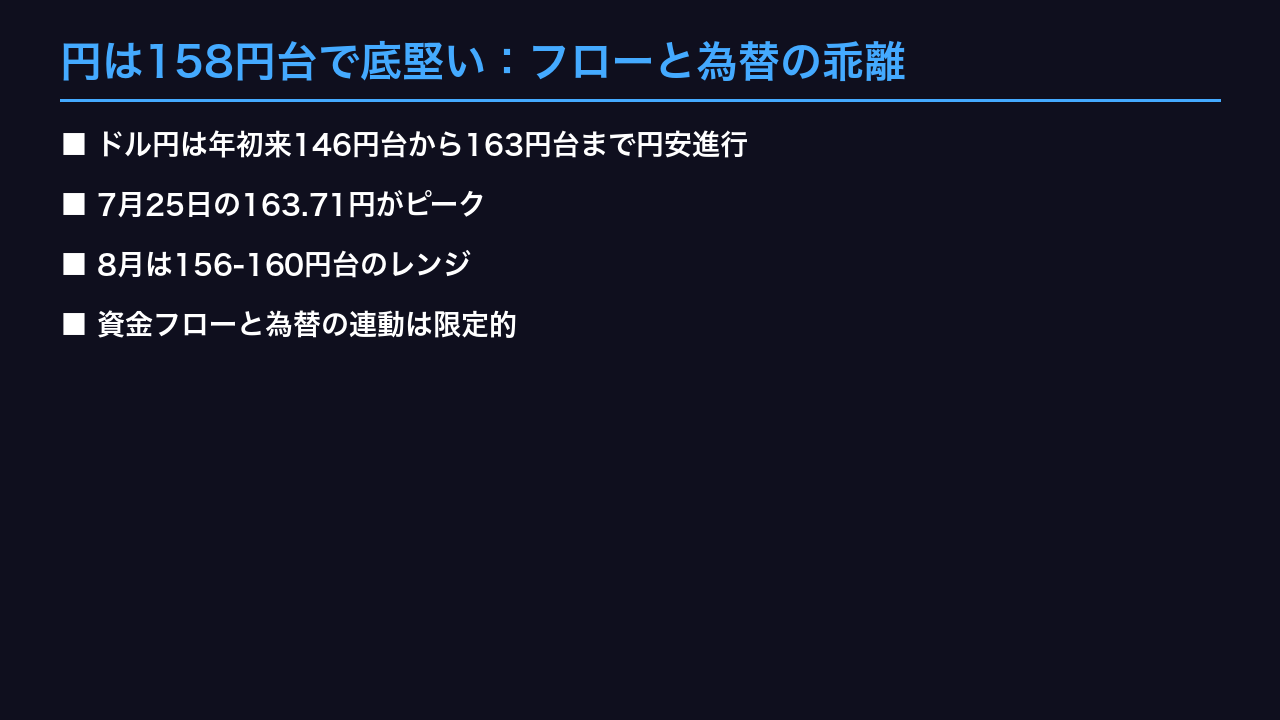
One-Year USD/JPY Trajectory
Key waypoints over the past year: USD/JPY started near 146.82 in late August 2025, drifted up through the autumn to around 156 by late November, approached 160 by late March 2026 (coinciding with record-setting portfolio flow volatility), peaked at 163.71 on July 25, 2026, and has since eased back to 158.91 as of August 22.
Why Flow Data Doesn’t Always Move FX
Despite roughly 2.85 trillion yen in resident outflows from foreign assets this week — theoretically yen-positive via repatriation — USD/JPY moved just 30 sen versus the prior week. Possible explanations include: (1) some of the resident selling may be hedge-related rather than an outright FX conversion; (2) interest-rate differentials between the US and Japan remain the dominant driver; (3) the contract-date basis of this report can lag actual settlement and FX execution. None of these can be confirmed definitively from this data alone.
Context for International Readers
Unlike the Fed’s dot plot or ECB guidance, the Bank of Japan (BOJ) has maintained a comparatively gradual policy stance, and the persistent US-Japan rate gap has been widely cited as the structural driver behind yen weakness over the past year. Investors comparing this to Fed policy should note that a single week of MOF flow data is a much noisier signal than, say, US nonfarm payrolls for Fed expectations.
Market Implications
FX traders should treat this week’s large bond outflow as a data point to watch, not a standalone trading signal — confirmation from subsequent weekly releases and rate-differential trends would be needed before drawing firmer conclusions.
総括:強さと弱さが交錯するデータ
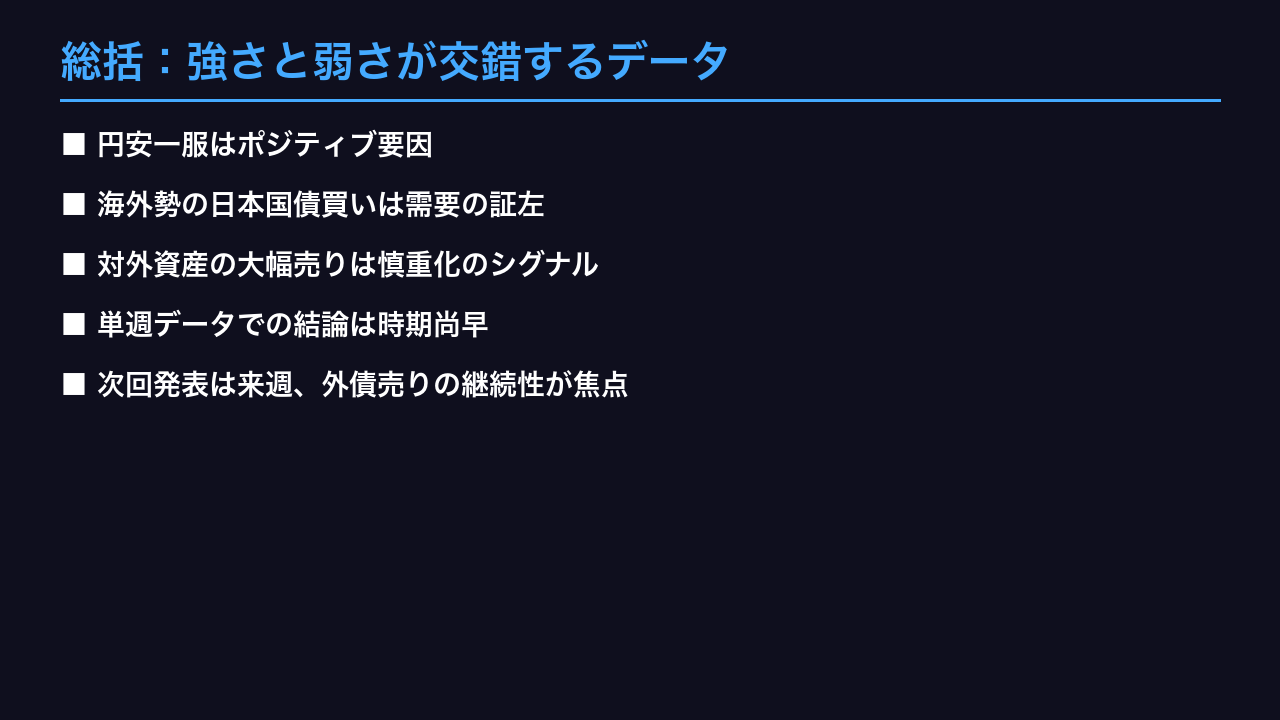
Balancing the Evidence
This week’s release presents a genuinely mixed picture rather than a one-sided narrative.
Resilience
– USD/JPY has eased from its yearly peak of 163.71 back into the 158 range, suggesting the pace of yen depreciation has slowed
– Foreign investors’ 435.2 billion yen purchase of JGBs signals continued appetite for Japanese sovereign paper, a modest positive for JGB market stability
Risk Factors
– The combined ~2.85 trillion yen outflow from Japanese residents’ foreign equity and bond holdings ranks among the largest weekly figures of the year
– The 1,978.4 billion yen bond outflow specifically is the second-largest of the past 12 months
Scenario Thresholds to Watch
If resident bond flows return to positive territory next week, the current move likely reflects short-term profit-taking. If outflows exceed 1 trillion yen for a second consecutive week, that would raise the probability of a more structural reallocation away from foreign bonds — a scenario worth monitoring for JGB and FX markets alike.
A Note on Data Limitations
This is a contract-date series, which can diverge from settlement-based data such as Japan’s Balance of Payments statistics. Weekly figures are inherently noisier than monthly aggregates, and drawing firm conclusions from a single week’s reversal would exceed what the data can support.
Looking Ahead
The next release is due next week, covering the period of August 23-29. Investors should watch whether resident bond outflows persist or reverse, and whether foreign buying of Japanese equities resumes.
Disclaimer: This article is for informational purposes only. All investment decisions are made solely at your own risk.







