📺 Watch the Full Video Analysis
This article was automatically generated by the NFC Market Live AI analysis system. (Updated: 2026-08-25 14:09 JST)
📄 Primary Source
内閣府経済社会総合研究所
https://www.esri.cao.go.jp/jp/stat/di/202606psummary.pdf
Breaking down Japan’s June Coincident Index (CI) revision from the Cabinet Office 📊
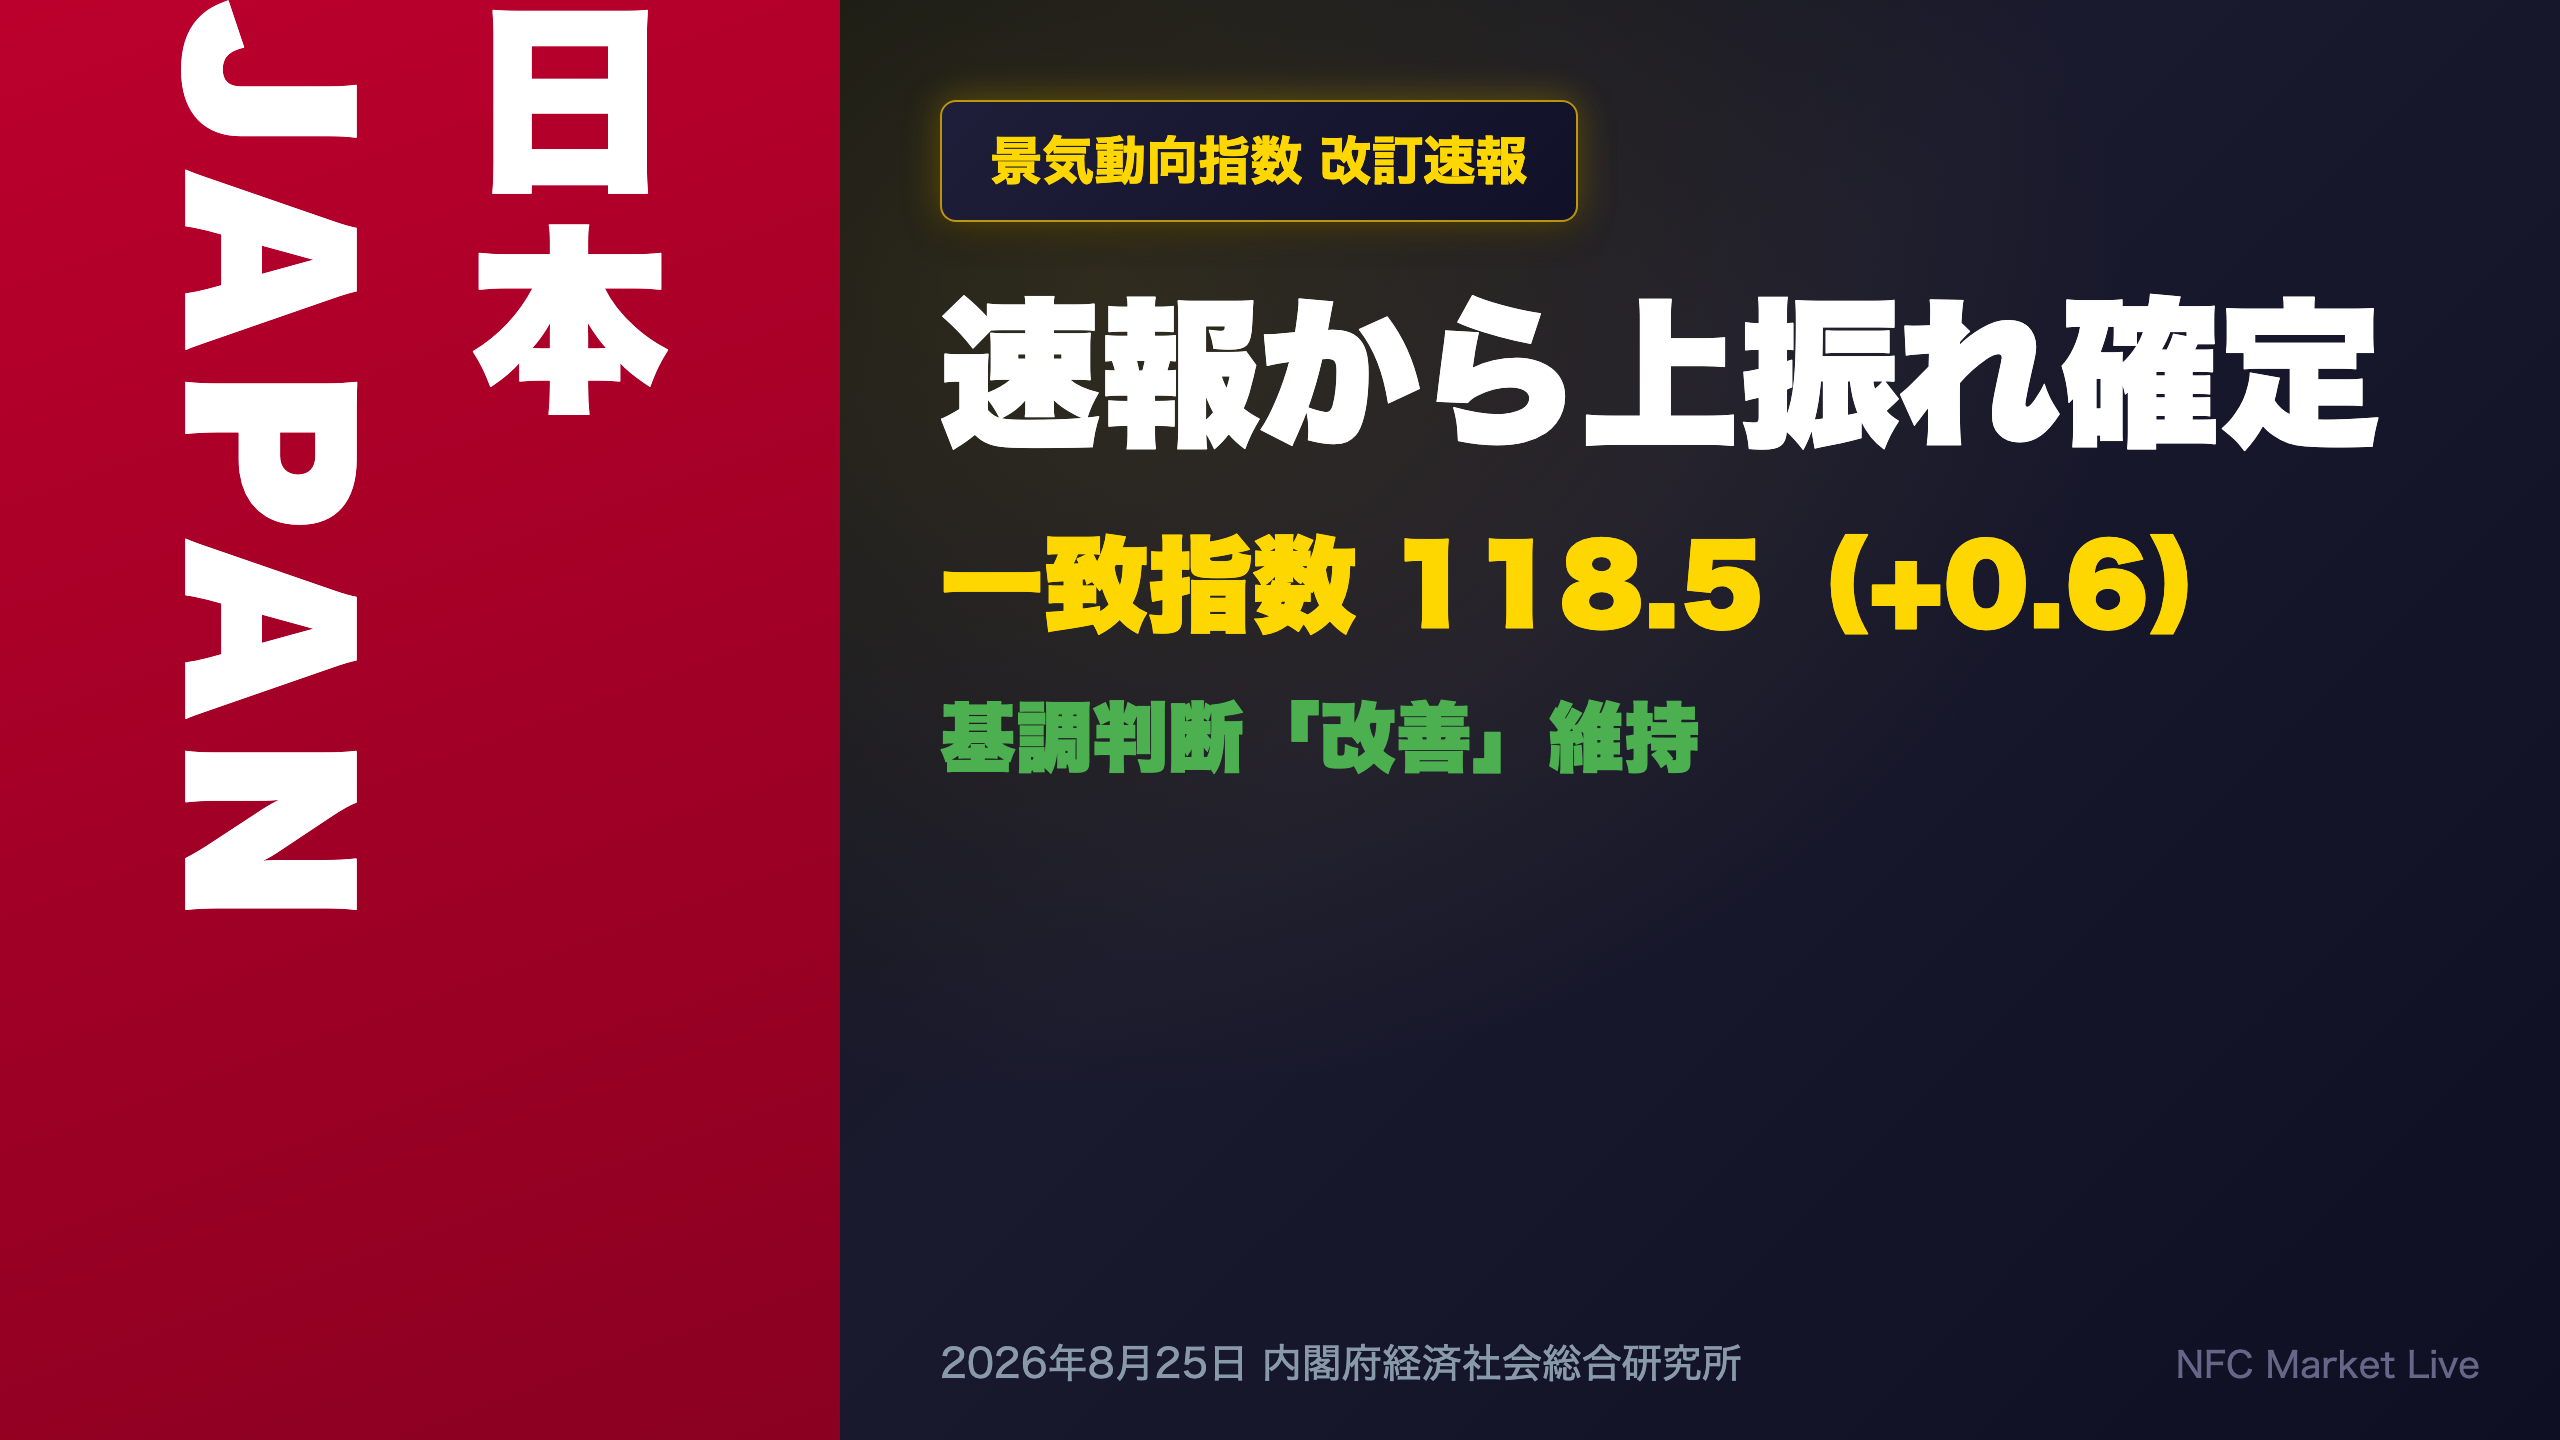
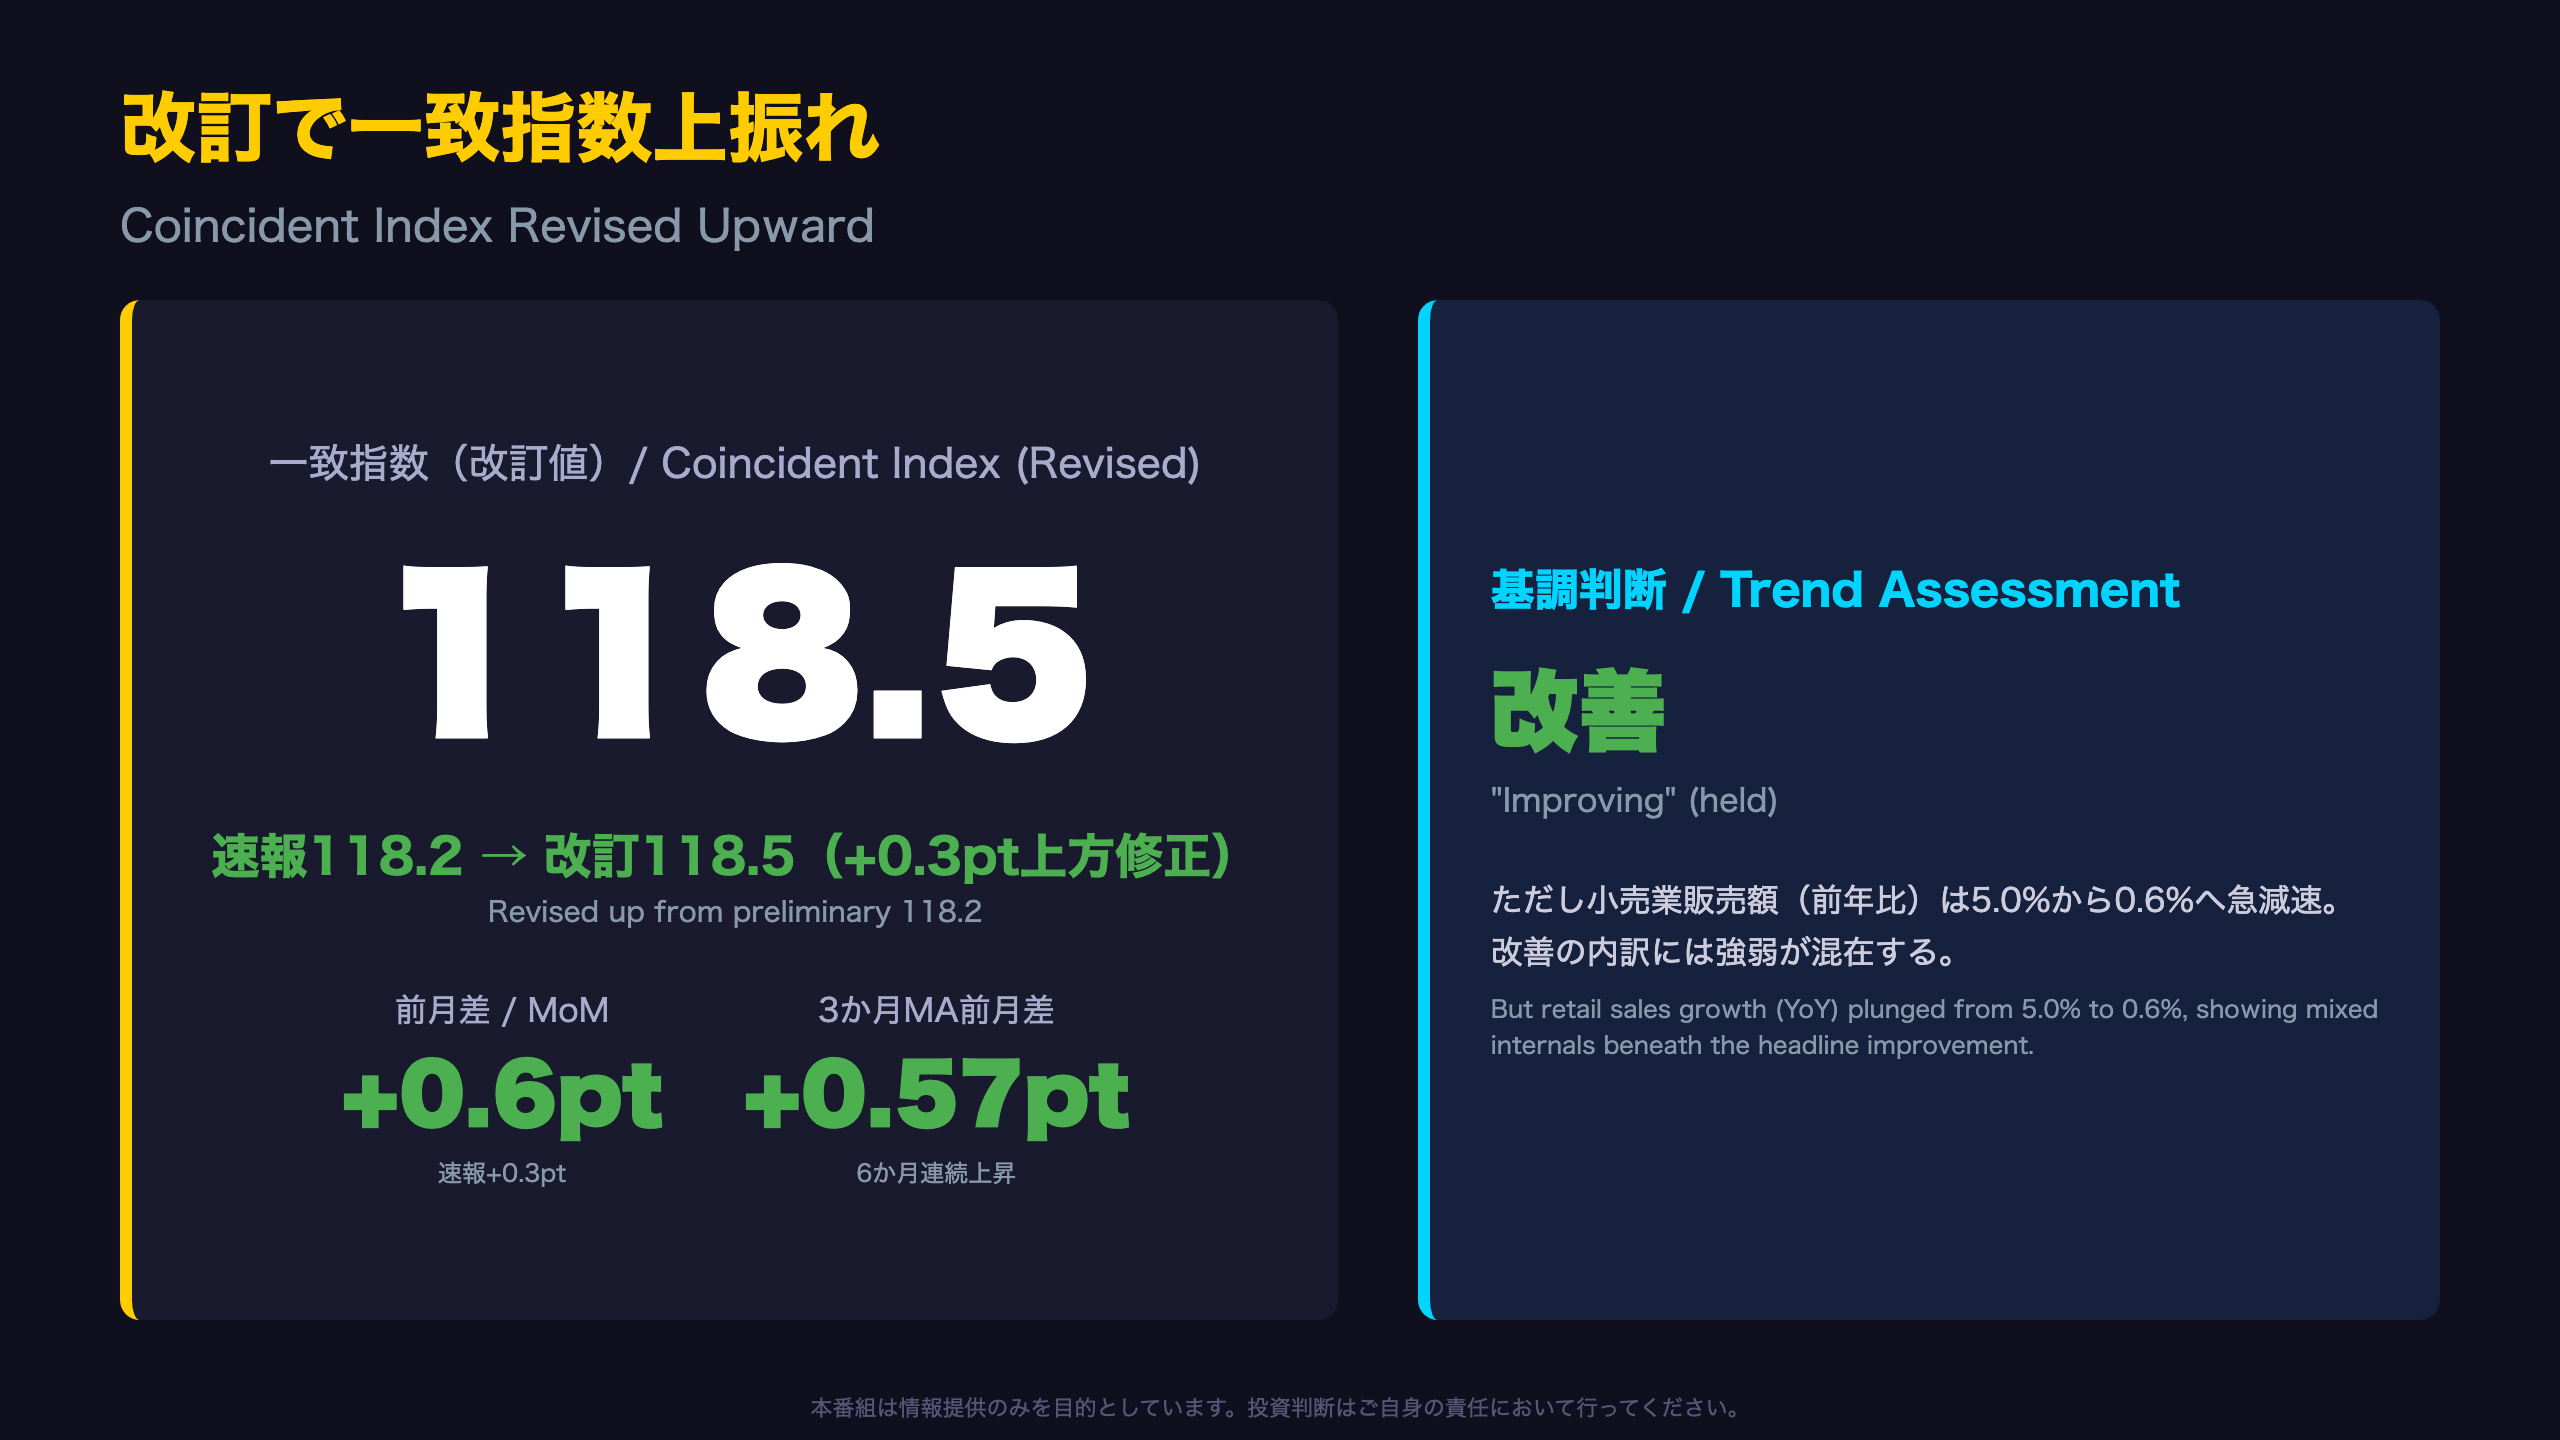
The Coincident Index was revised UP from 118.2 to 118.5, with the monthly change doubling from +0.3 to +0.6. The official “Improving” assessment was maintained 💡
But beneath the headline: retail sales growth (YoY) collapsed from 5.0% to 0.6%, and the export volume index fell for a third straight month 📉
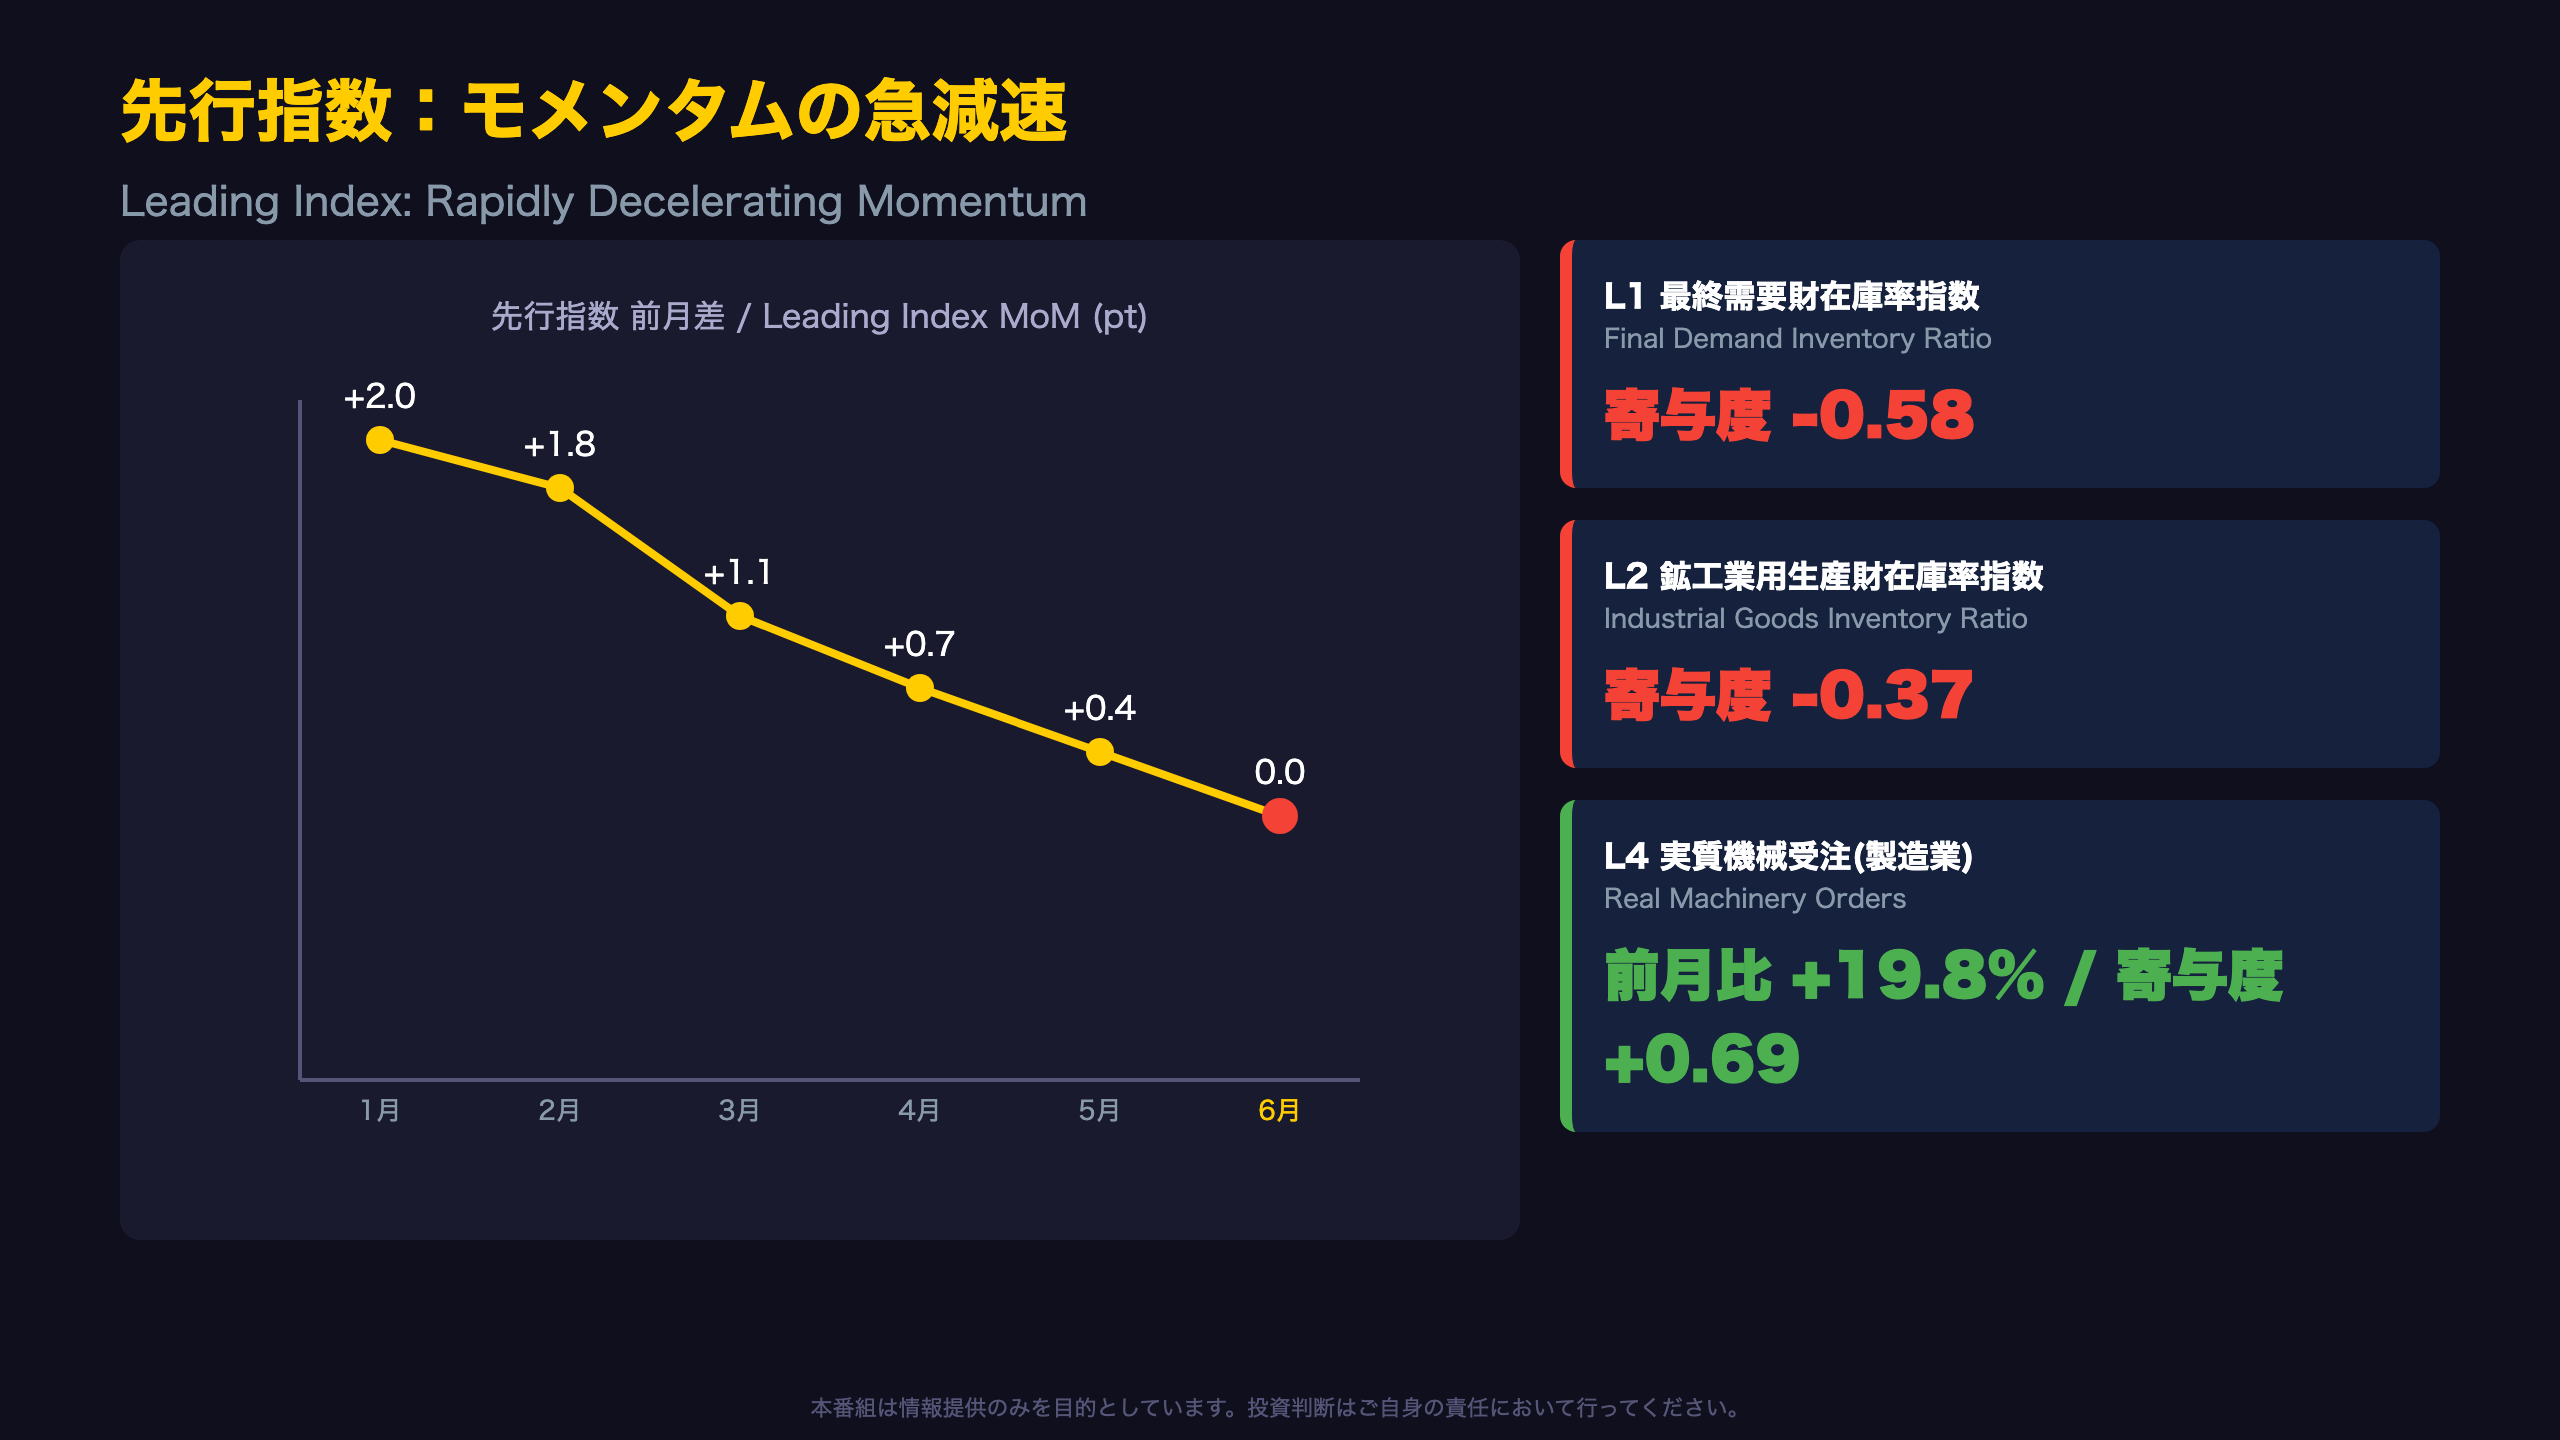
The Leading Index also shows decelerating momentum — from +2.0 points in January to flat in June ⚠️
A data-driven look at the strength and weakness hidden inside Japan’s latest business cycle indicator.
改訂で一致指数上振れ、基調判断「改善」維持
What Changed Between Preliminary and Revised
Japan’s Cabinet Office (Economic and Social Research Institute, ESRI) released the preliminary June reading on August 7, 2026, followed by a revision on August 25. The Coincident Index (CI), a composite gauge of ten production, employment, and sales indicators benchmarked to 2020=100, was revised from 118.2 to 118.5, with the month-on-month change widening from +0.3 to +0.6 points.
For context, Japan’s CI is conceptually similar to the US Conference Board’s Coincident Economic Index, though Japan’s version places heavier weight on industrial production and trade-related series, reflecting the economy’s manufacturing tilt.
Moving Averages Also Revised Higher
- 3-month moving average change: 0.47pt → 0.57pt
- 7-month moving average change: 0.47pt → 0.52pt
Both confirm a sixth consecutive month of improvement in the underlying trend.
A Split Revision: Coincident Up, Lagging Down
While the Coincident Index was revised up, the Lagging Index was revised down, from 112.3 to 111.8, with its monthly change shrinking from +0.9 to +0.5. This asymmetry suggests the “current state” gauge and the “confirming” gauge of the cycle are sending slightly different signals — worth watching for investors calibrating exposure to Japanese cyclicals versus defensives.
What’s Next
The July preliminary reading is due September 7. Watch whether the production index and labor input index — the two series responsible for most of this upward revision — sustain their momentum.
なぜ改訂されたのか:生産指数と労働投入量の押し上げ
Decomposing the Revision
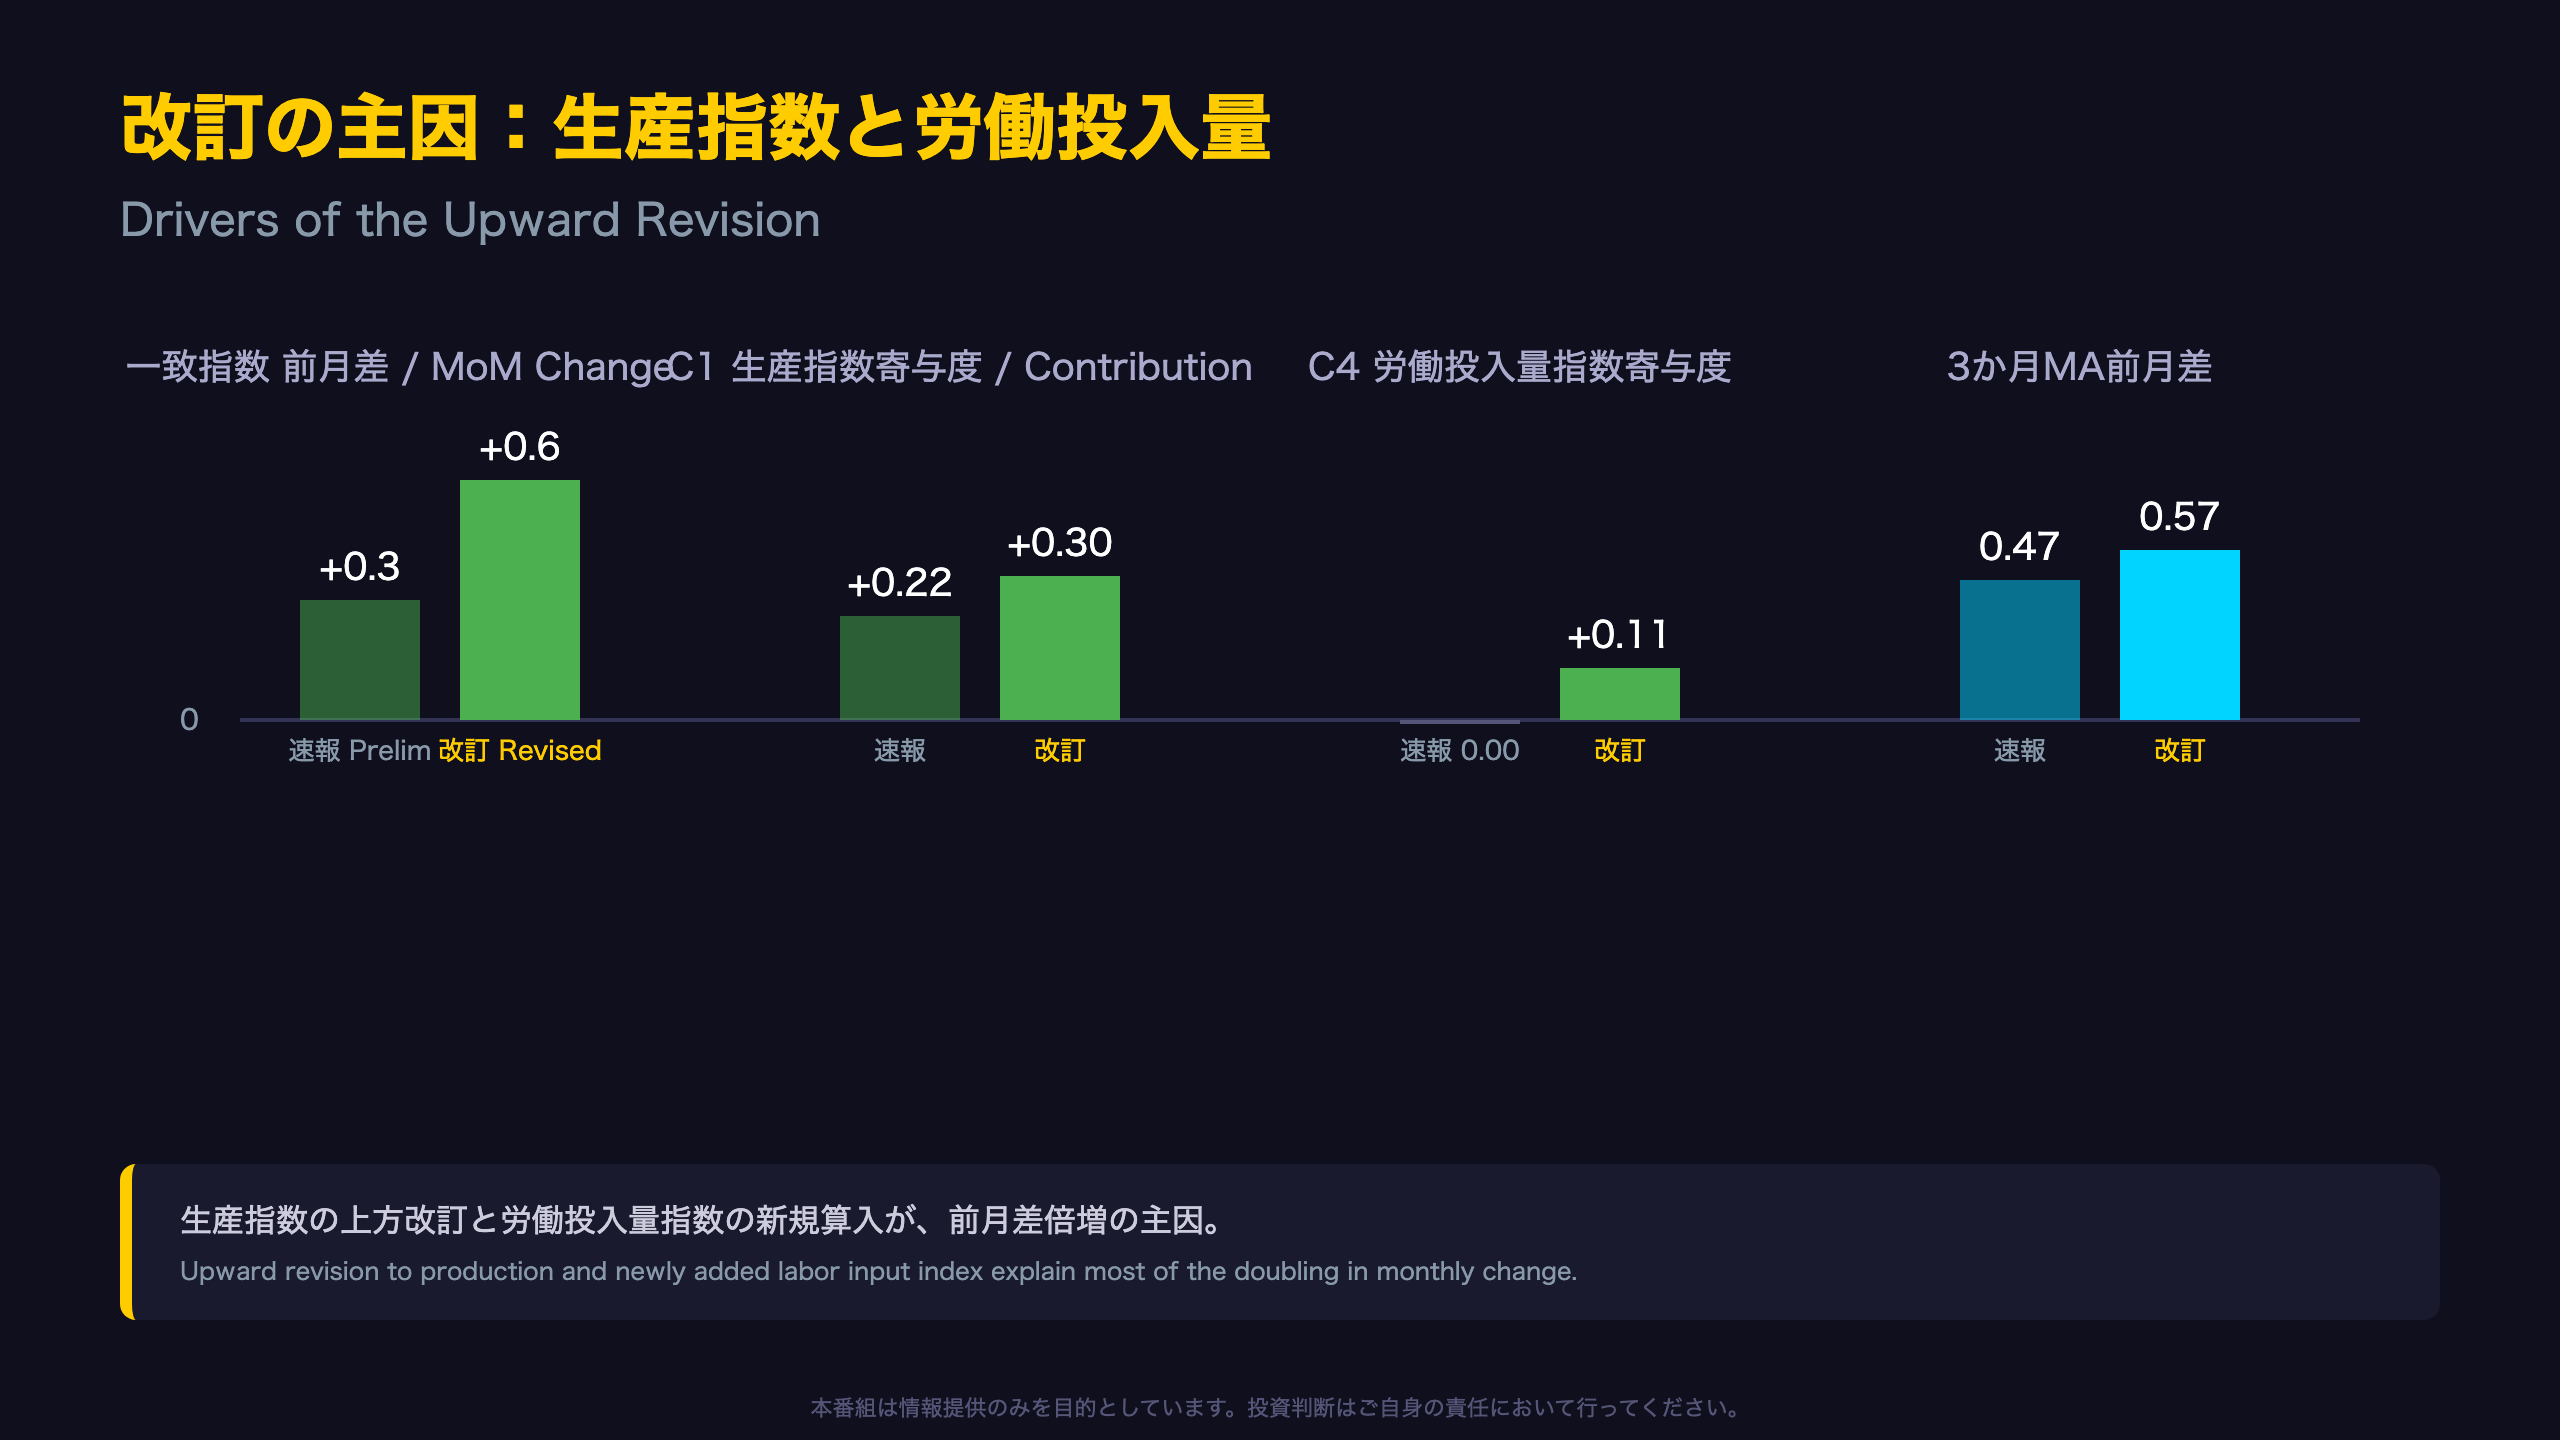
The gap between the preliminary and revised June readings isn’t a simple rounding correction — it reflects several coincident series moving in the same direction simultaneously.
| Series | Preliminary (June) | Revised (June) | Contribution Change |
|---|---|---|---|
| C1 Industrial Production Index | 103.9 | 104.6 | +0.22 → +0.30 |
| C4 Labor Input Index | Not yet available | 103.5 | 0.00 → +0.11 |
| C6 Retail Sales (YoY) | 0.5% | 0.6% | -0.61 → -0.52 |
| C7 Wholesale Sales (YoY) | 9.6% | 9.5% | +0.49 → +0.42 |
Two factors alone — the upward revision to industrial production and the newly incorporated labor input index — account for roughly +0.19 points of the swing, explaining most of why the monthly change doubled from +0.3 to +0.6.
Why Retroactive Revisions Happen
On the leading index side, ESRI notes that “L4 Real Machinery Orders (Manufacturing)” was retroactively revised due to a revision in the capital goods deflator used for real-term conversion, affecting data from April 2026 onward. This is a structural feature of Japan’s statistical system: base data gets revised after the fact, which is a key reason single-month readings should be interpreted cautiously — a lesson equally applicable to US GDP or payrolls revisions.
What to Watch Next
The Labor Input Index (C4) is excluded from the calculation at the preliminary stage and only contributes via its trend component. Watch how its contribution shifts once it is formally incorporated in the July preliminary release.
一致指数の内訳:卸売・生産は強く、小売・輸出は弱い
Ten Series, Two Very Different Stories
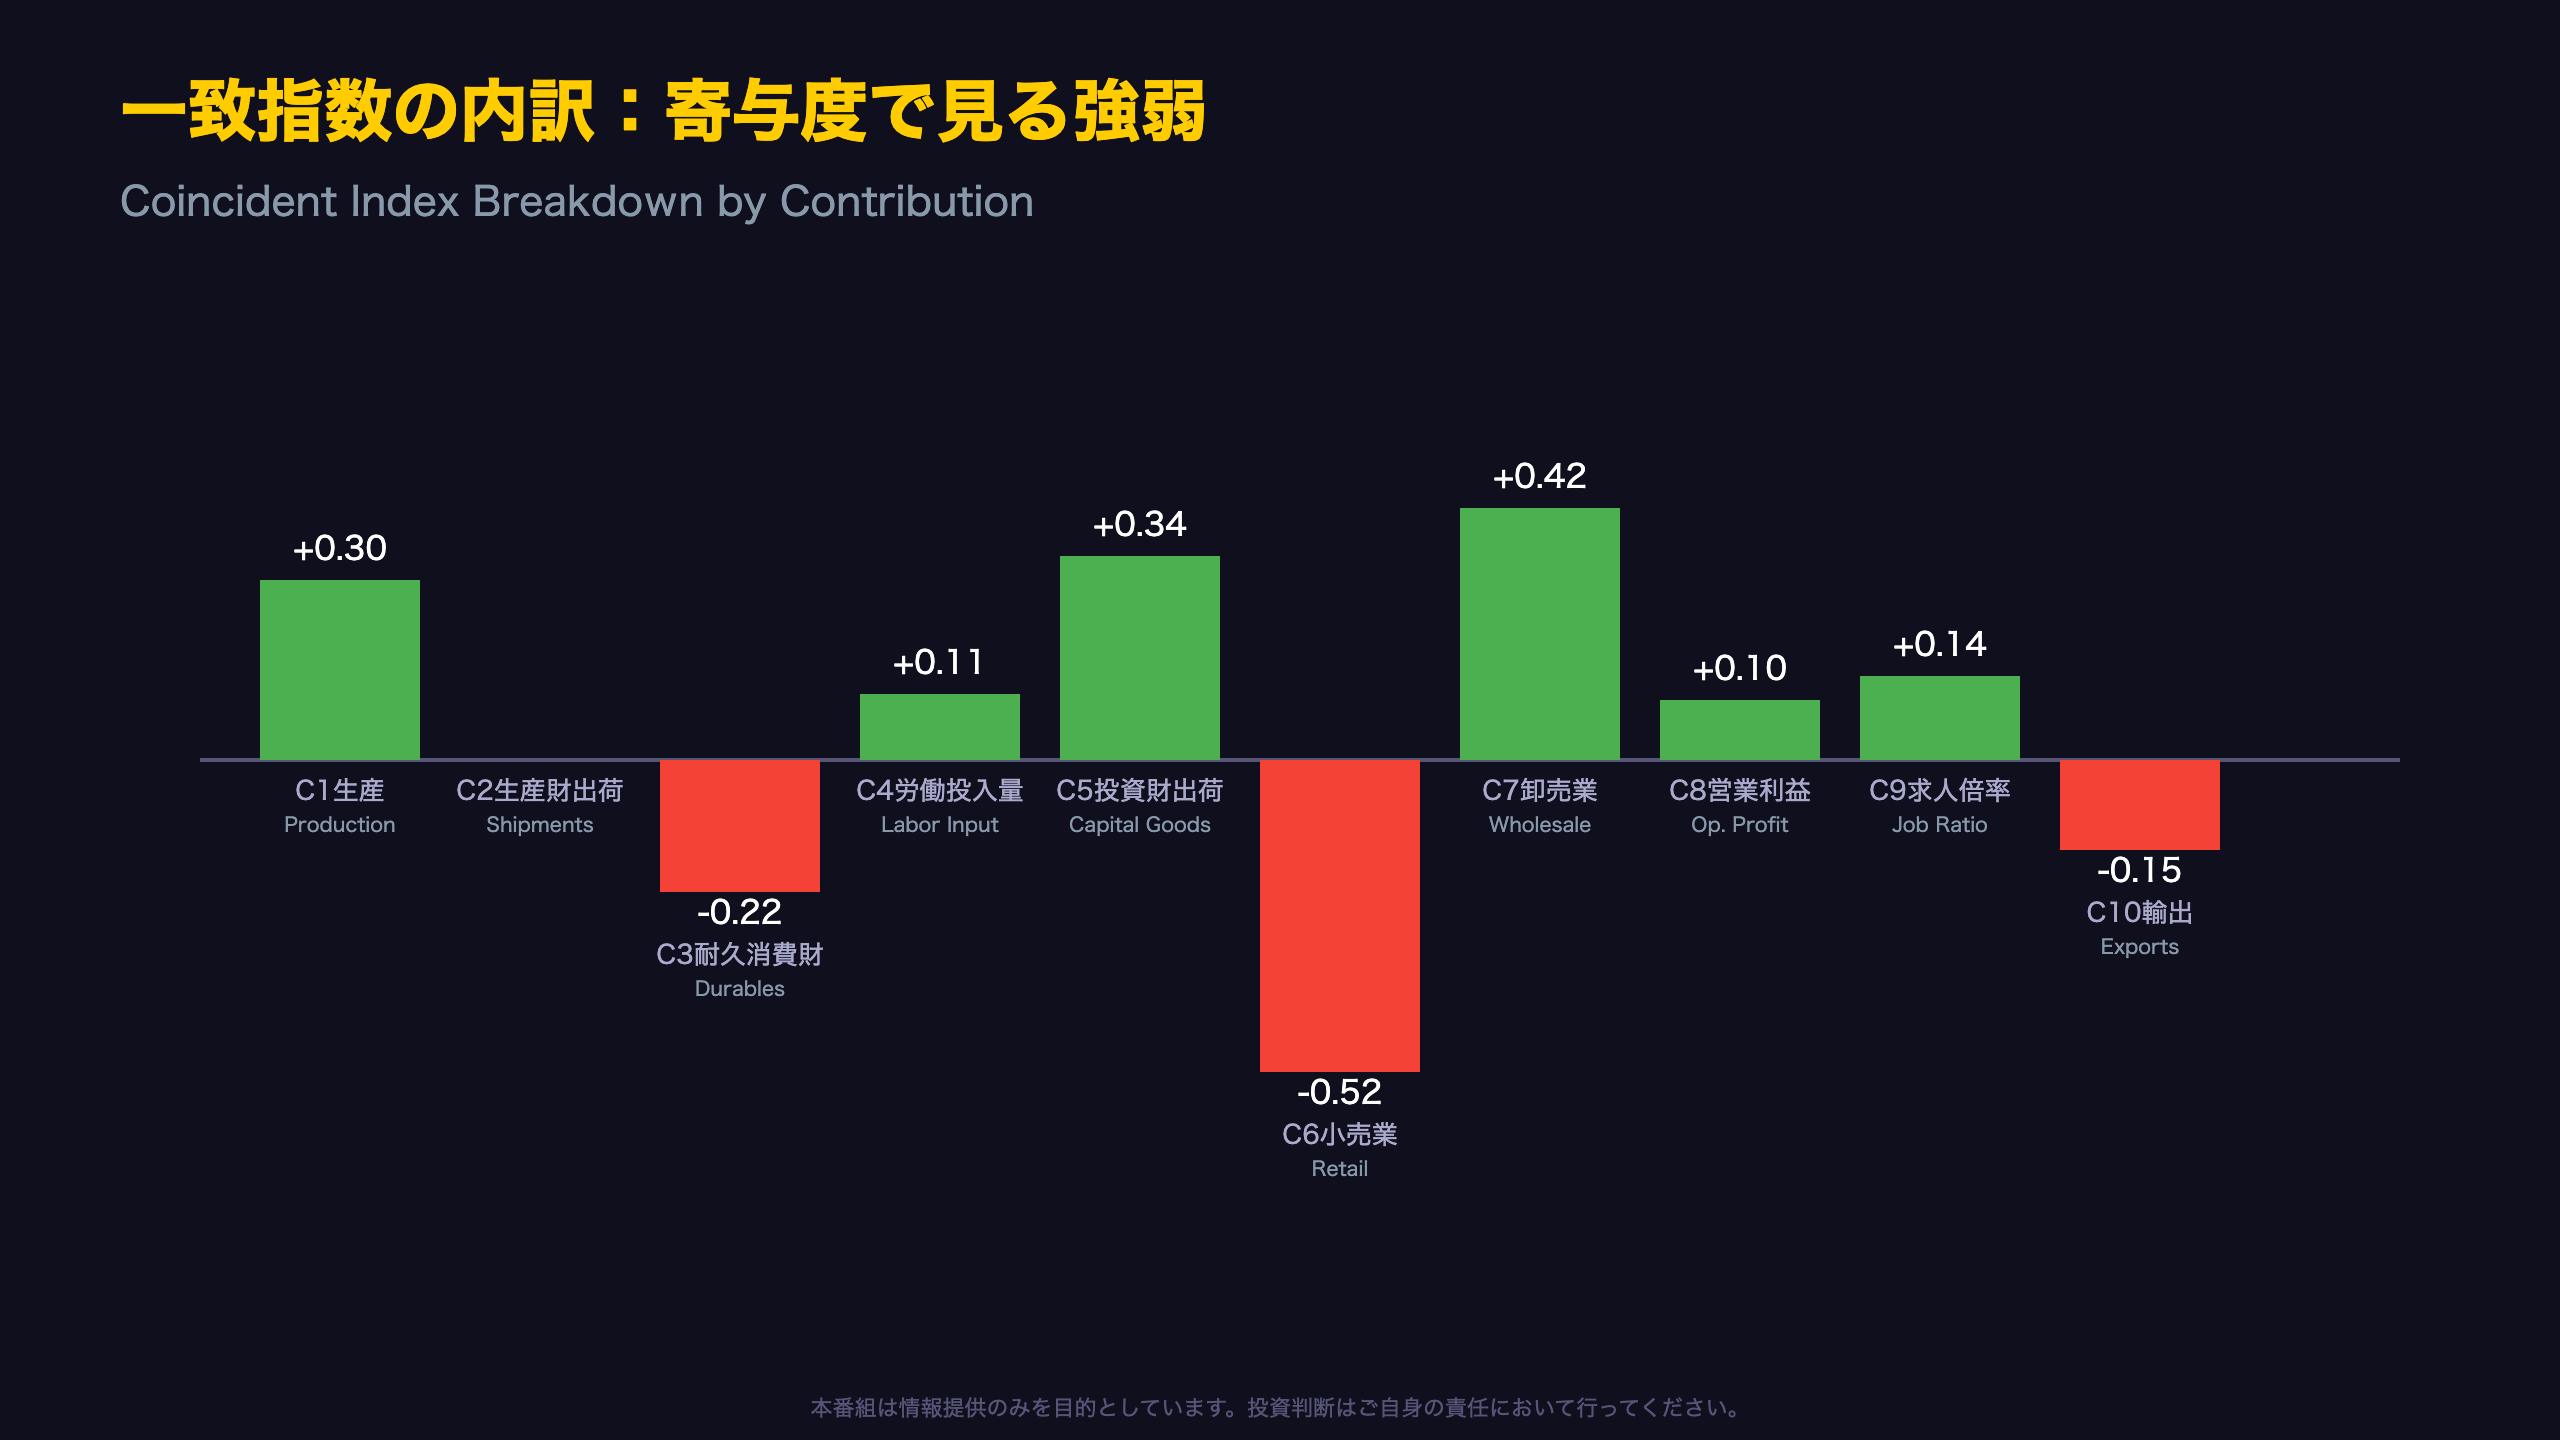
Breaking down the ten components (C1-C10) of the Coincident Index using the revised June figures reveals a clear split between strength and weakness.
Top Positive Contributors
– C7 Wholesale Sales (YoY): +9.5% → contribution +0.42
– C5 Capital Goods Shipments ex-Transport (MoM): +3.0% → contribution +0.34
– C1 Industrial Production Index: 104.6, up from 102.6 → contribution +0.30
Top Negative Contributors
– C6 Retail Sales (YoY): +0.6%, down sharply from +5.0% → contribution -0.52
– C10 Export Volume Index: 104.6, down from 106.0 → contribution -0.15
– C3 Durable Consumer Goods Shipments: 108.2, down from 111.4 → contribution -0.22
Exports: Three Straight Months of Decline
The export volume index has fallen in a clear downtrend over three months: 108.0 in March, 105.5 in April, 106.0 in May, 104.6 in June. For US and European investors watching Japan as a global manufacturing bellwether, this softening in shipped goods volume — even amid resilient domestic production — is a signal worth monitoring, particularly given ongoing questions about global trade demand.
Was the Retail Slowdown a One-Off?
Retail sales growth dropped 4.4 percentage points in a single month, from +5.0% in May to +0.6% in June. This is a single-month data point and does not yet confirm a structural change in Japanese consumer demand — but it bears close watching in the July release.
“Positive contributions came from wholesale sales (year-on-year) and capital goods shipments excluding transport equipment,” per the Cabinet Office’s original release.
先行指数:長期上昇の裏でモメンタムは急減速
Unpacking the “Consecutive Rise” Headline
On the surface, Japan’s Leading Index looks strong: its 3-month moving average has risen for 12 straight months, and the 7-month average for 10. But laying out the monthly changes reveals a clear deceleration pattern.
| Month | Jan | Feb | Mar | Apr | May | Jun |
|---|---|---|---|---|---|---|
| MoM change (pt) | +2.0 | +1.8 | +1.1 | +0.7 | +0.4 | 0.0 |
The pace of increase has narrowed for six consecutive months, hitting flat in June. This is a case of “trend still up, but second derivative negative” — a nuance easily missed if one only watches the lagged moving averages, which is analogous to watching US ISM new orders decelerate even as the headline index stays above 50.
Inventory Cycle Reversal Is a Drag
The inverse-cycle inventory ratio series within the Leading Index have clearly worsened:
– L1 Final Demand Goods Inventory Ratio: +4.9% MoM → contribution -0.58
– L2 Industrial Goods Inventory Ratio: +2.2% MoM → contribution -0.37
These are “inverse cycle” series where a rise (inventory buildup) is a negative signal. Together, these two series alone subtracted roughly 0.95 points from the Leading Index in June. On the other hand, real machinery orders (manufacturing) rebounded sharply, up 19.8% month-on-month, contributing plus 0.69 — the single largest positive factor. This series is notoriously volatile, so a one-month rebound shouldn’t be over-interpreted.
Not (Yet) a Recession Signal
The 7-month moving average remains positive and has now risen for 10 straight months — nowhere close to the mechanical criteria for a “Worsening” (悪化) classification. The most faithful reading of the data is that Japan’s expansion is continuing, but at a visibly slower pace — a nuance global investors comparing Japan to slowing but still-expanding developed economies should keep in mind.
遅行指数と需要サイド:消費・設備投資に力強さを欠く
What the Lagging Index Downgrade Signals
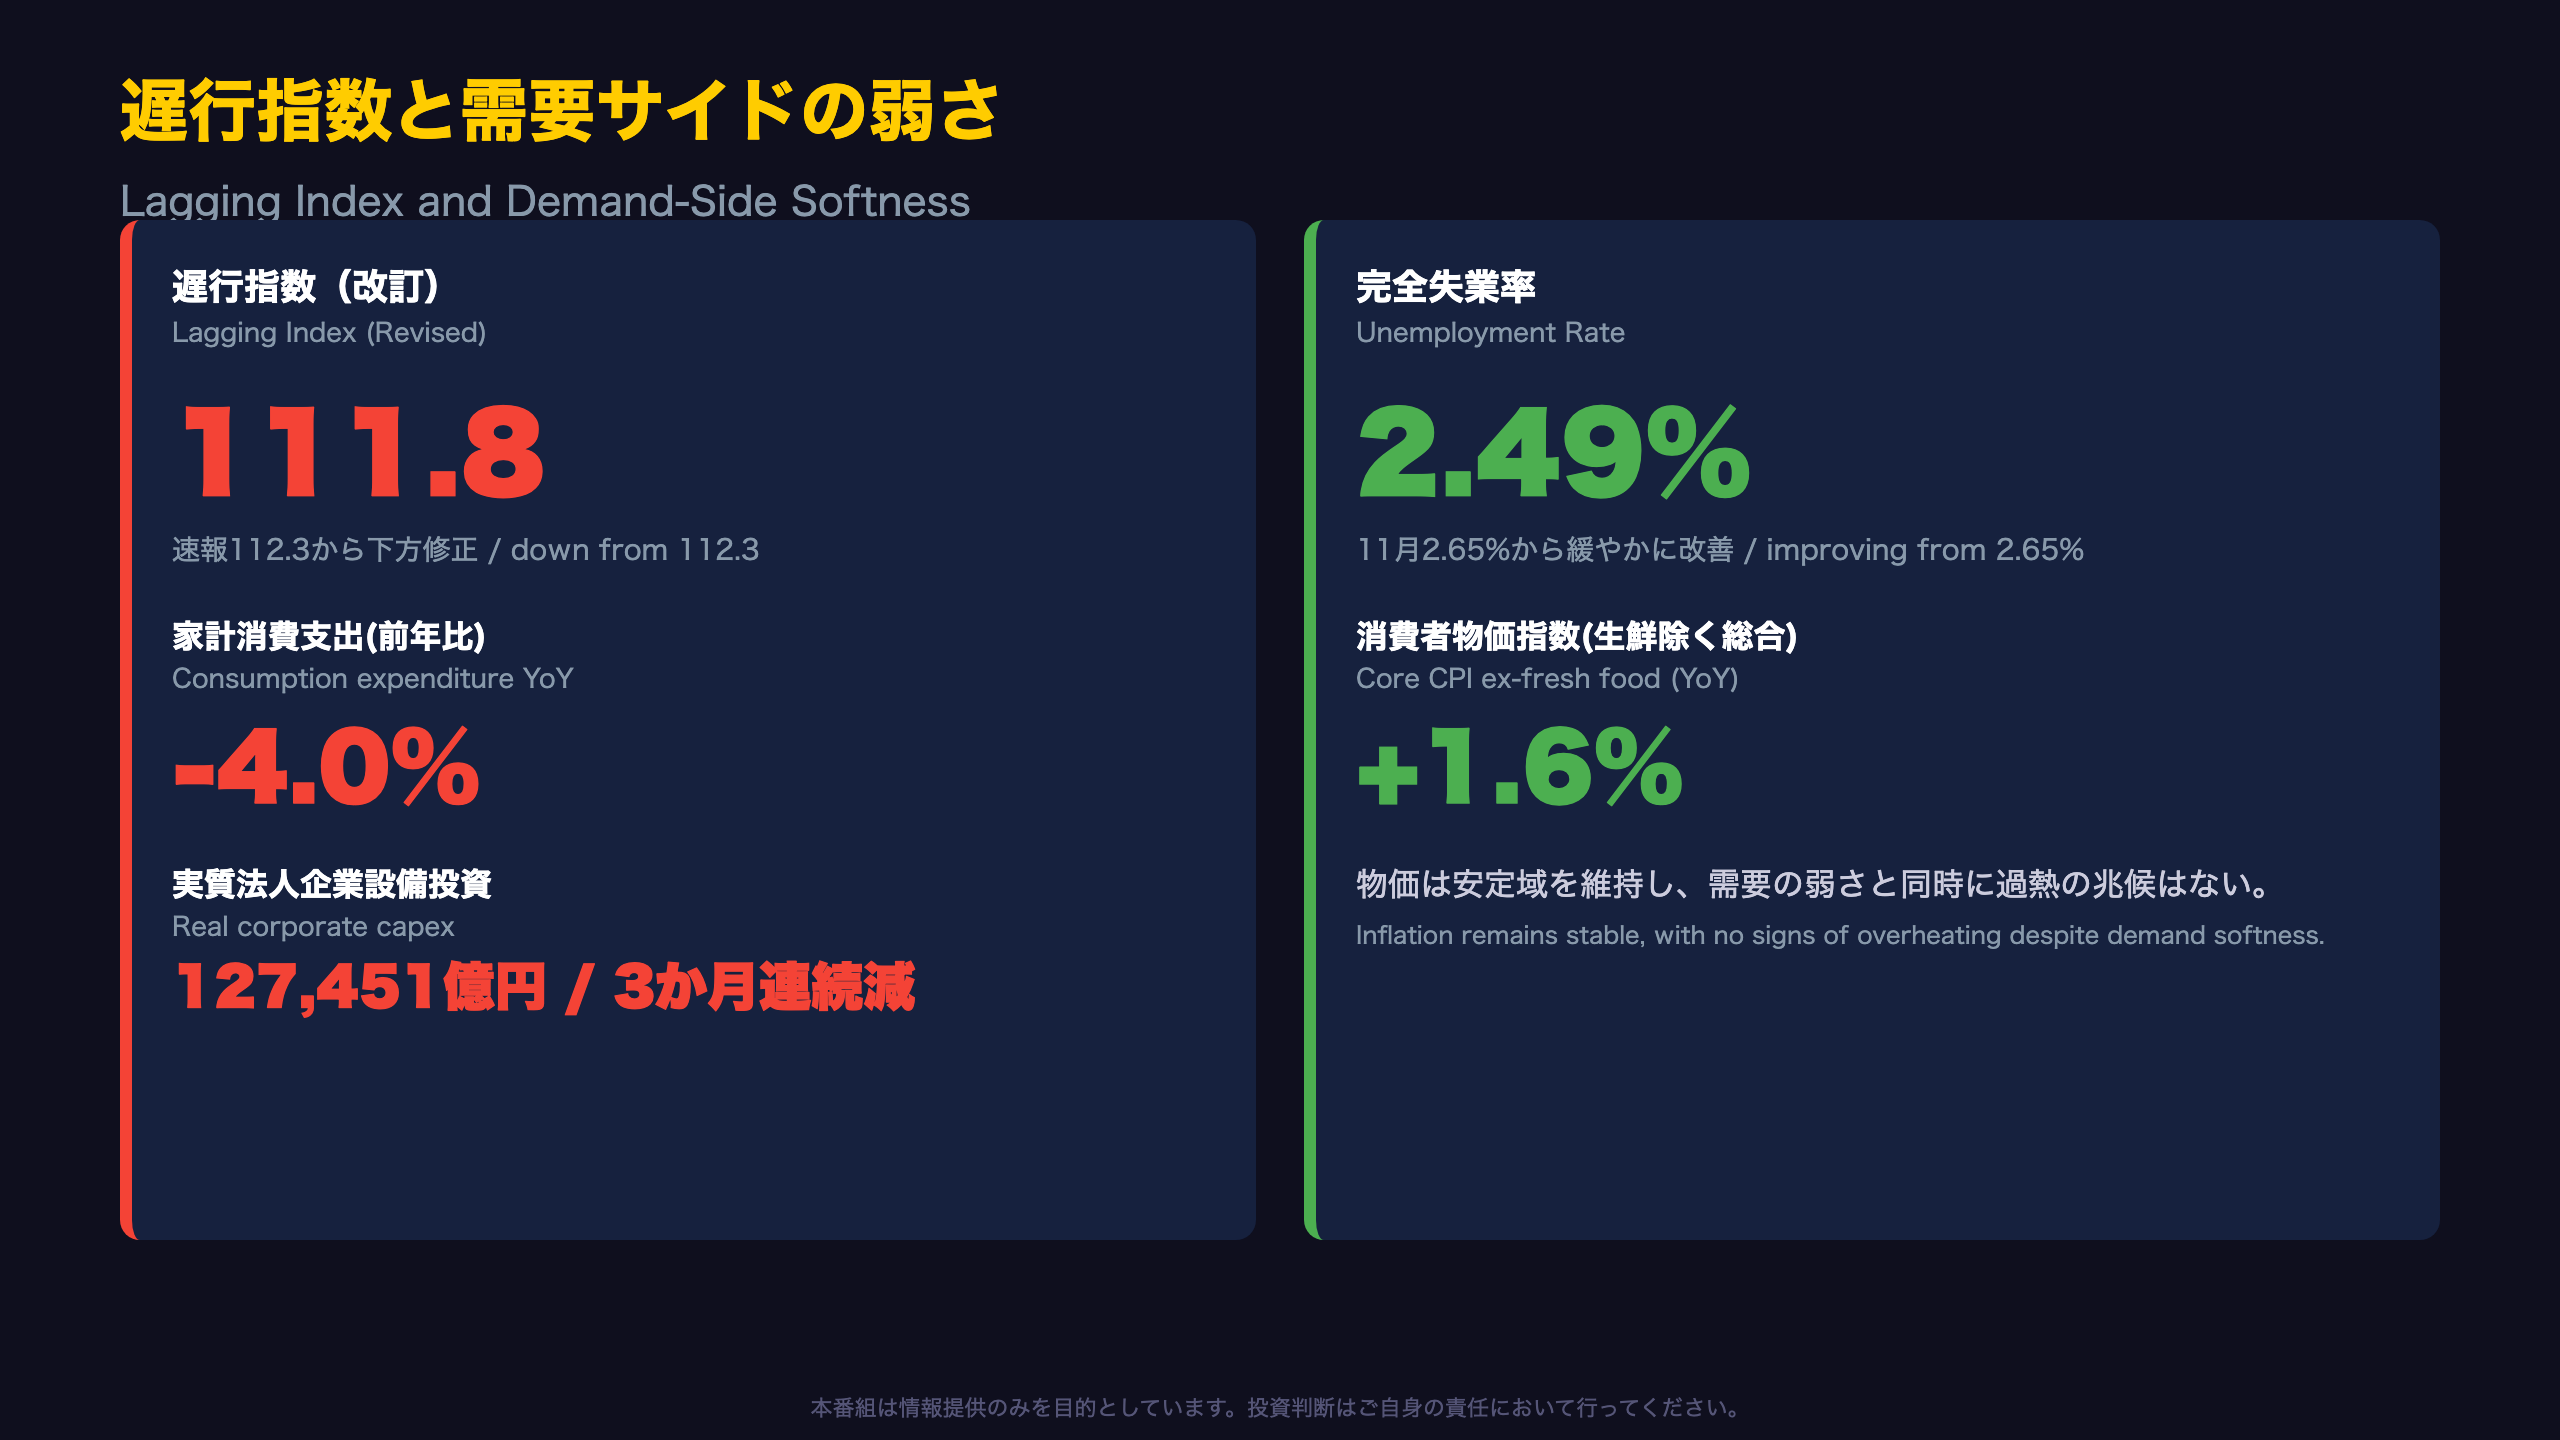
While the Coincident Index was revised up, the Lagging Index was revised down, from 112.3 to 111.8, with its monthly change narrowing from +0.9 to +0.5 points. As a “confirming” indicator that reflects past demand conditions with a delay, this downward revision suggests underlying demand-side weakness is becoming more clearly visible in the data — a dynamic similar to how US personal consumption expenditure data often gets revised after the fact as more complete source data becomes available.
Demand-Side Softness
- Household consumption expenditure (worker households, nominal, YoY): from +0.6% in May to -4.0% in June (contribution -0.30)
- Real corporate capital investment (all industries): part of a gentle multi-quarter downtrend, from ¥130,160 to ¥127,451 (hundred million yen) over the past several data points
Both series carry data limitations — the capex figure is a quarterly series linearly interpolated into monthly CI calculations — so it would be premature to call this a “collapse” in consumption or capex. But directionally, demand-side momentum is clearly softer than supply-side strength (production, wholesale).
The Encouraging Counter-Signal
- Unemployment rate: gradually improving from 2.65% (Nov) to 2.49% (June)
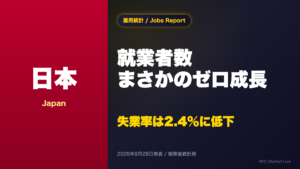
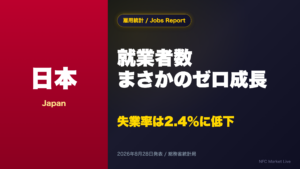
- Core CPI (ex-fresh food, YoY): stable in a narrow 1.4%-1.9% band, printing 1.6% in June
For US and European readers accustomed to the Fed’s 2% target or the ECB’s similar mandate, Japan’s CPI print here sits just below target and has shown no signs of acceleration — a notably different inflation dynamic than what Western central banks have grappled with, and one that keeps the Bank of Japan’s policy calculus relatively unhurried.
Looking Ahead
The July preliminary release is scheduled for September 7, 2026. Whether June’s sharply decelerated retail sales (+0.6% YoY) and the three-month export volume decline (to 104.6) rebound or deteriorate further will be the key swing factor for the next Coincident Index reading and trend assessment.
Disclaimer: This article is for informational purposes only. All investment decisions are made solely at your own risk.