
📺 Watch the Full Video Analysis
This article was automatically generated by the NFC Market Live AI analysis system. (Updated: 2026-07-15 05:32 JST)
📄 Primary Source
NFC Market Live
https://home.treasury.gov/news/press-releases/sb0561
📊 A deep dive into the U.S. Treasury’s May 2026 TIC (Treasury International Capital) data.
Headline net inflows surged 5x to $132.2B from $26.1B in April.
📈 Private investors flipped from a $23.1B outflow to a $172.0B inflow, led by equities.
📉 But foreign official institutions (central banks) flipped from a $49.2B inflow to a $39.9B outflow, dumping $61.0B in T-bills alone.
💡 The improving headline masks a stealth retreat by official reserve managers. We break down what this means for rates and the dollar.
⚠️ This video is for informational purposes only.
The Ultimate Summary: 官民マネーの大逆転劇
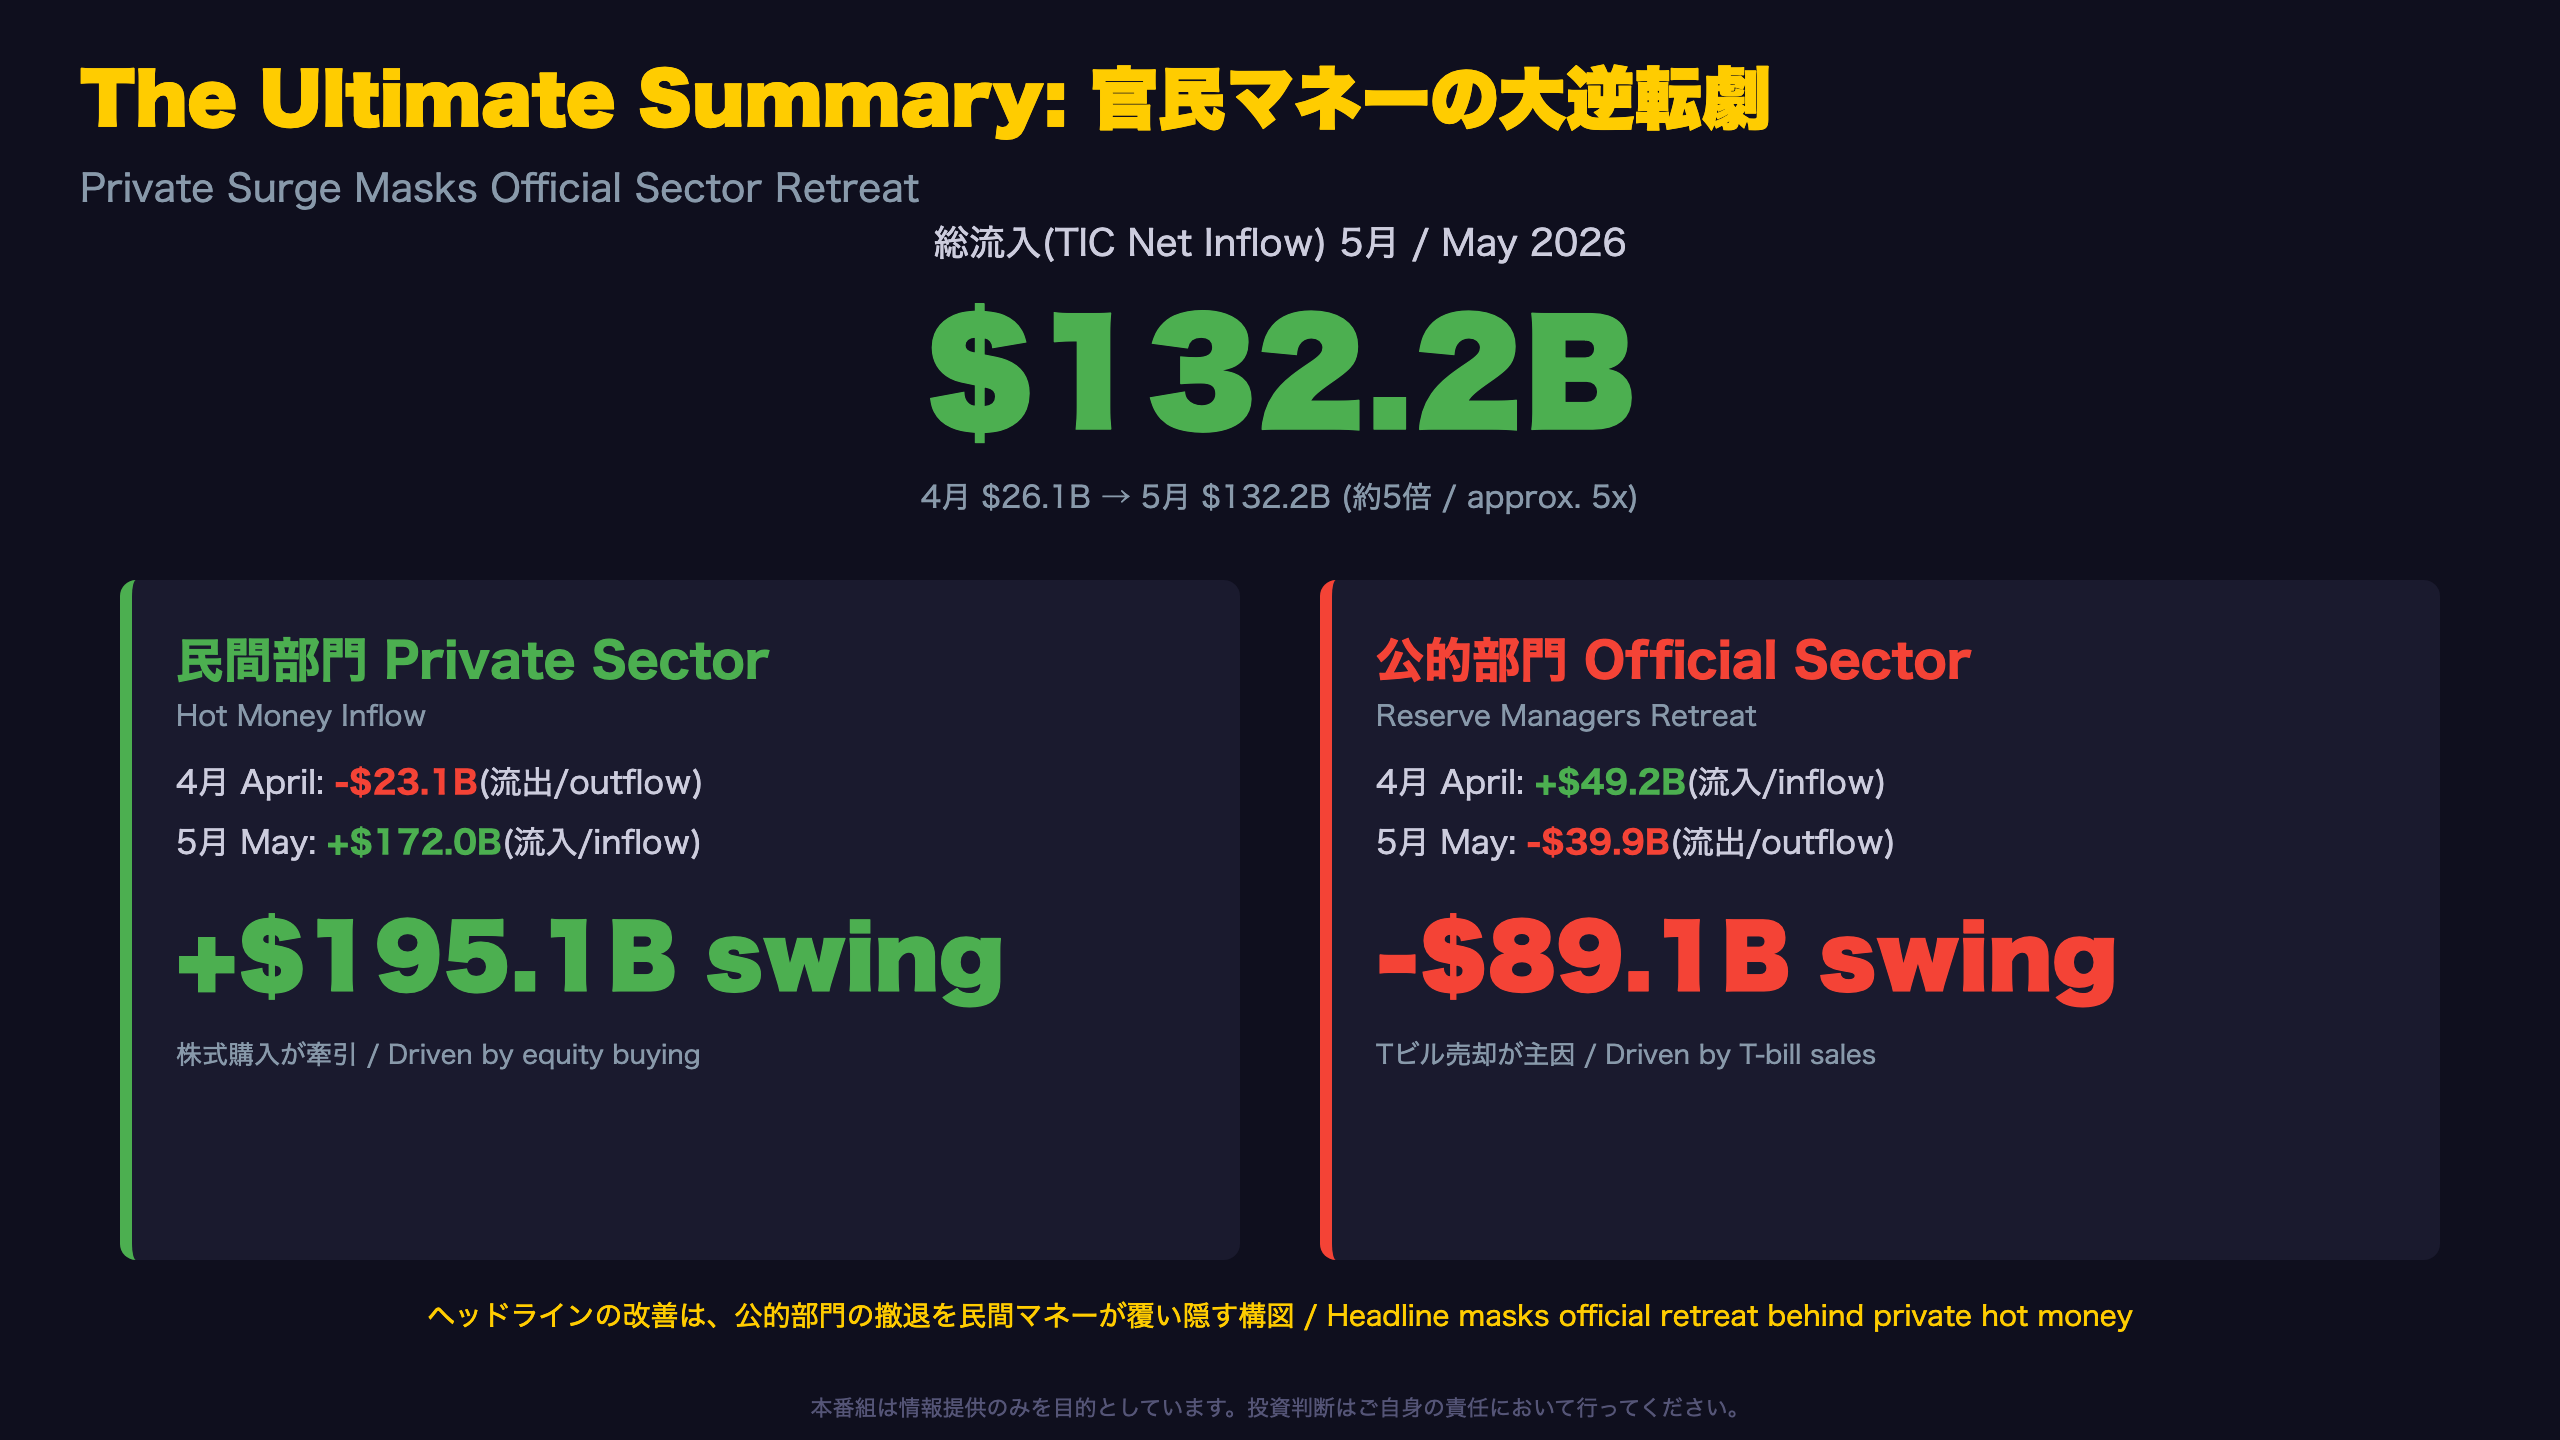
Two Diverging Stories Behind One Headline Number
May’s Treasury International Capital (TIC) data shows a striking headline: total net inflows of $132.2 billion, up from just $26.1 billion in April. But the Treasury’s own release breaks this into two starkly different stories: private net inflows of $172.0 billion against official net outflows of $39.9 billion.
What is TIC data, and why does it matter?
For readers unfamiliar with U.S. macro data, TIC is published monthly by the U.S. Department of the Treasury and tracks cross-border purchases and sales of U.S. and foreign securities. It is one of the few high-frequency windows into who is financing the U.S. current account and fiscal deficits — private asset managers, or foreign central banks managing FX reserves.
Context matters
Official sector inflows were $49.2 billion in April; by May they had reversed to a $39.9 billion outflow — an approximately $89.1 billion one-month swing. This is unusually large relative to the official sector’s typical monthly footprint (full-year 2025 official net was just $16.9 billion for the entire year).
Bull vs. bear read
Bulls will note private demand for U.S. equities and bonds remains robust — a vote of confidence from asset managers. Bears will point out that reliance on private “hot money” to fund U.S. external financing needs, as official buyers step back, introduces greater flow volatility.
The next TIC release (June data) arrives August 17, 2026 — a key checkpoint for whether this official-sector retreat persists.
長期証券フローの中身:官民ダイバージェンス
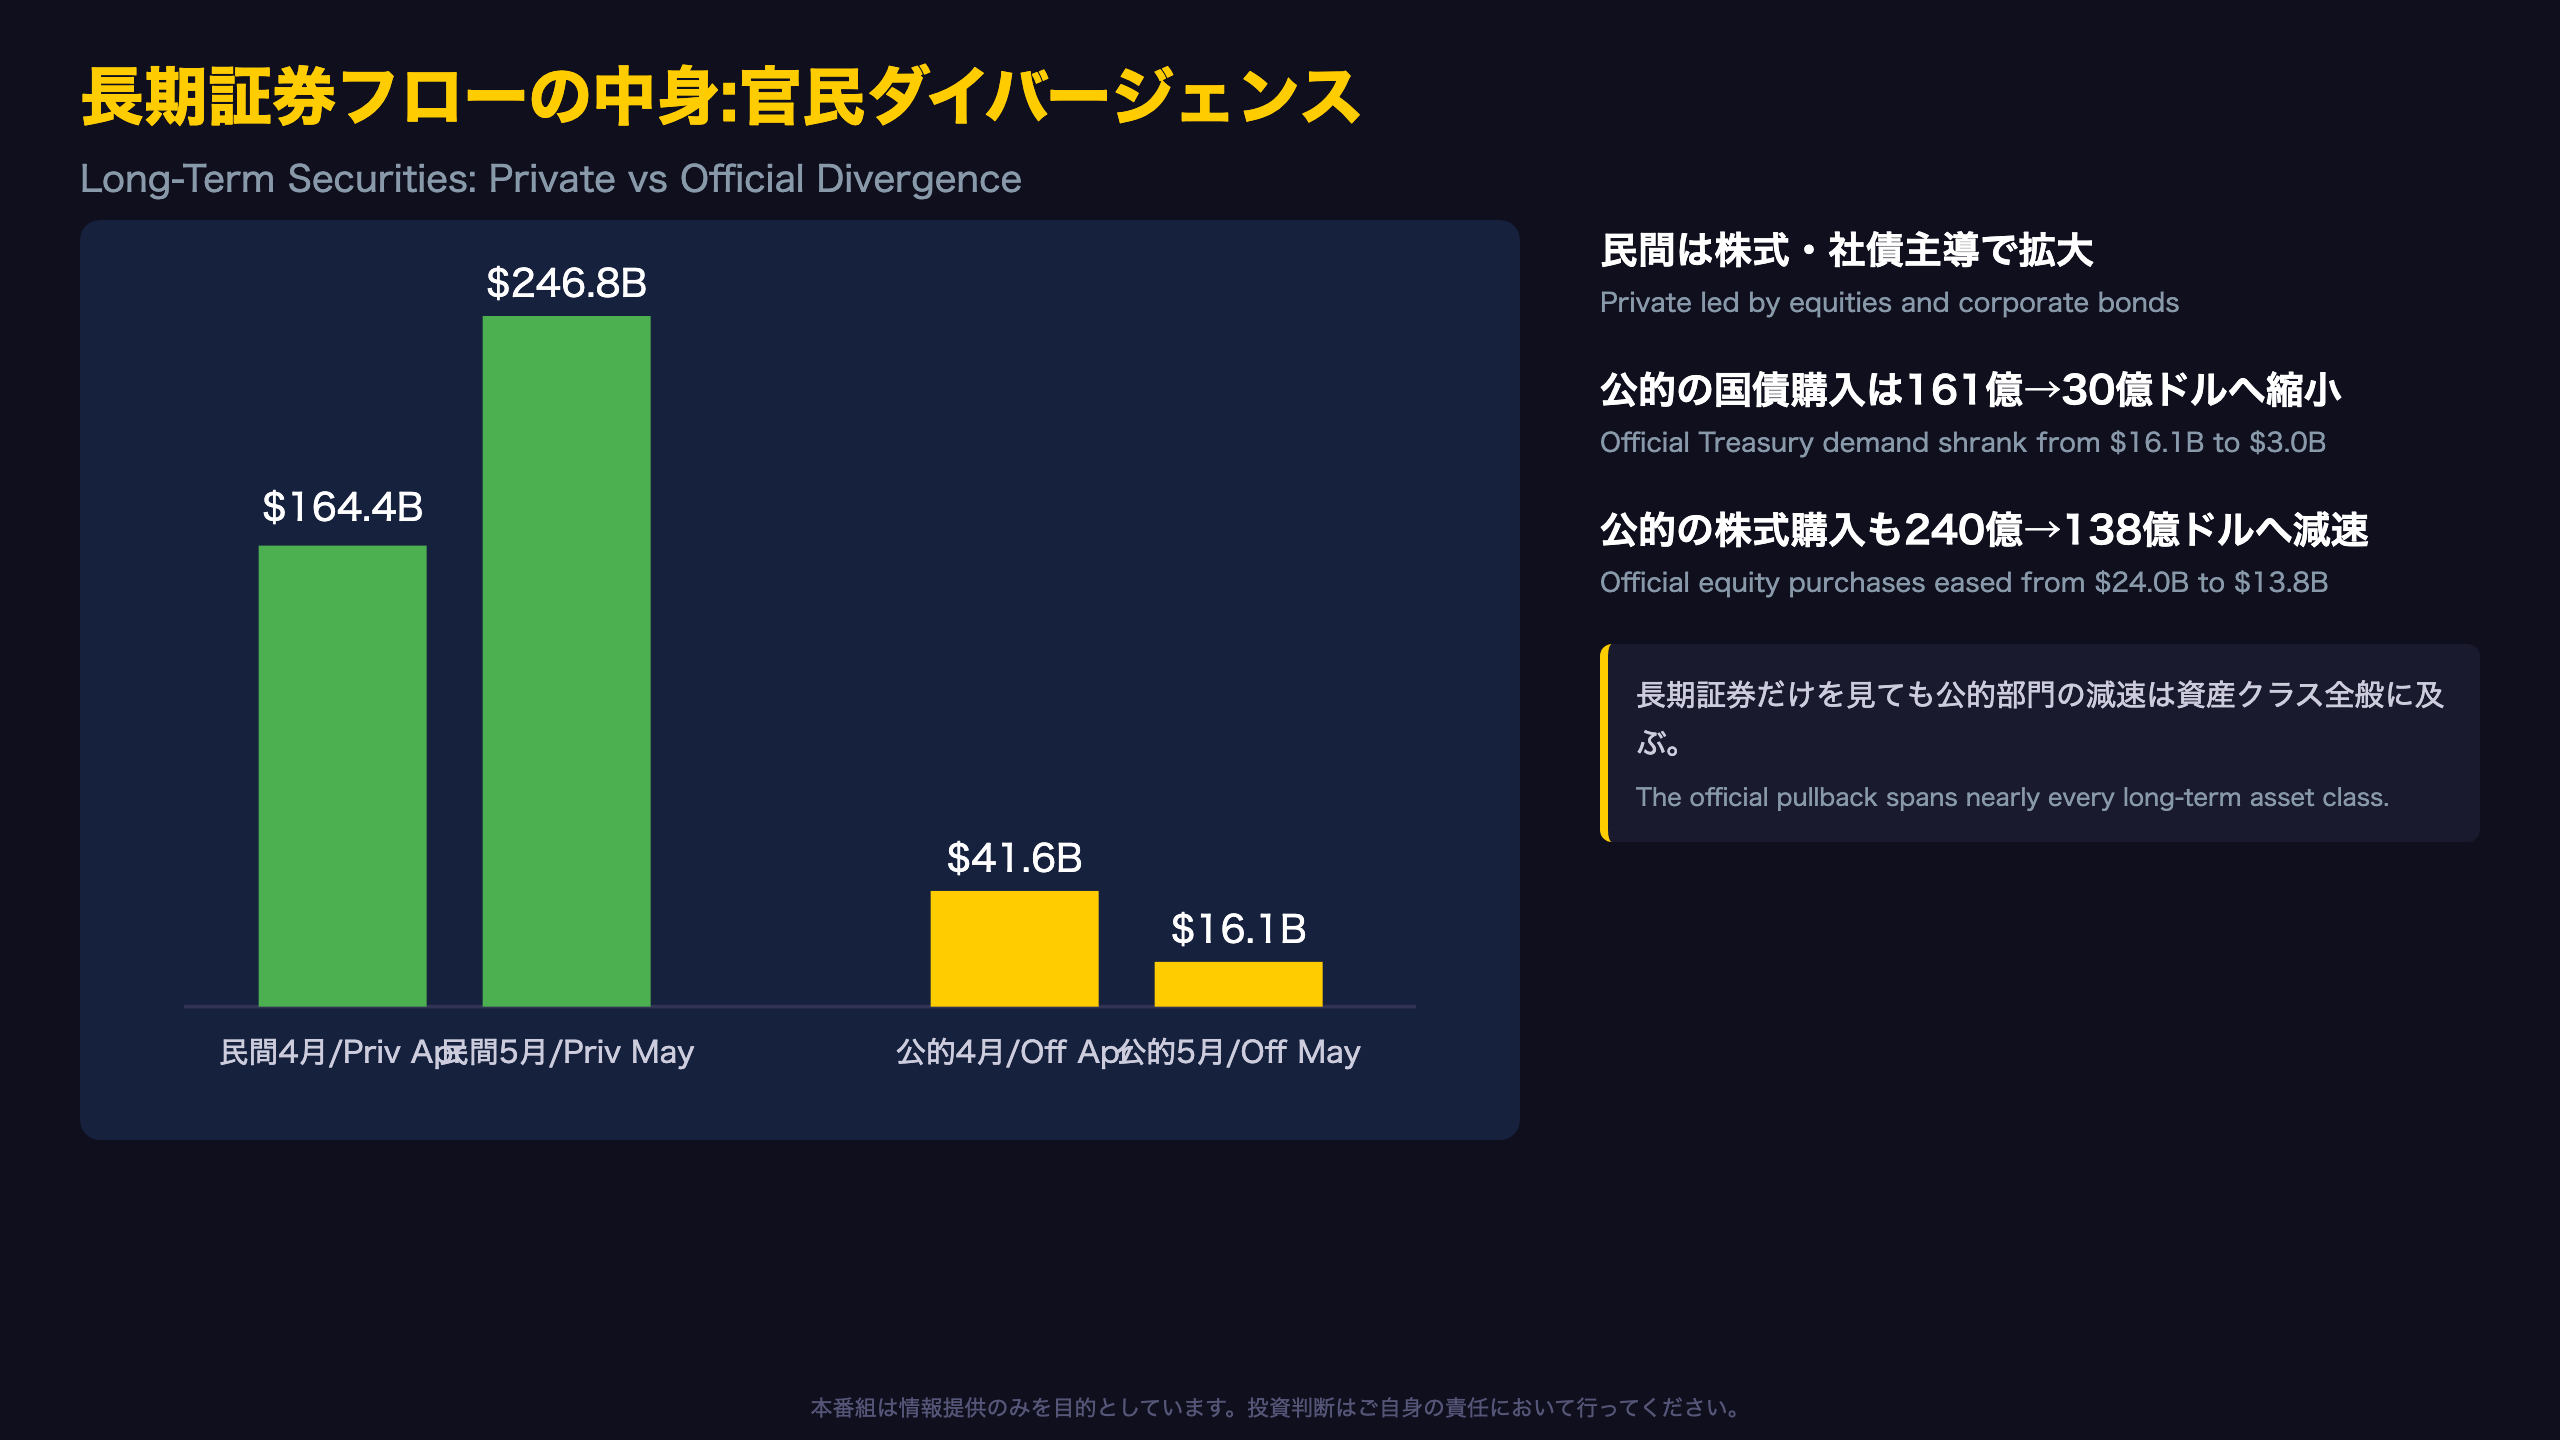
Within Long-Term Securities Alone, the Divergence Holds
Breaking down lines 4 and 9 of the Treasury’s TIC table reveals the private-official divergence persists even within the long-term securities category specifically (excluding short-term bills and banking flows).
| Category | April | May |
|---|---|---|
| Private net purchases | $164.4B | $246.8B |
| Official net purchases | $41.6B | $16.1B |
Sub-index detail
Within official flows, Treasury bonds and notes fell from $16.1B to just $3.0B, agency bonds went further negative (-$1.1B to -$4.6B), and equities purchases shrank from $24.0B to $13.8B. This is not a single asset class effect — the official-sector slowdown is broad-based across the long-term curve.
For international readers
Unlike the Fed’s balance sheet data, TIC data captures foreign holdings via custodial reporting, meaning the “official” bucket includes foreign central banks and sovereign wealth-style entities managing FX reserves — a very different investor base from private hedge funds or asset managers, with different objectives (reserve adequacy vs. return-seeking).
A counter-argument
One could argue this is simple monthly rebalancing noise; the Treasury itself notes official-sector data carries a known “transaction bias” and can swing meaningfully month to month. A single month’s data is not sufficient to confirm a structural shift in reserve allocation.
Tビル投げ売り:公的部門の急反転
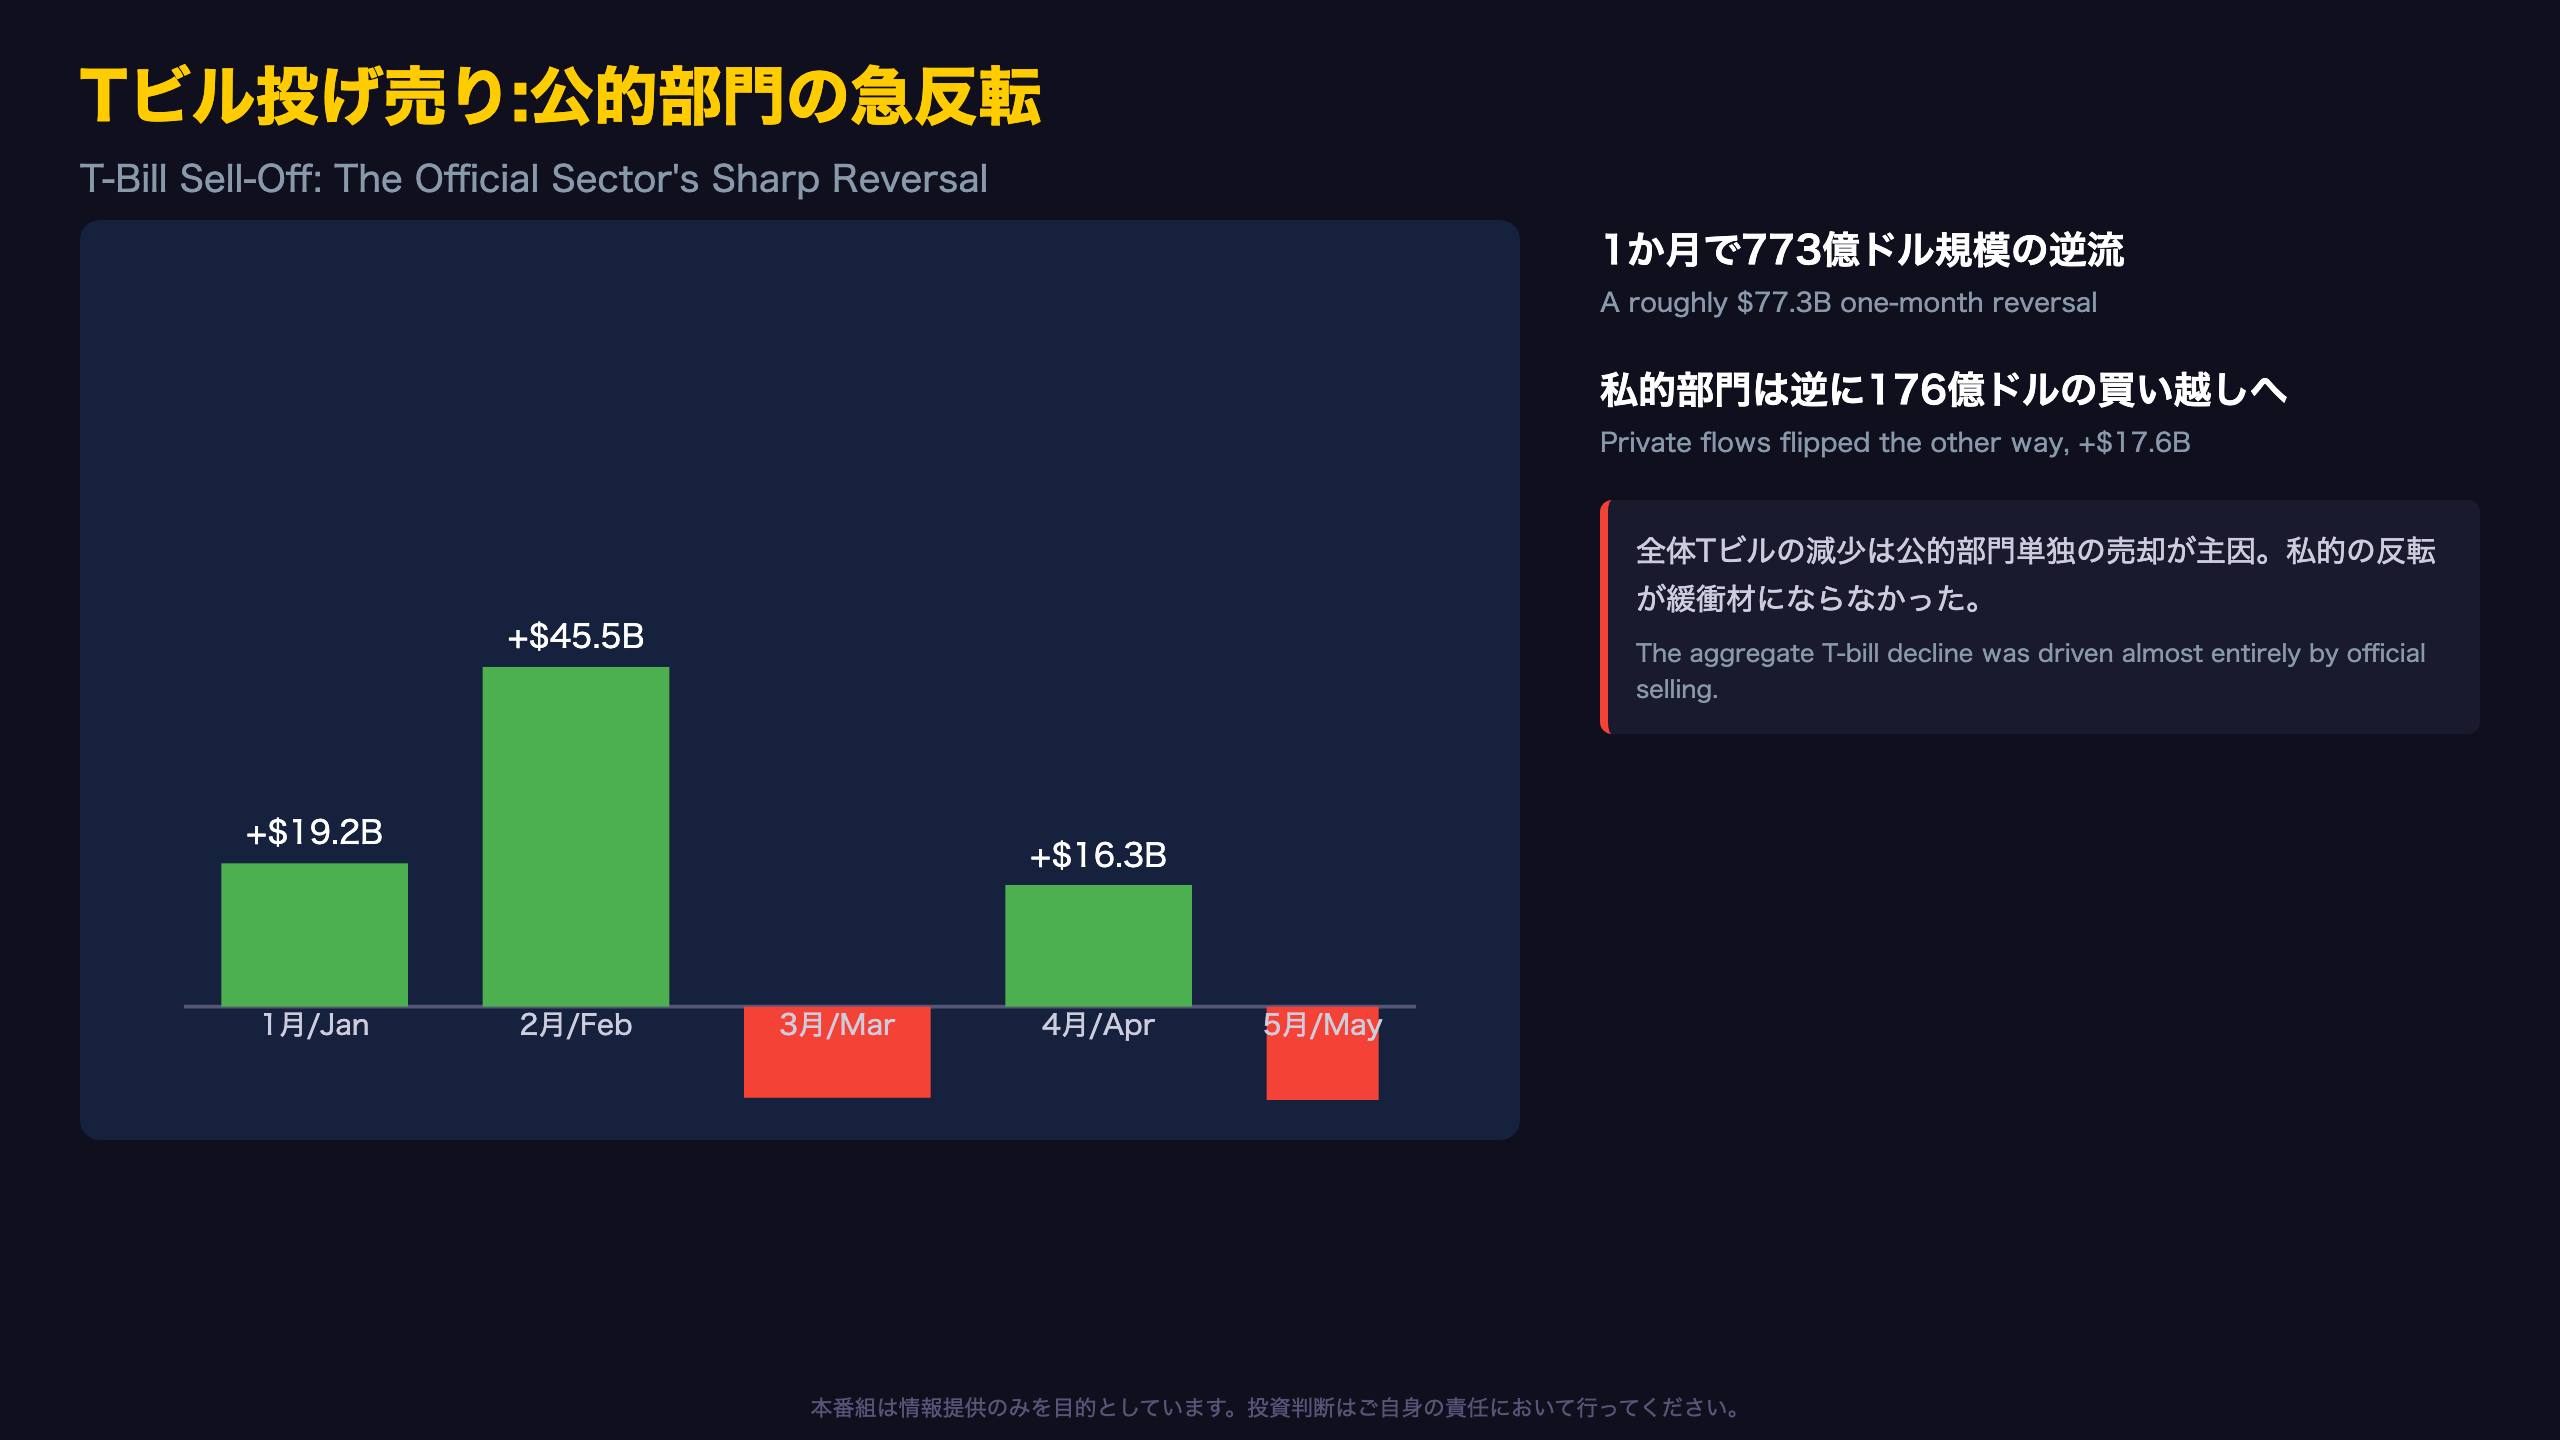
Treasury Bills: The Standout Anomaly in This Release
Lines 23-25 of the Treasury’s TIC table reveal the clearest anomaly in this month’s release: a dramatic swing in official-sector demand for Treasury bills.
“Foreign residents decreased their holdings of U.S. Treasury bills by $43.5 billion” — May 2026 TIC press release
Monthly official T-bill flows ($ billions)
Jan +19.2 / Feb +45.5 / Mar -12.2 / Apr +16.3 / May -61.0
After two months of buying in January-February, official demand dipped in March, recovered in April, then collapsed to the largest sell-off in this five-month window in May — an outlier relative to the recent range.
Why this matters for U.S. investors
Unlike private funds, official-sector T-bill holders are typically foreign central banks managing FX reserves for liquidity and safety, not yield. A sharp, one-month reversal of this magnitude in a historically stable investor base is unusual and worth monitoring, even though the Treasury itself cautions that custodial data cannot pinpoint which country is selling.
A caveat worth noting
Private T-bill flows moved the opposite way in May (+$17.6B, reversing April’s -$29.9B outflow), meaning the aggregate T-bill decline ($43.5B) was driven almost entirely by the official-sector reversal, not a broad-based flight from short-term Treasuries.
株式への資金流入:民間マネーの勢い
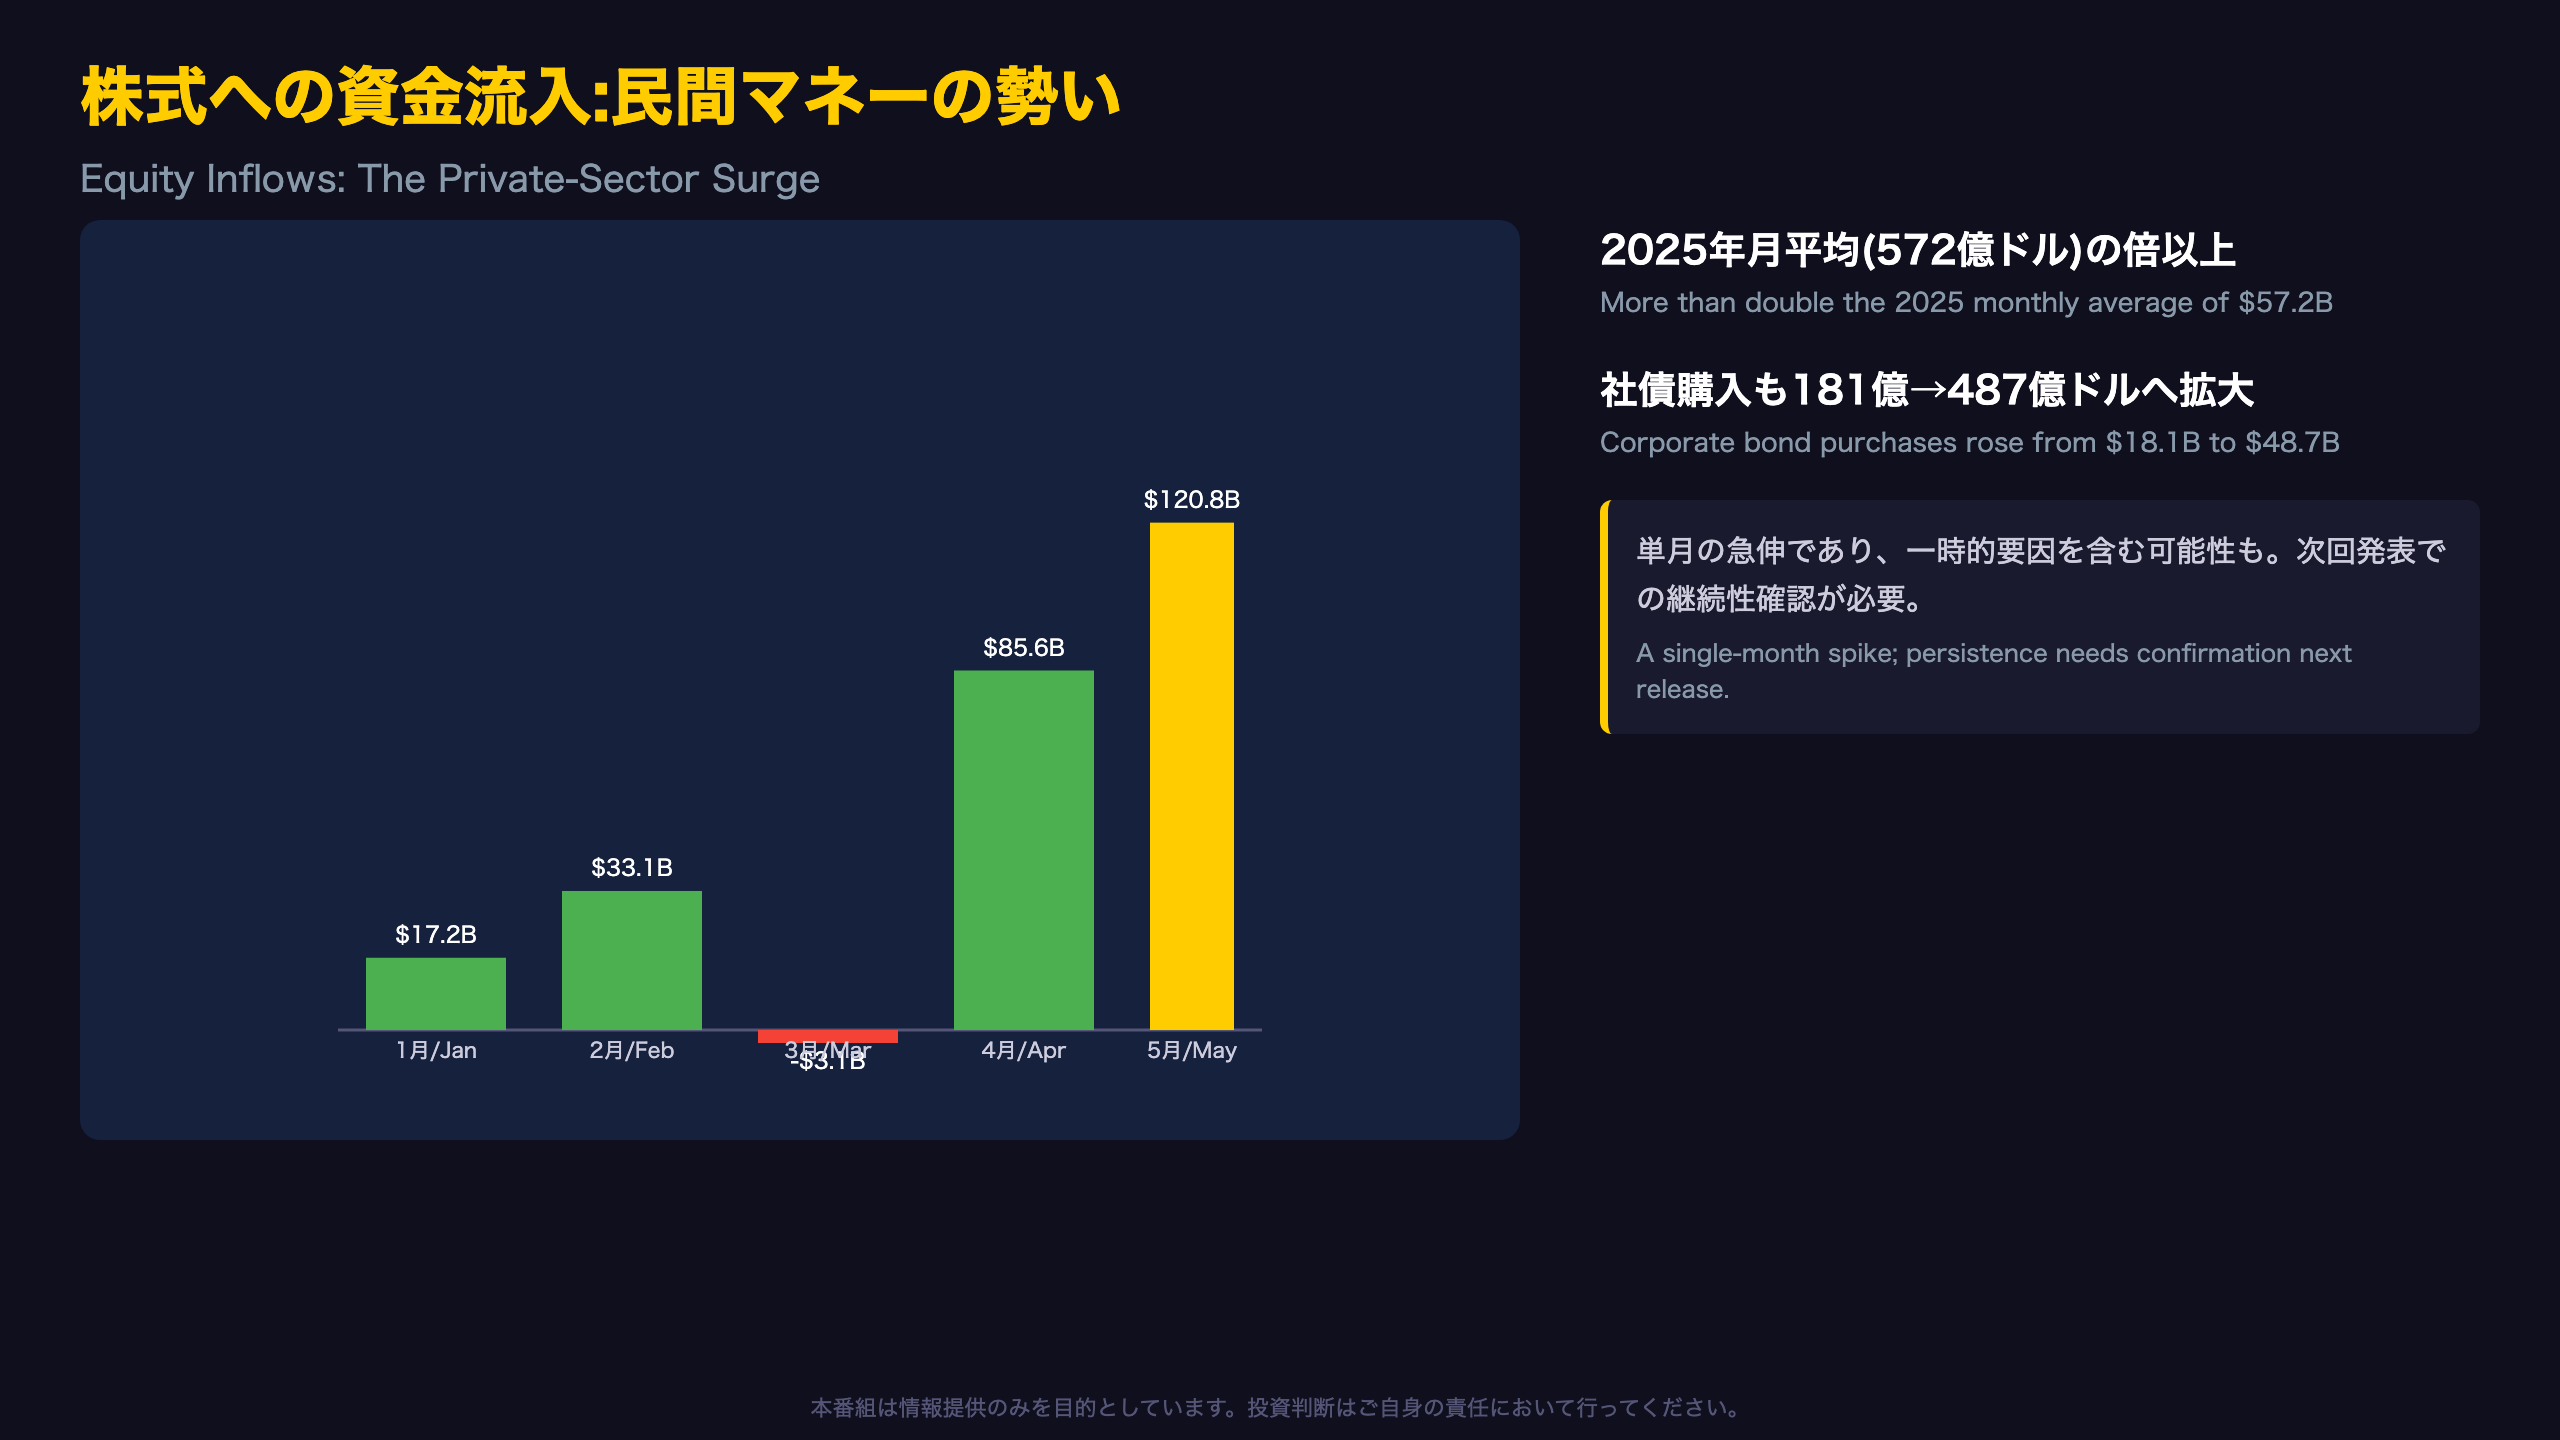
A Single Month, But a Striking Signal in Equity Demand
Line 8 of the Treasury’s table (private, equities, net) shows May’s $120.8 billion as the strongest reading in the past five months.
Monthly private equity flows ($ billions)
Jan 17.2 / Feb 33.1 / Mar -3.1 / Apr 85.6 (revised) / May 120.8
After turning negative in March, the series accelerated for two consecutive months — arguably less a one-off spike than an extension of a building recovery trend.
Benchmarking against the annual pace
Full-year 2025 private equity net purchases totaled $686.1 billion, or about $57.2 billion per month. The trailing 12 months through May 2026 totaled $780.5 billion, or roughly $65 billion per month — already running hot. May’s single-month figure of $120.8 billion is nearly double even this elevated 12-month average.
Context for global investors
Unlike Japan’s Ministry of Finance weekly portfolio flow data, which reports gross transactions, U.S. TIC data reports net purchases and captures both hedge funds and long-only asset managers under “private.” A reading this far above trend deserves scrutiny rather than automatic bullish extrapolation.
The skeptical counterpoint
One caveat: single-month spikes in custodial equity data can reflect one-off corporate actions (stock swaps, buybacks routed through foreign custodians) rather than a durable shift in foreign risk appetite. The Treasury’s methodology notes do not disaggregate transaction types.
12か月累計で見る潮流:鈍化する全体像
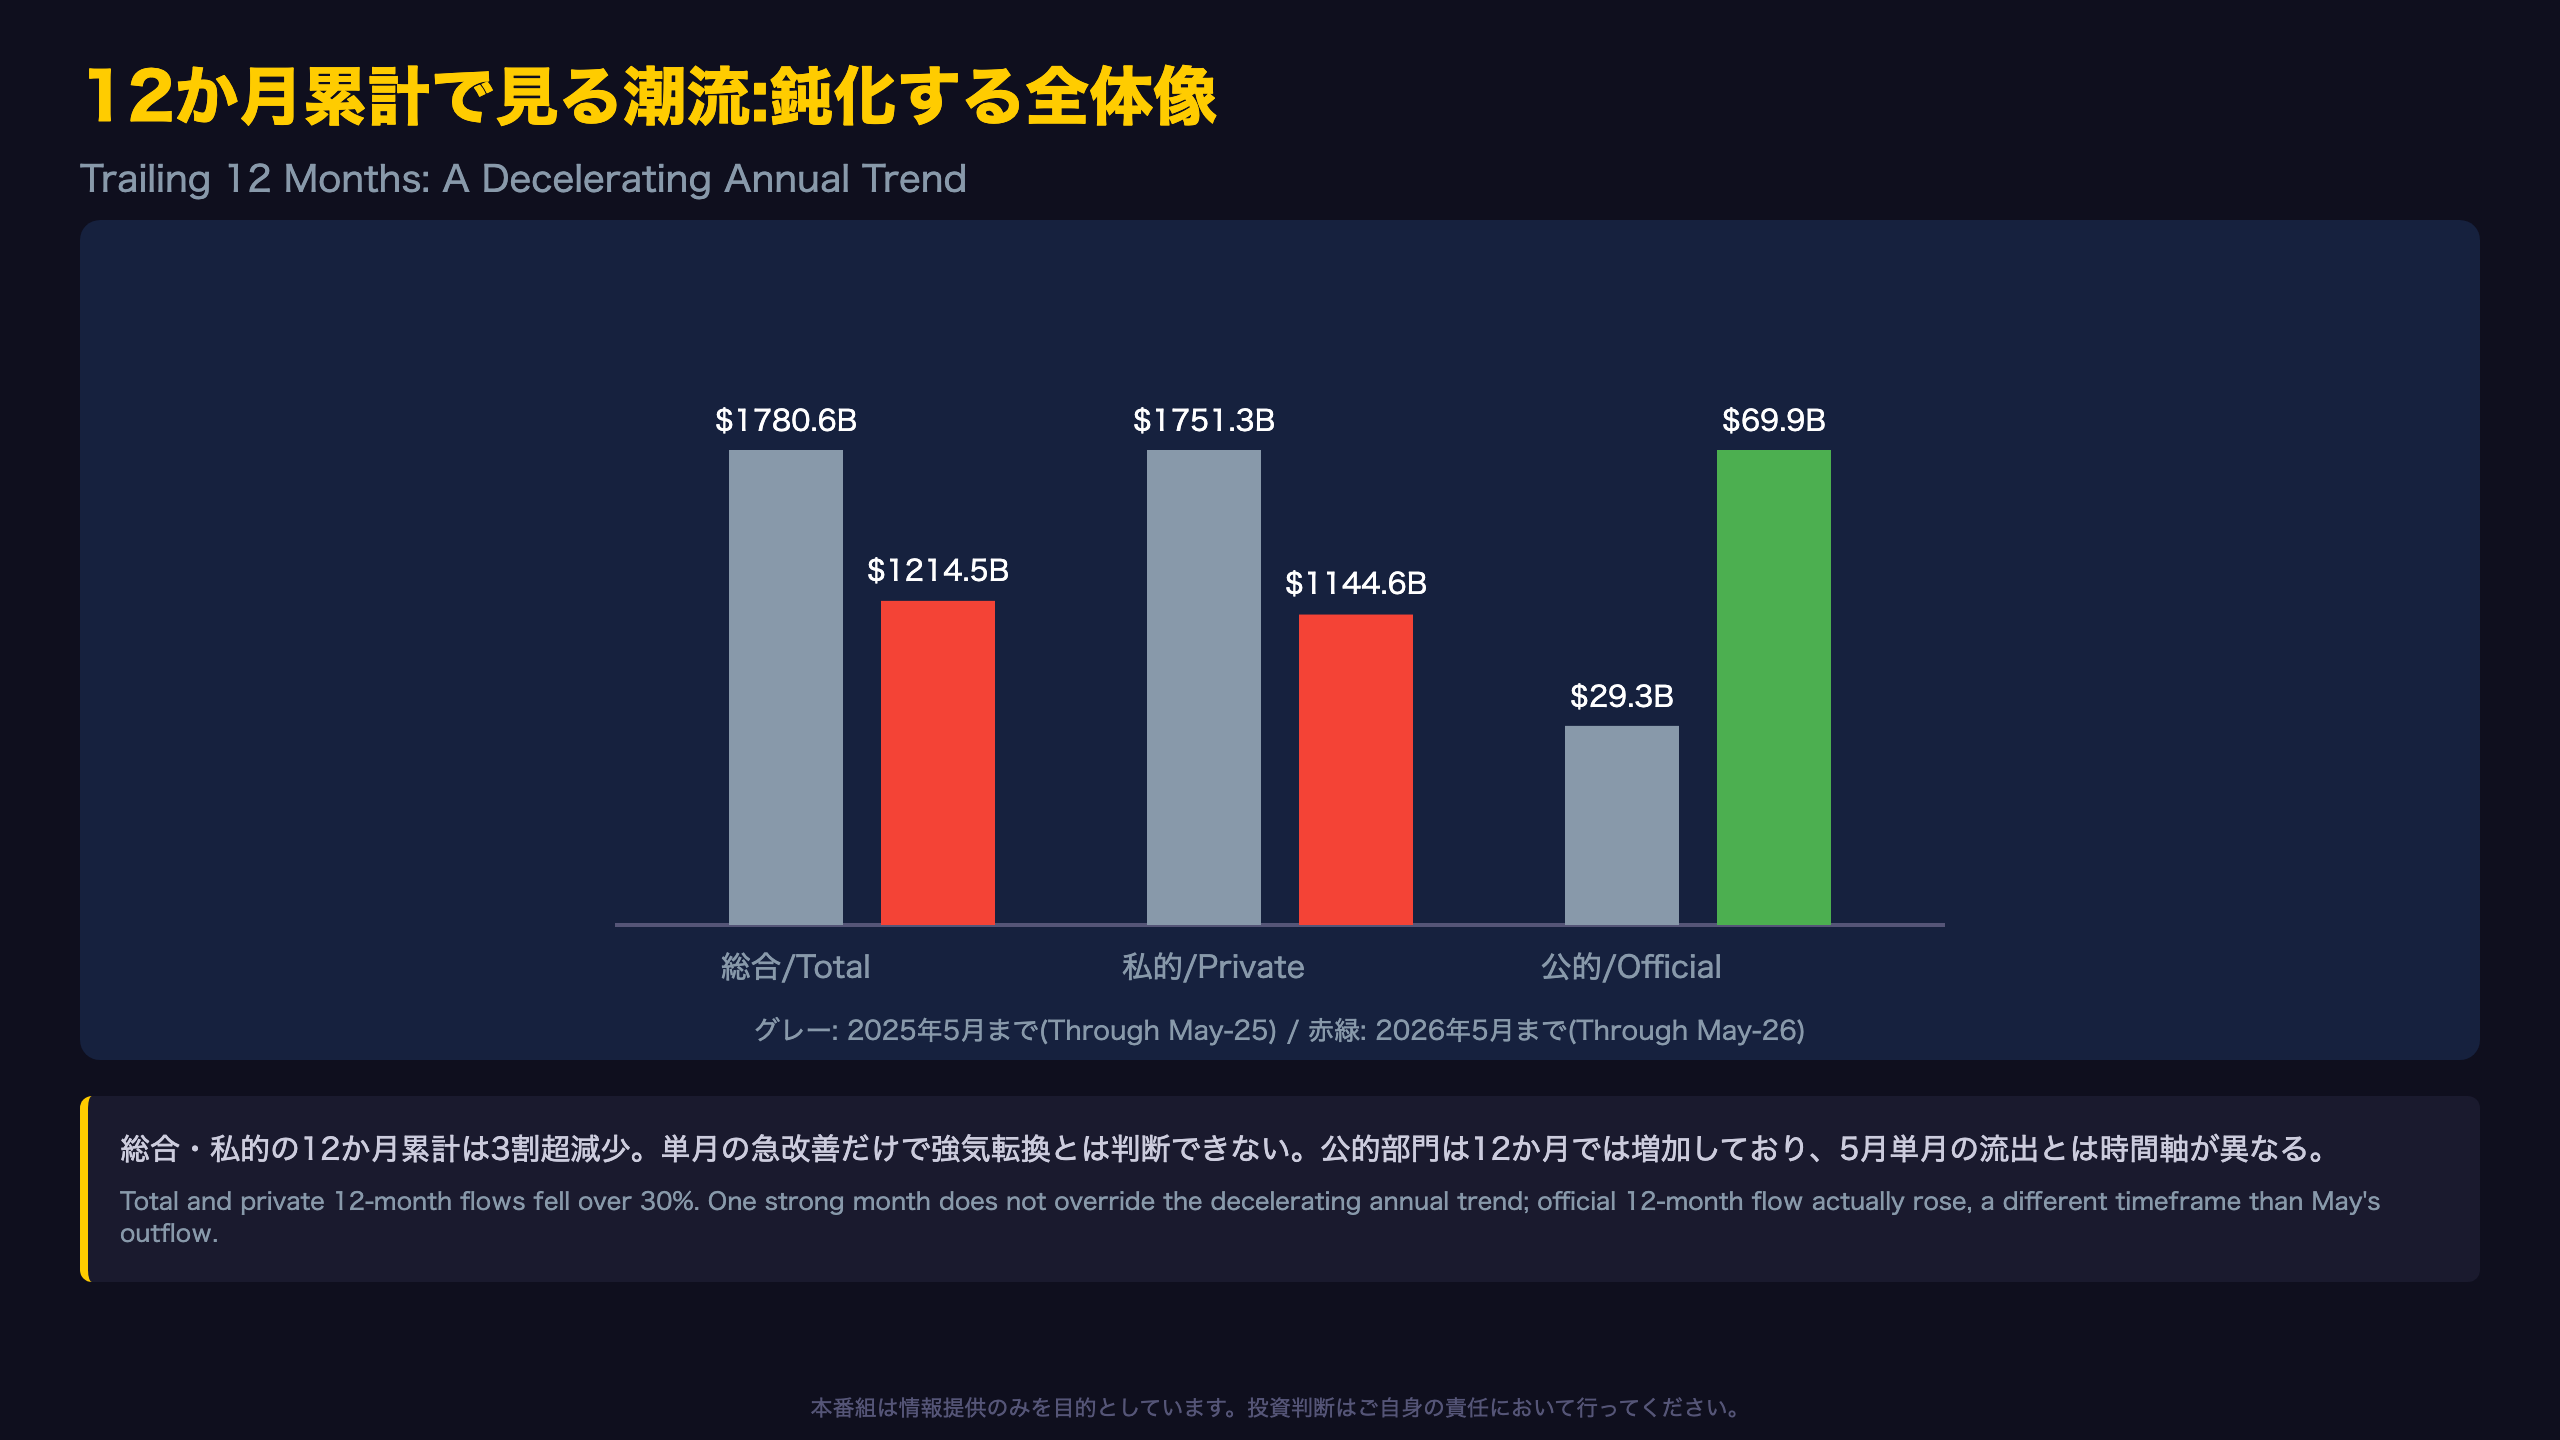
Annual Trend Diverges from the Single-Month Surge
The “12 Months Through” columns in the Treasury’s table (lines 30-32) tell a story quite different from the single strong month of May.
| Category | Through May 2025 | Through May 2026 | Change |
|---|---|---|---|
| Total | $1,780.6B | $1,214.5B | -31.8% |
| Private | $1,751.3B | $1,144.6B | -34.7% |
| Official | $29.3B | $69.9B | +138.6% |
Interestingly, the official sector’s 12-month total actually rose year-over-year, even though May itself saw a sharp official-sector outflow. This is not necessarily a contradiction — official flows are known to swing significantly month to month, and a single month’s reversal does not override the annual trend.
A sub-indicator worth flagging: bank liabilities
Line 29 (change in banks’ own net dollar-denominated liabilities to foreign residents) is also notable. The 12-month total swung from a $294.8 billion increase (through May 2025) to a $229.9 billion decrease (through May 2026) — suggesting U.S. banks have been shrinking their dollar-denominated liabilities to foreign residents (e.g., deposits), a separate structural signal in short-term dollar funding markets.
For readers used to Fed or BOJ balance sheet data
Unlike the Federal Reserve’s H.4.1 balance sheet release, TIC data measures cross-border private capital flows rather than central bank asset holdings — making it a distinct, complementary lens on dollar liquidity conditions abroad.
Looking ahead
Whether May’s improvement marks a genuine inflection or a temporary bounce within a decelerating annual trend will become clearer with the June data, due August 17, 2026.
市場へのインプリケーション
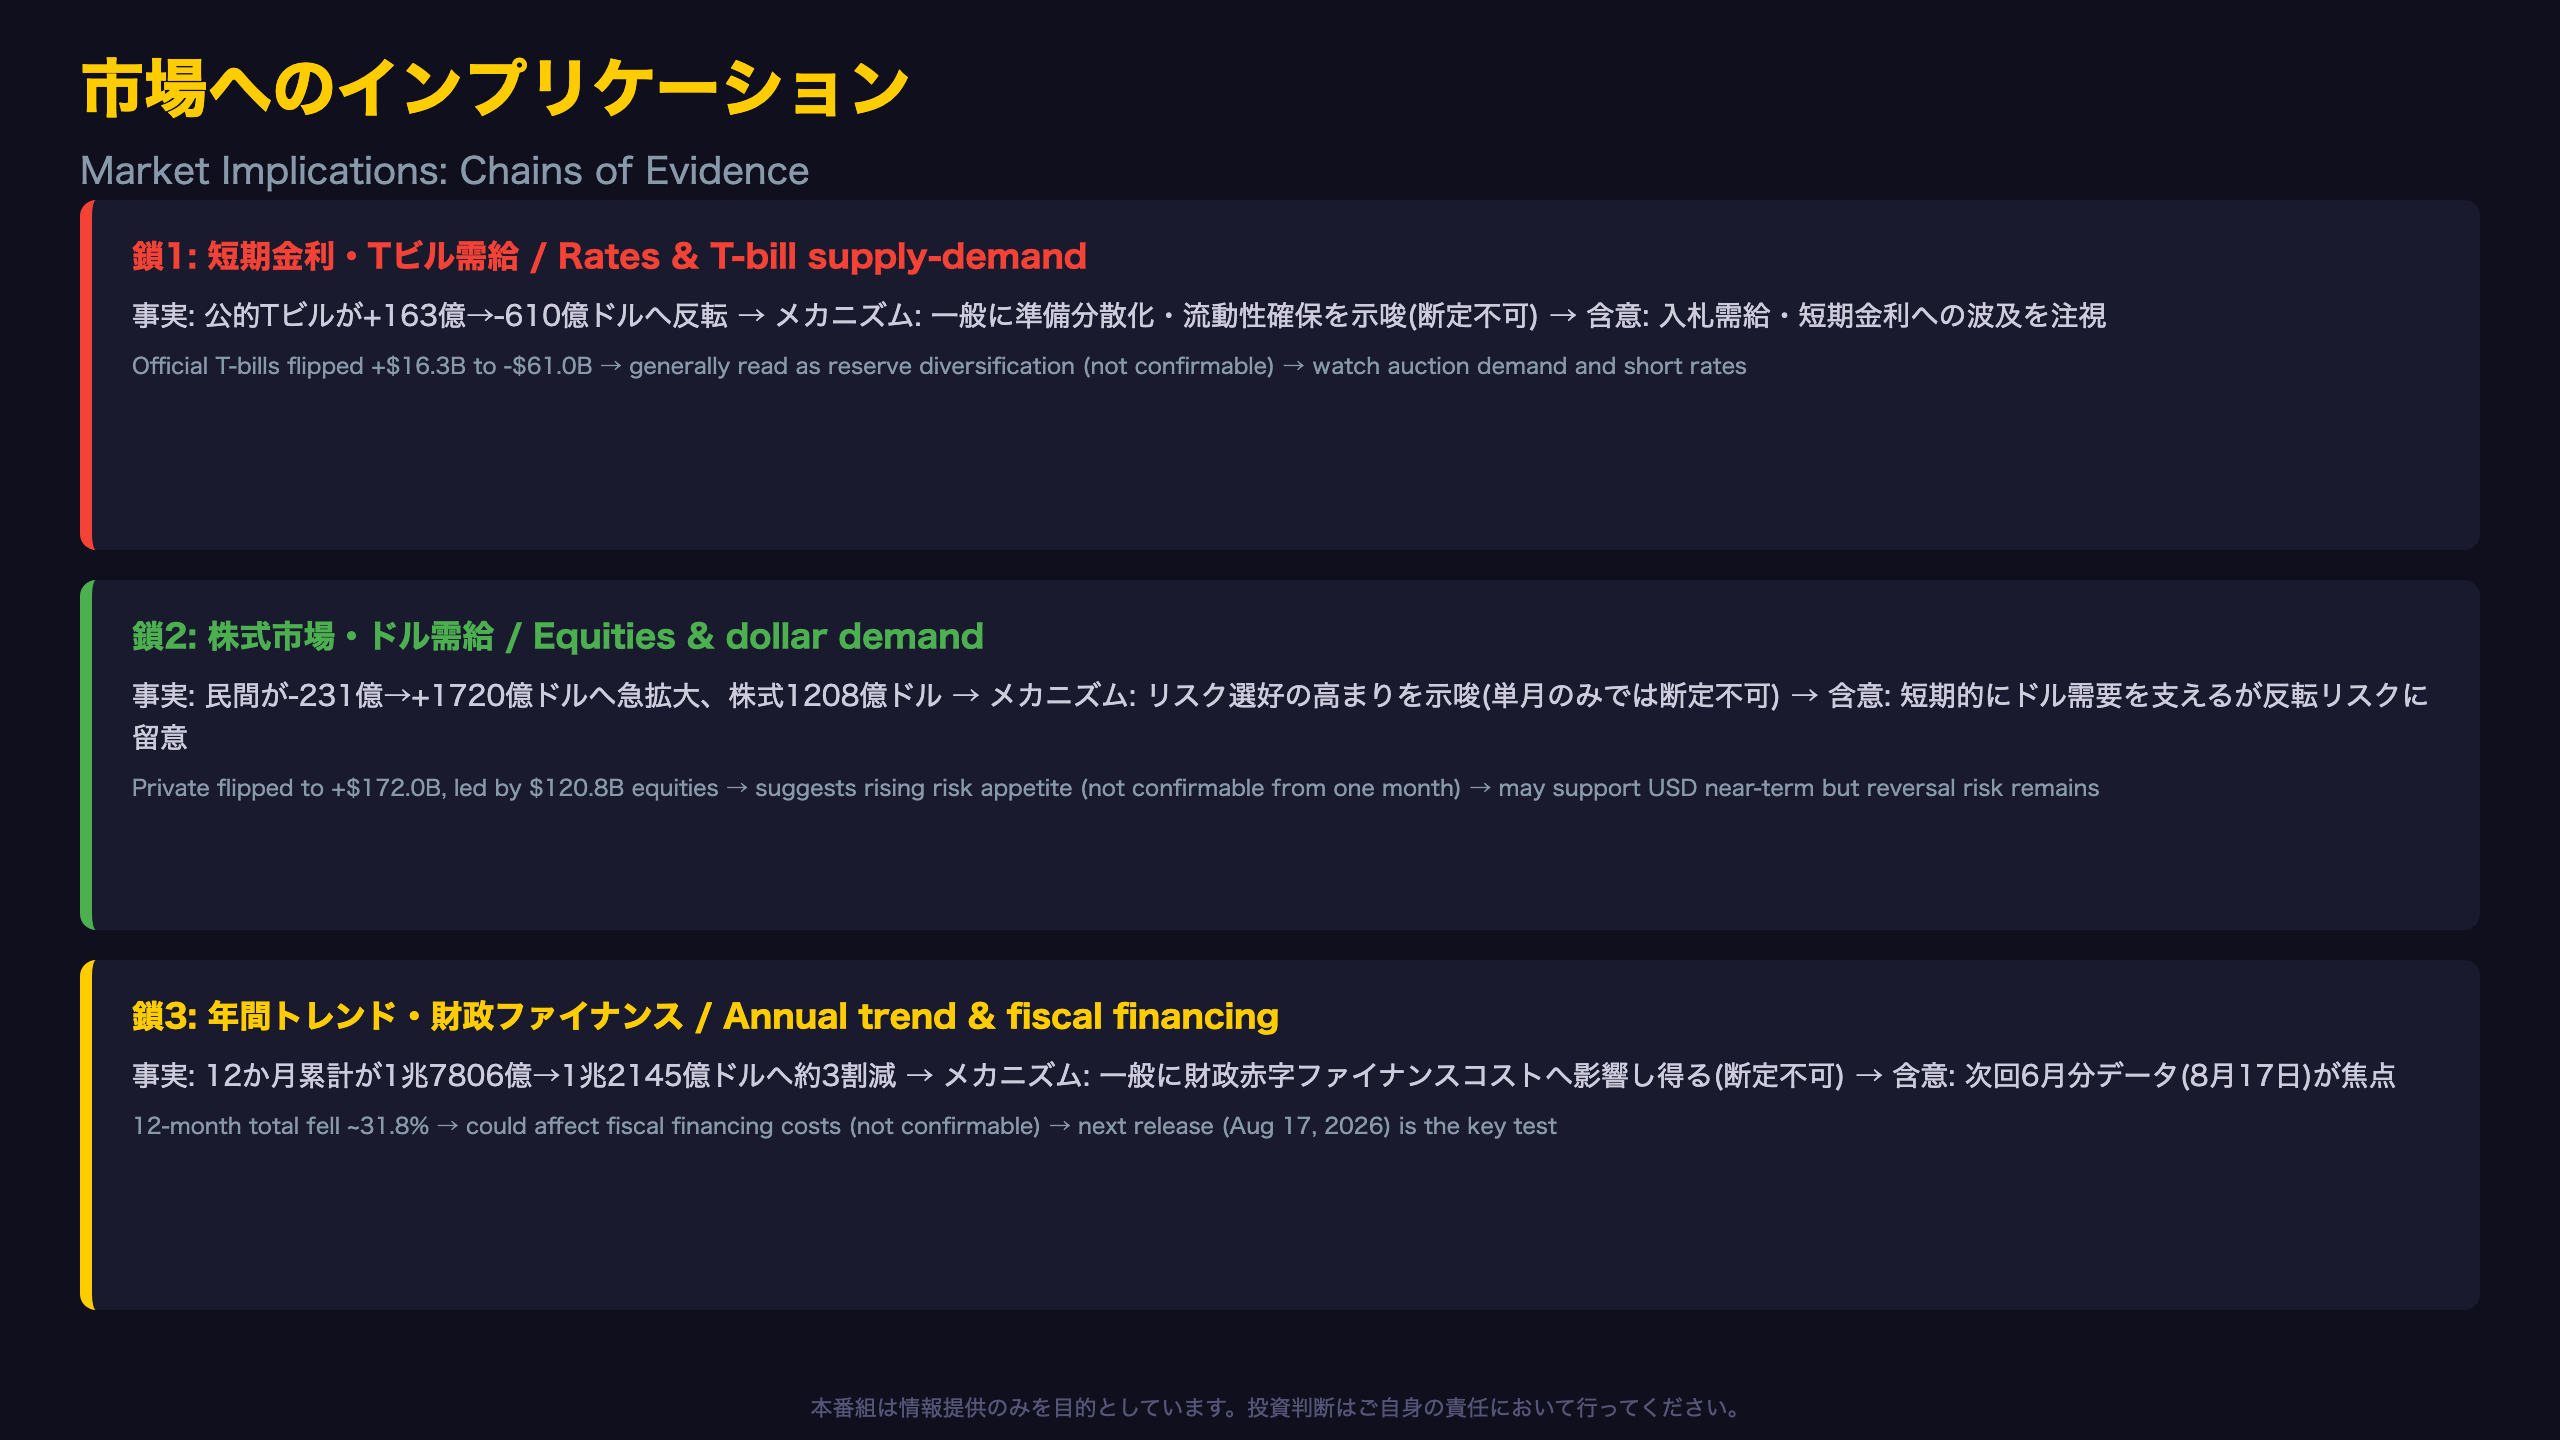
Chains of Evidence: From Data to Market Implications
Chain 1: Short-term rates and T-bill supply/demand
[Fact] Official T-bill flows swung from +$16.3B in April to -$61.0B in May, a ~$77.3B reversal → [Mechanism] Official-sector Treasury bill sales are generally thought to reflect reserve diversification or liquidity needs, though this single data point cannot confirm which country or what the intent was → [Market implication] Weaker official demand at T-bill auctions could affect short-term rates and repo market dynamics; the next TIC release and upcoming auction results warrant close monitoring.
Chain 2: Equity markets and dollar demand
[Fact] Private net purchases surged from -$23.1B in April to +$172.0B in May, led by $120.8B in equity purchases → [Mechanism] Rising private-sector inflows into risk assets are generally read as a sign of dollar-asset demand, but given high month-to-month volatility in this series, a single month cannot confirm a trend reversal → [Market implication] This may support U.S. equity demand and the dollar in the near term, but as official-sector support recedes, such hot money flows are more prone to sudden reversal during risk-off episodes.
Chain 3: Annual trend and fiscal financing
[Fact] The trailing 12-month total inflow fell roughly 31.8%, from $1,780.6B to $1,214.5B → [Mechanism] A deceleration in capital inflows is generally thought to affect the cost of financing fiscal and current account deficits, though a strong single month was observed simultaneously, so this data alone cannot confirm a persistent decline → [Market implication] The June TIC release (due August 17, 2026) will be the key test of whether private-led inflows persist or official-sector selling deepens.
The Treasury itself cautions that “it is difficult to draw precise conclusions… about changes in the foreign holdings of U.S. financial assets by individual countries” — a caveat that should temper any strong directional conclusions drawn from this release alone.
Disclaimer: This article is for informational purposes only. All investment decisions are made solely at your own risk.







