📺 Watch the Full Video Analysis
This article was automatically generated by the NFC Market Live AI analysis system. (Updated: 2026-07-14 21:40 JST)
📄 Primary Source
U.S. Bureau of Labor Statistics
https://www.bls.gov/news.release/cpi.htm
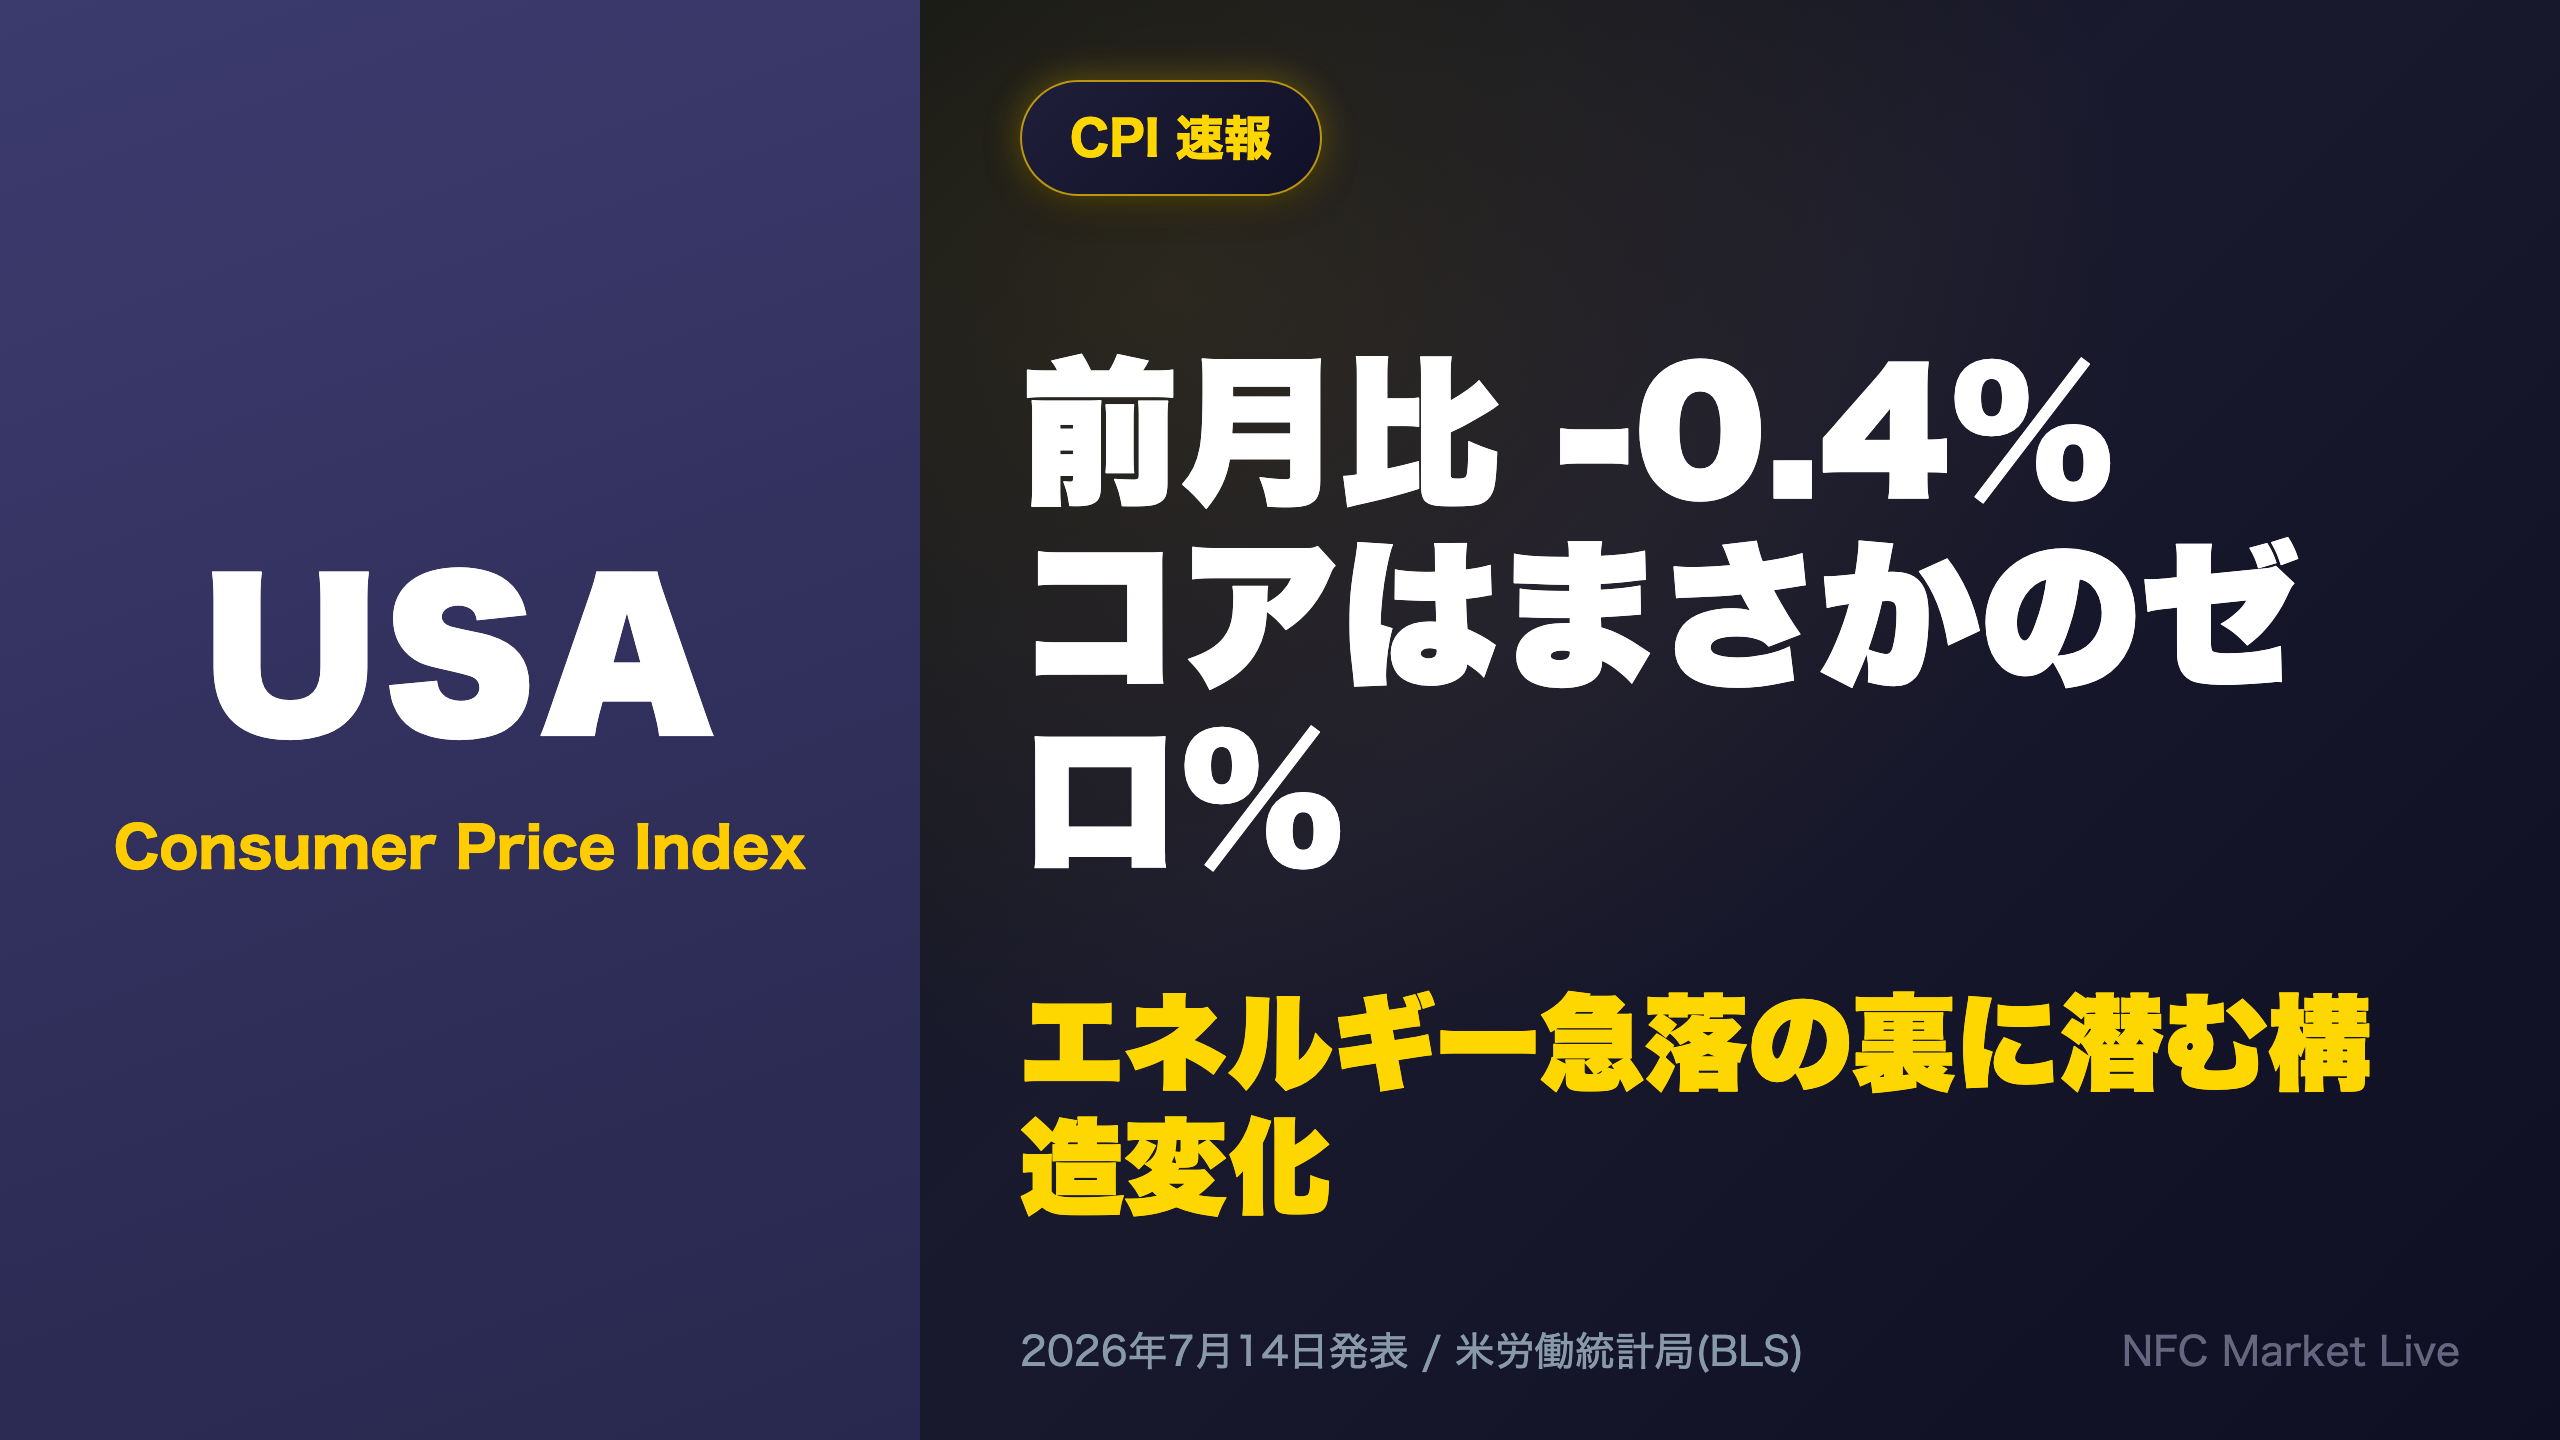
📊 US June CPI fell 0.4% month-over-month, the largest monthly decline since April 2020.
Year-over-year inflation decelerated to 3.5% from May’s 4.2%.
💡 However, the decline was driven largely by an energy price plunge (-5.7%), reversing the sharp gains seen from March through May.
⚠️ Core CPI (ex-food and energy) was flat at 0.0% month-over-month—the smallest change since January 2021. Shelter costs also grew at their slowest pace since then, while auto insurance, communication, and apparel all turned negative simultaneously.
📈 We break down what this means for Fed rate cut expectations and markets, based strictly on the data.
6月CPI総括:歴史的急減速の裏側
Overview of the June CPI Report
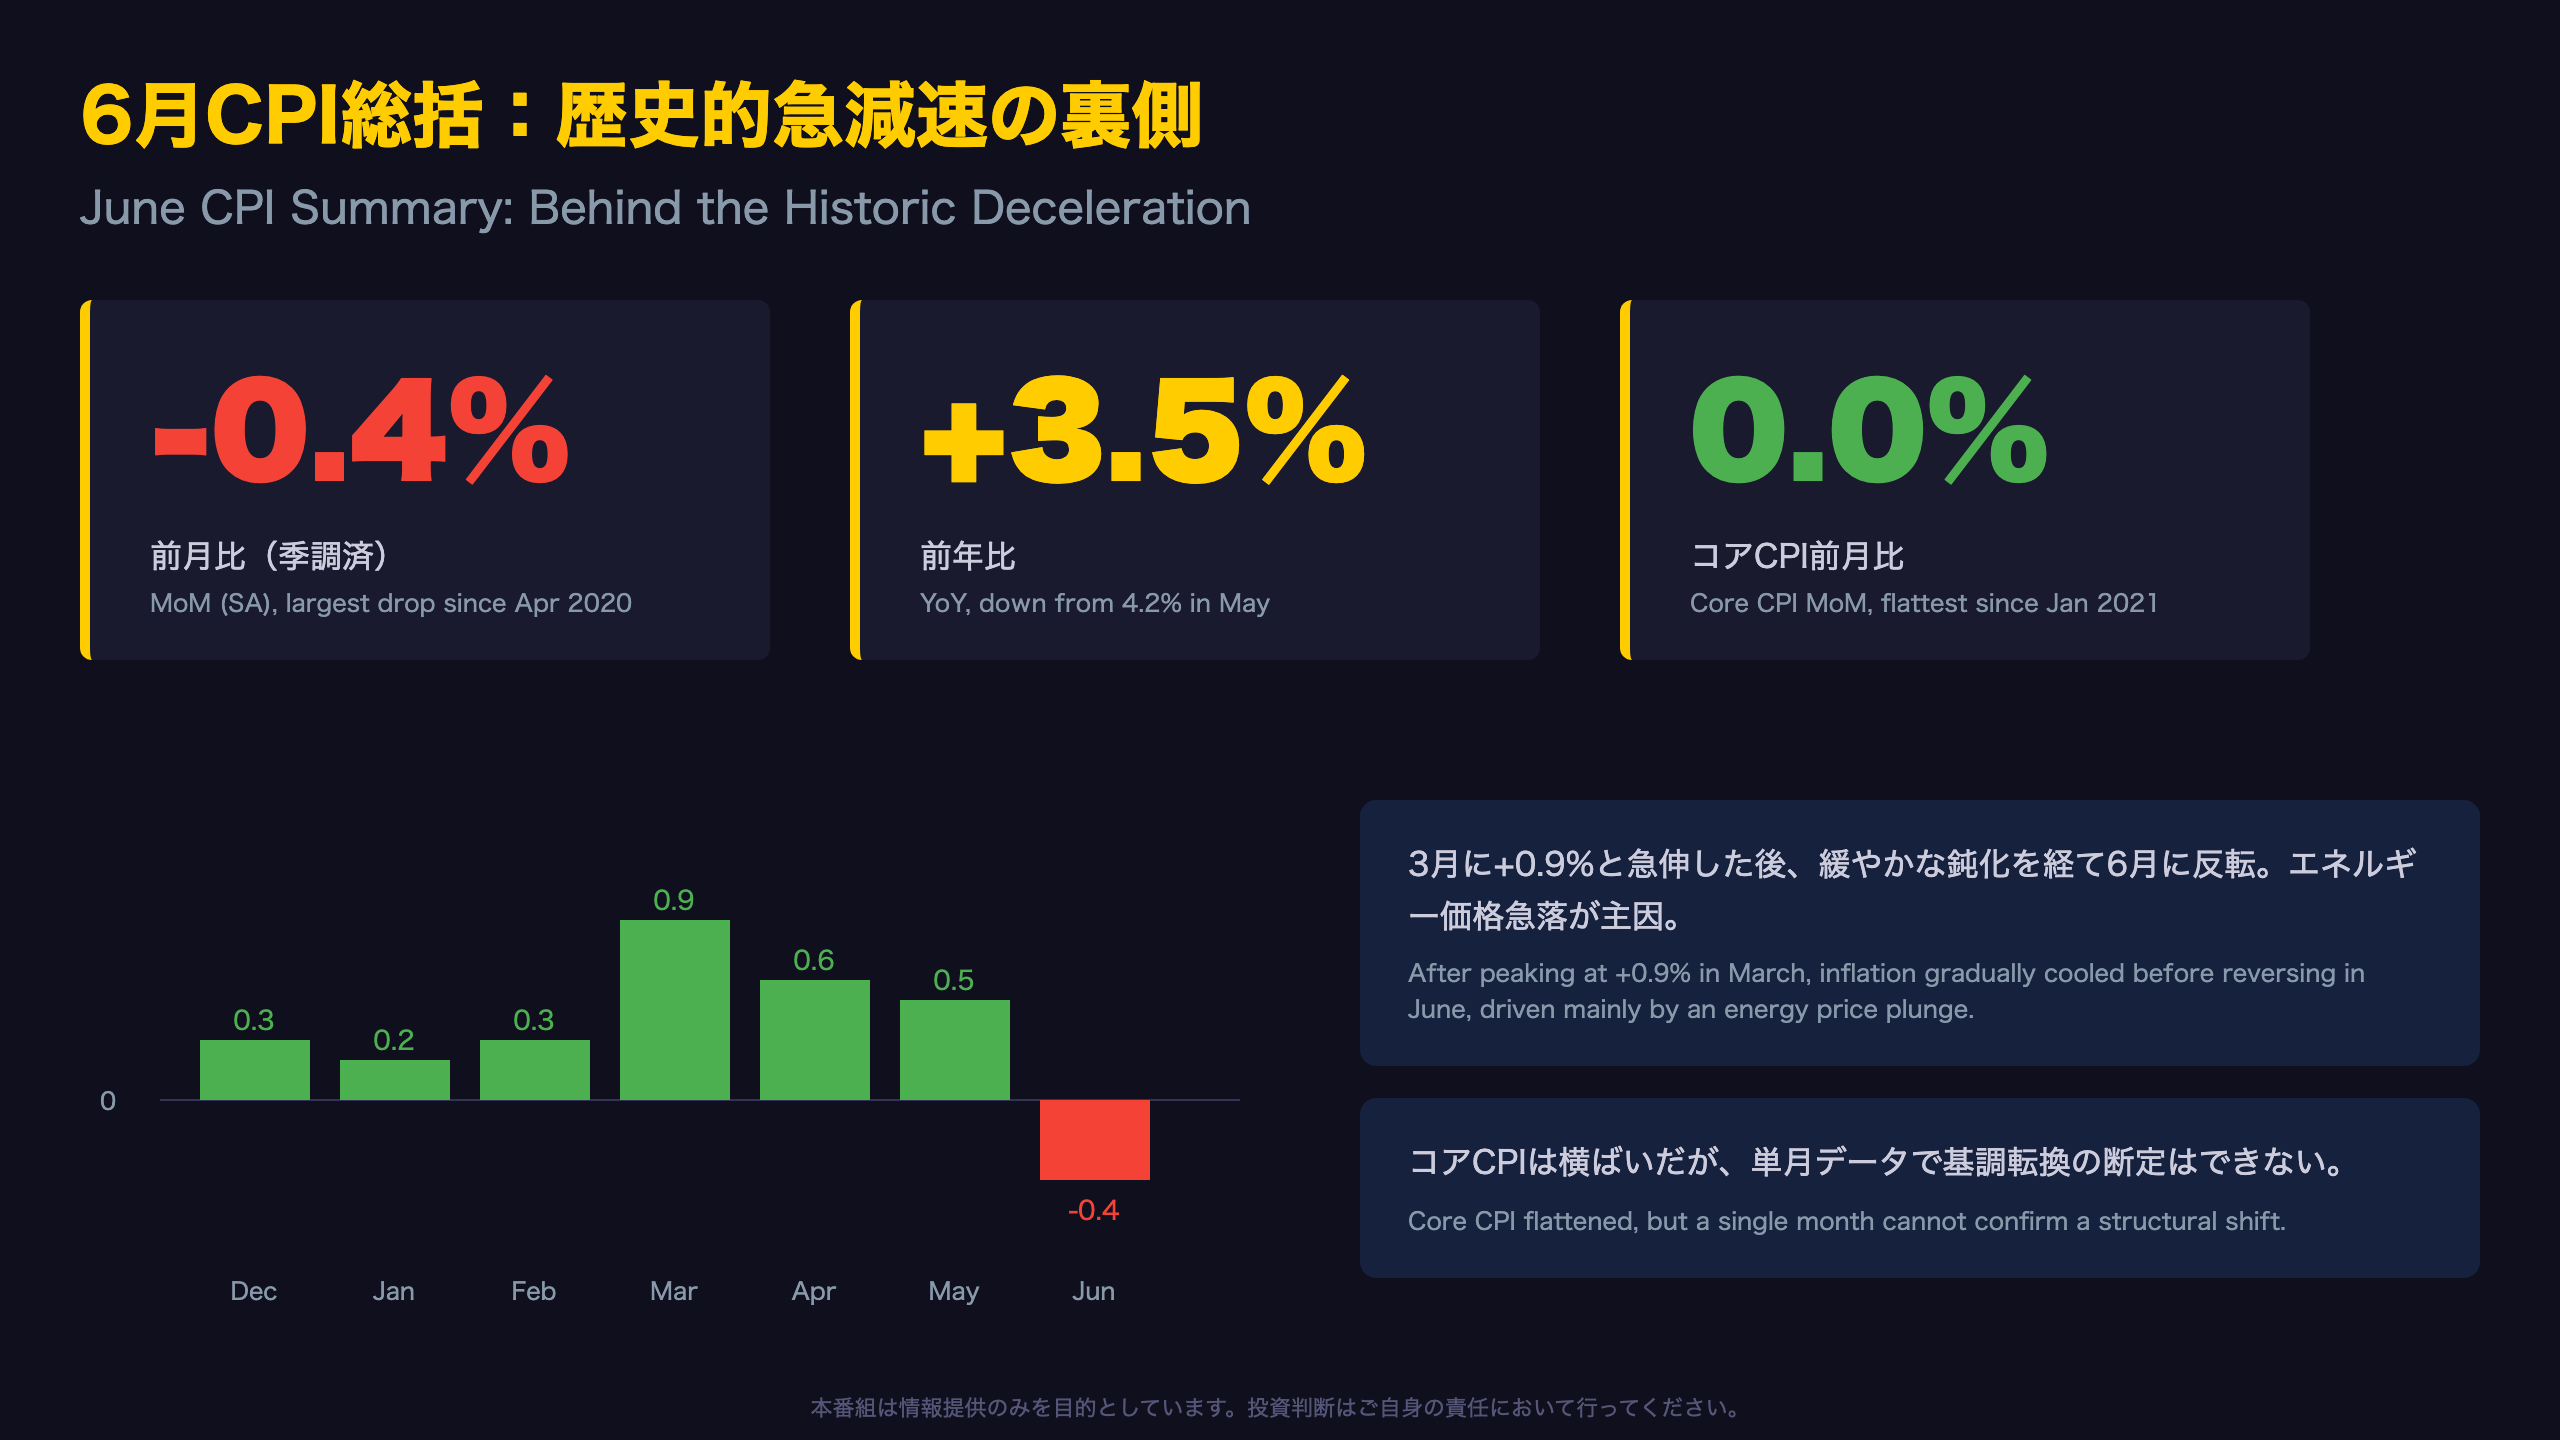
On July 14, 2026, the U.S. Bureau of Labor Statistics (BLS) reported that the seasonally adjusted Consumer Price Index for All Urban Consumers (CPI-U) fell 0.4% month-over-month in June — the largest monthly decline since April 2020, when the index fell 0.8%.
Historical Context
Looking at the trailing six months of month-over-month changes reveals a clear “hump” pattern:
| Month | MoM (SA) |
|---|---|
| Dec 2025 | +0.3% |
| Jan 2026 | +0.2% |
| Feb 2026 | +0.3% |
| Mar 2026 | +0.9% |
| Apr 2026 | +0.6% |
| May 2026 | +0.5% |
| Jun 2026 | -0.4% |
After peaking at +0.9% in March, inflation gradually decelerated before reversing outright in June.
Direct Quote from the Release
BLS stated: “The index for energy fell 5.7 percent in June…more than offsetting increases in other indexes including those for shelter and food.” This indicates that shelter and food costs continued rising, but the energy decline masked those gains at the headline level.
Alternative Interpretations
Optimists might argue the flattening of core CPI to 0.0% reflects genuine underlying disinflation. Skeptics would counter that this is largely an energy-driven, one-off event, and core inflation could reaccelerate once energy effects fade.
Looking Ahead
The next CPI release (July data) is scheduled for August 12, 2026. Whether core CPI rebounds toward its prior ~0.2% pace or continues hovering near zero will be a critical signal for the disinflation narrative going forward. For international readers: the CPI is the U.S. equivalent of Japan’s national CPI published by the Ministry of Internal Affairs and Communications, and is the primary inflation gauge the Federal Reserve monitors alongside the PCE price index.
エネルギー急落の深掘り:3ヶ月続いた高騰の反動
The Energy Price Rollercoaster
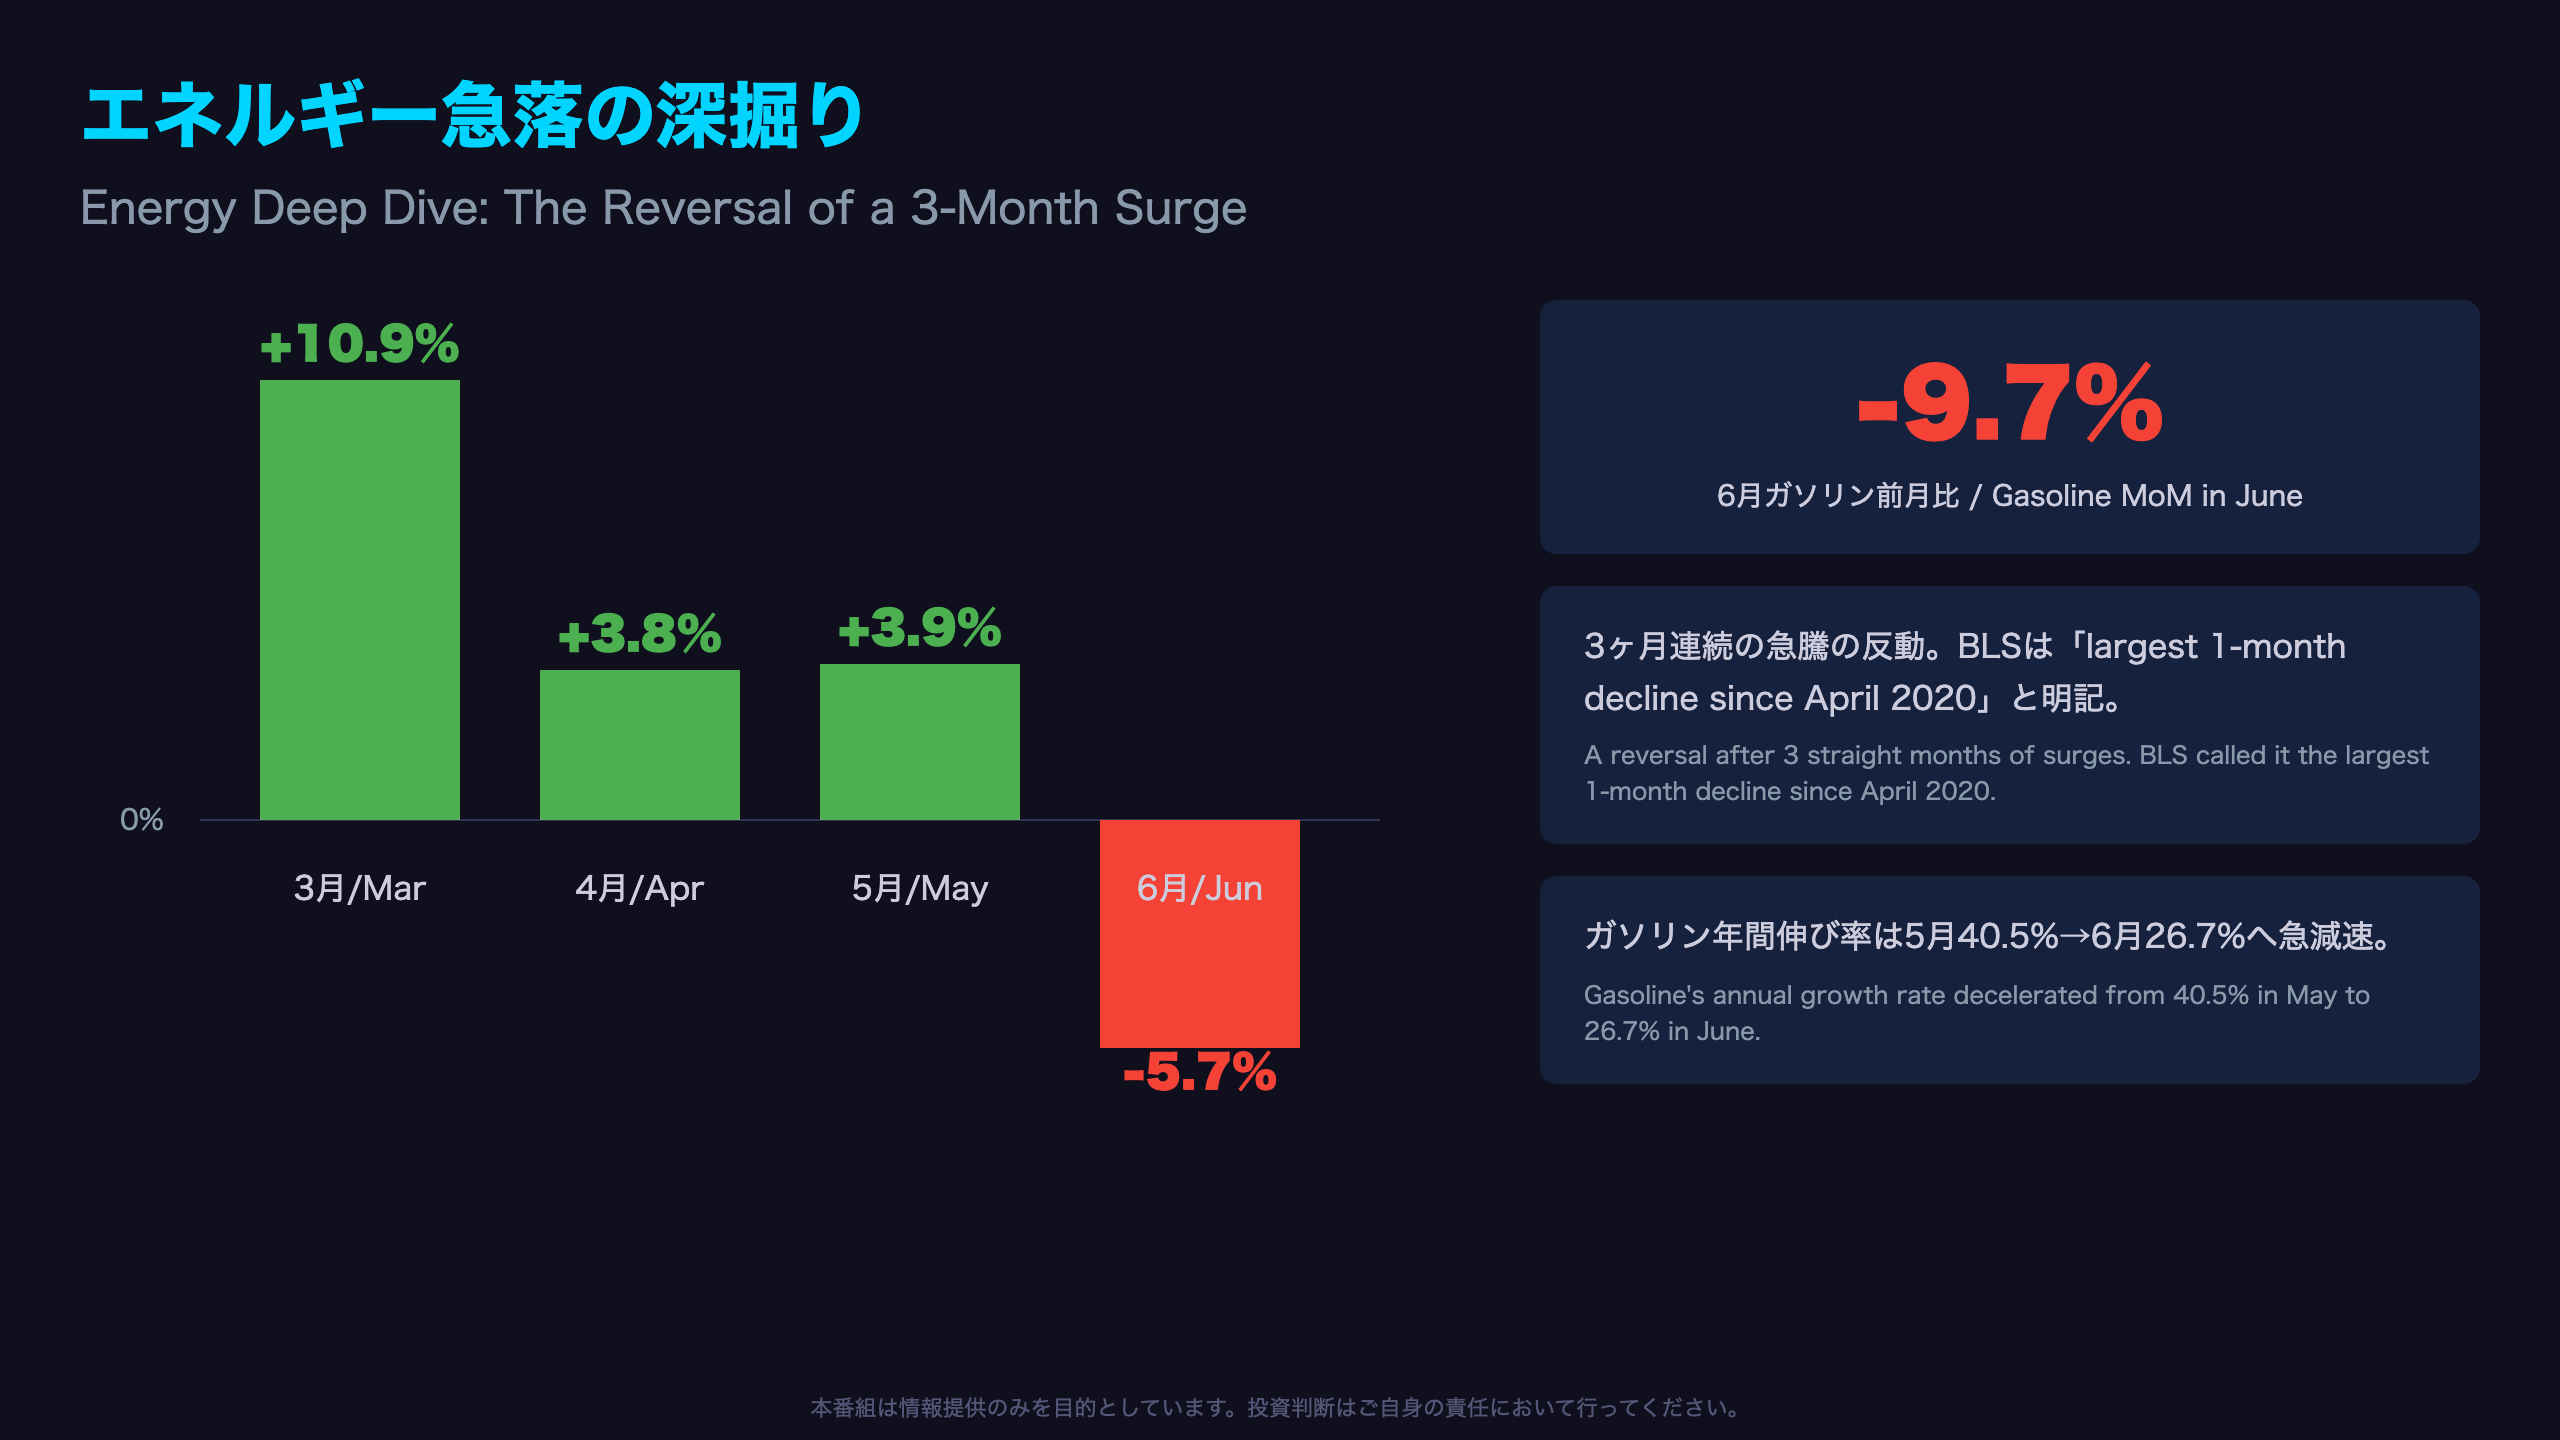
The most striking feature of the June CPI report is the extreme volatility in the energy index. Looking at the trailing four months of seasonally adjusted month-over-month changes:
| Month | Energy MoM | Gasoline MoM |
|---|---|---|
| Mar | +10.9% | +21.2% |
| Apr | +3.8% | +5.4% |
| May | +3.9% | +7.0% |
| Jun | -5.7% | -9.7% |
March’s +10.9% reading was itself likely one of the largest monthly increases in recent memory, meaning energy prices essentially spiked and then collapsed within a four-month window.
Year-over-Year Deceleration Speed
On an annual basis, energy inflation cooled from +23.5% in May to +15.7% in June—nearly an 8-point drop. Gasoline alone decelerated from +40.5% in May to +26.7% in June, a nearly 14-point swing in a single month. The BLS release explicitly attributed the annual energy gain “in large part to the index for gasoline rising 26.7 percent over the same period.”
Direct Quote
The release states: “The index for energy decreased 5.7 percent in June, the largest 1-month decline since April 2020.” This confirms that nearly the entire headline CPI decline can be traced to this single category.
Alternative Readings
Bulls might view this volatility resolution as a sign that energy markets are normalizing after a temporary shock. Skeptics would note this is simply the unwinding of March’s spike (possibly tied to tariff or supply factors), and further swings could reappear in coming months.
What to Watch Next
For U.S. readers unfamiliar with the mechanics: unlike Japan, where energy costs are more heavily influenced by imported LNG and regulated utility pricing, U.S. gasoline prices are directly tied to global crude benchmarks like WTI, making the CPI energy component considerably more volatile month-to-month. Whether July’s energy reading stabilizes or swings again will determine if June’s plunge reflects true normalization or just another data point in an unusually choppy stretch.
コアCPIゼロ%の意味:住居費・サービスの粘着性喪失
What Core CPI’s Zero Reading Tells Us About “Stickiness”
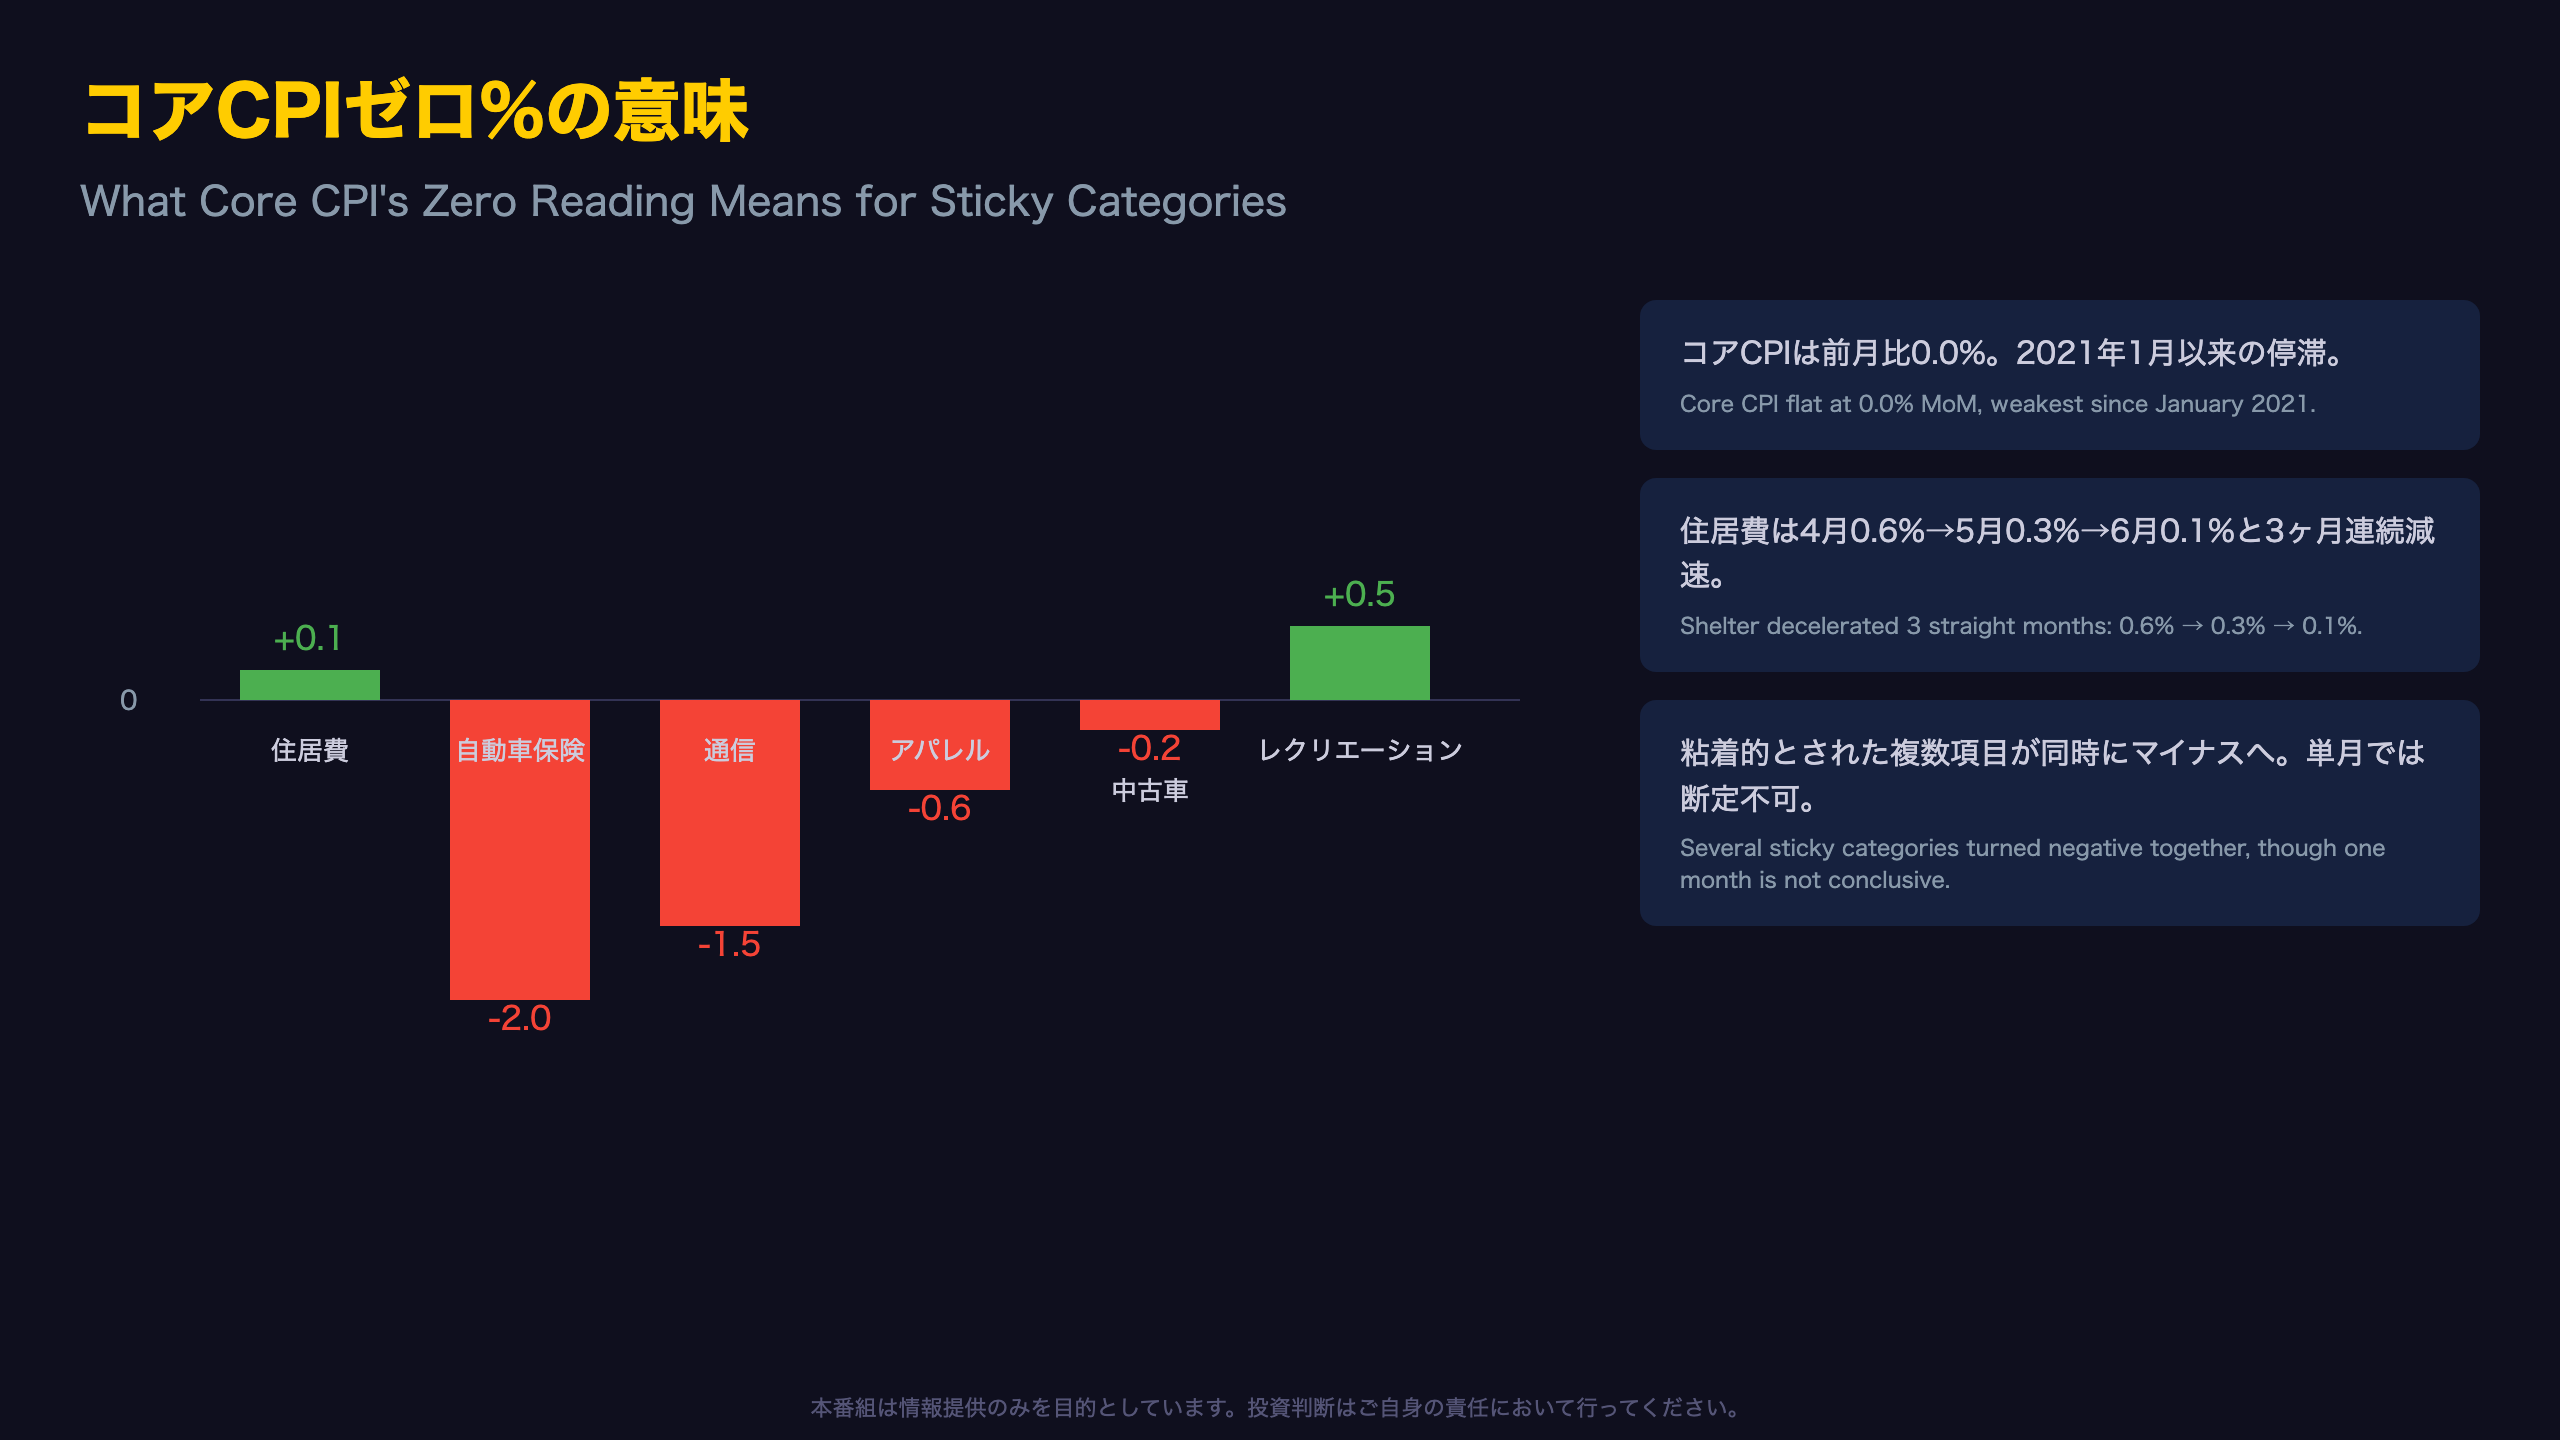
The most structurally significant finding in this report is that core CPI (excluding food and energy) was flat at 0.0% month-over-month. BLS used identical language for the shelter index, describing it as “the smallest 1-month change reported for that index since January 2021.”
Key Core Components, June MoM Change
| Category | MoM |
|---|---|
| Shelter | +0.1% |
| Motor vehicle insurance | -2.0% |
| Communication | -1.5% |
| Apparel | -0.6% |
| Used cars and trucks | -0.2% |
| Medical care | -0.1% |
| Recreation | +0.5% |
| Household furnishings | +0.2% |
The shelter deceleration is particularly notable. It rose 0.6% in April, 0.3% in May, and just 0.1% in June—three consecutive months of slowing. Since shelter carries over 35% weight in the overall CPI basket, this deceleration alone has a substantial dampening effect on core inflation.
Direct Quote
BLS stated: “The shelter index increased 0.1 percent over the month, the smallest 1-month change reported for that index since January 2021.” This is recorded as a clear trend rather than statistical noise.
Alternative Interpretations
Optimists would argue that shelter—long considered the stickiest component of U.S. inflation—finally decelerating signals that disinflation is taking hold in earnest. Skeptics would counter that a sharp move like auto insurance’s -2.0% could reflect one-off repricing cycles rather than a durable trend, making it premature to draw conclusions from a single month.
Context for International Readers
Shelter in the U.S. CPI includes both “Rent of primary residence” and “Owners’ equivalent rent” (OER)—a modeled estimate of what homeowners would pay to rent their own homes. This differs from Japan’s CPI, where owner-occupied housing costs are also imputed but weighted differently, and from the Eurozone’s HICP, which excludes owner-occupied housing entirely. Whether shelter continues at this ~0.1-0.2% pace or rebounds in July will be the single most important data point for judging the true trajectory of U.S. core inflation.
3ヶ月推移の時系列分析:山型パターンの正体
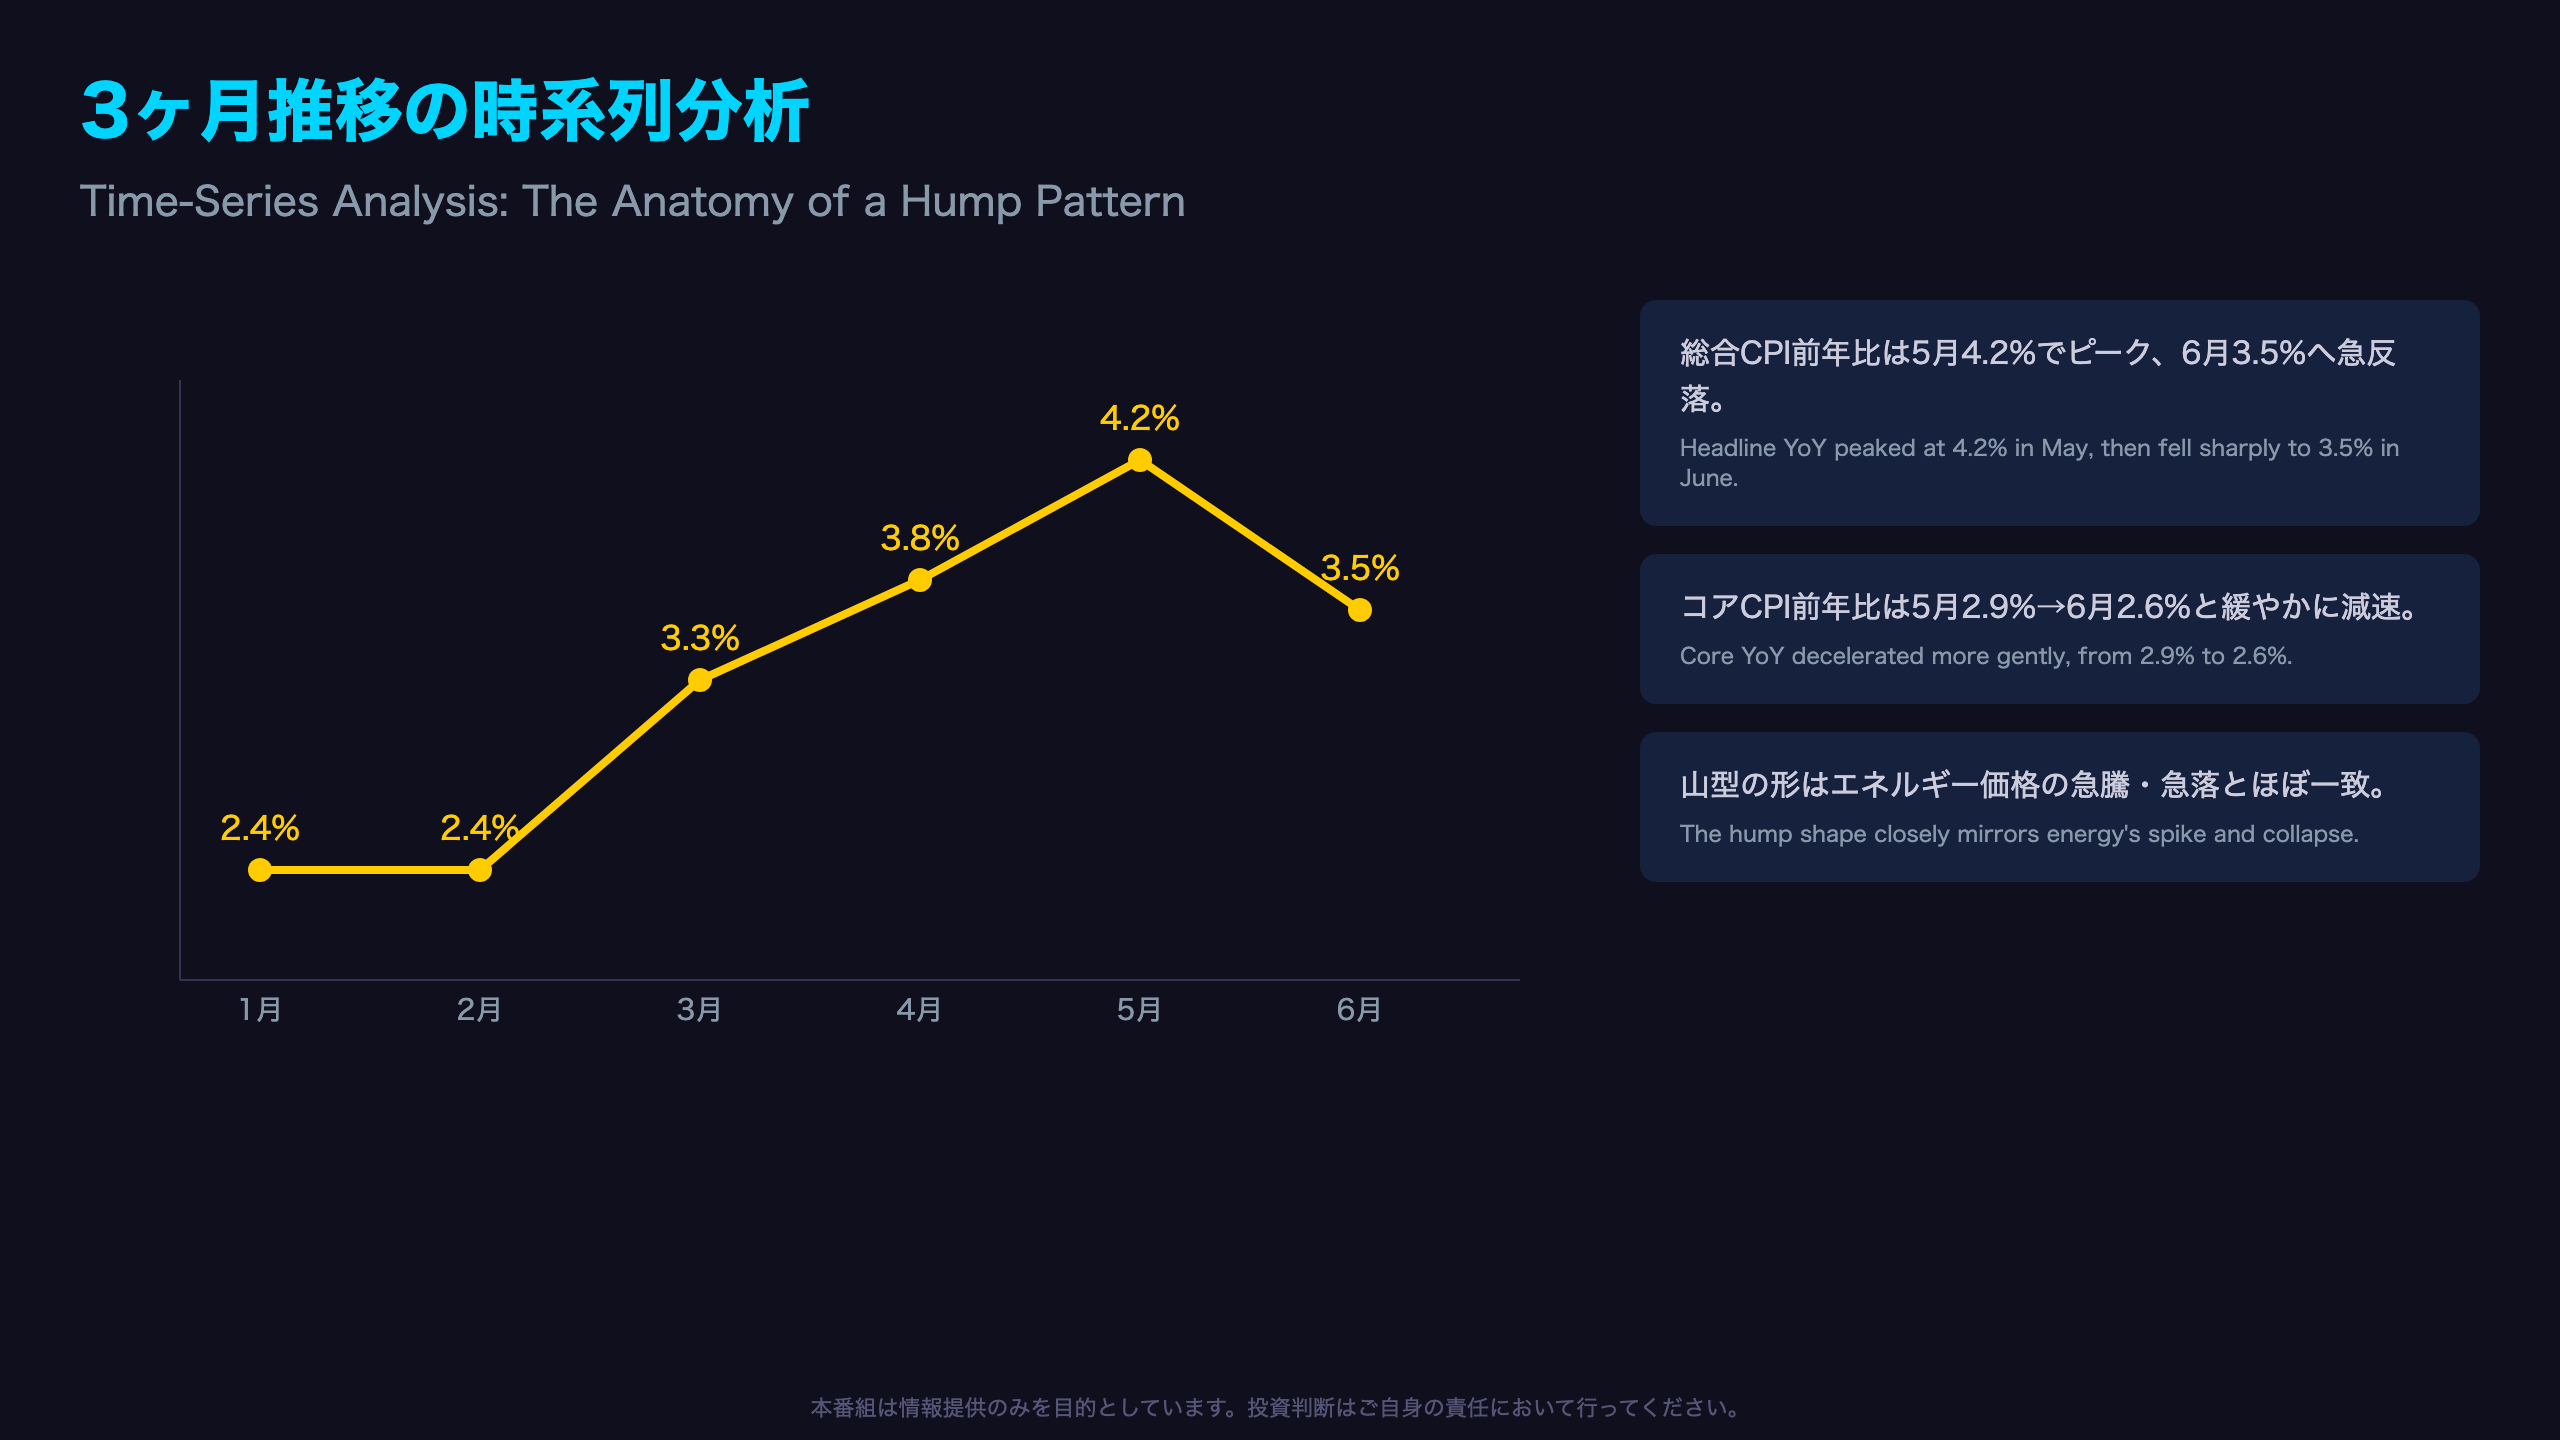
Reading the Headline-Core Divergence Over Time
Laying out six months of year-over-year data reveals a clear divergence between headline and core CPI trajectories.
Year-over-Year Trend
| Month | Headline CPI (YoY) | Core CPI (YoY) |
|---|---|---|
| Jan | 2.4% | – |
| Feb | 2.4% | – |
| Mar | 3.3% | – |
| Apr | 3.8% | not explicitly stated |
| May | 4.2% | 2.9% |
| Jun | 3.5% | 2.6% |
Note: Core CPI monthly YoY figures are drawn from the May and June releases; April’s core YoY was not explicitly stated in the source text.
Headline CPI jumped from 2.4% in January-February to 3.3% in March, peaked at 4.2% in May, and then reversed sharply to 3.5% in June. This “hump” almost perfectly mirrors the timing of energy’s March spike and June collapse.
Core CPI, by contrast, decelerated more gently—just 0.3 points from 2.9% in May to 2.6% in June, compared to headline’s 0.7-point swing.
Direct Quote
BLS reported: “The all items index rose 3.5 percent for the 12 months ending June after rising 4.2 percent for the 12 months ending May,” and separately: “The all items less food and energy index rose 2.6 percent over the year, following a 2.9-percent increase over the 12 months ending May.”
Alternative Interpretations
One reading is that headline’s wild swings simply reflect energy’s inherent volatility, while the smoother core measure better captures underlying inflationary pressure. An alternative view is that core’s gradual deceleration—driven by shelter’s slowdown—could itself be the beginning of genuine, durable disinflation.
Context and What’s Next
For context, the Federal Reserve’s preferred inflation gauge is actually the PCE price index, not CPI, though CPI heavily informs PCE calculations and remains the most closely watched real-time inflation signal. Whether the July report narrows or widens the headline-core gap will be crucial in determining whether June’s move was noise or the start of a structural trend.
市場・政策へのインプリケーション
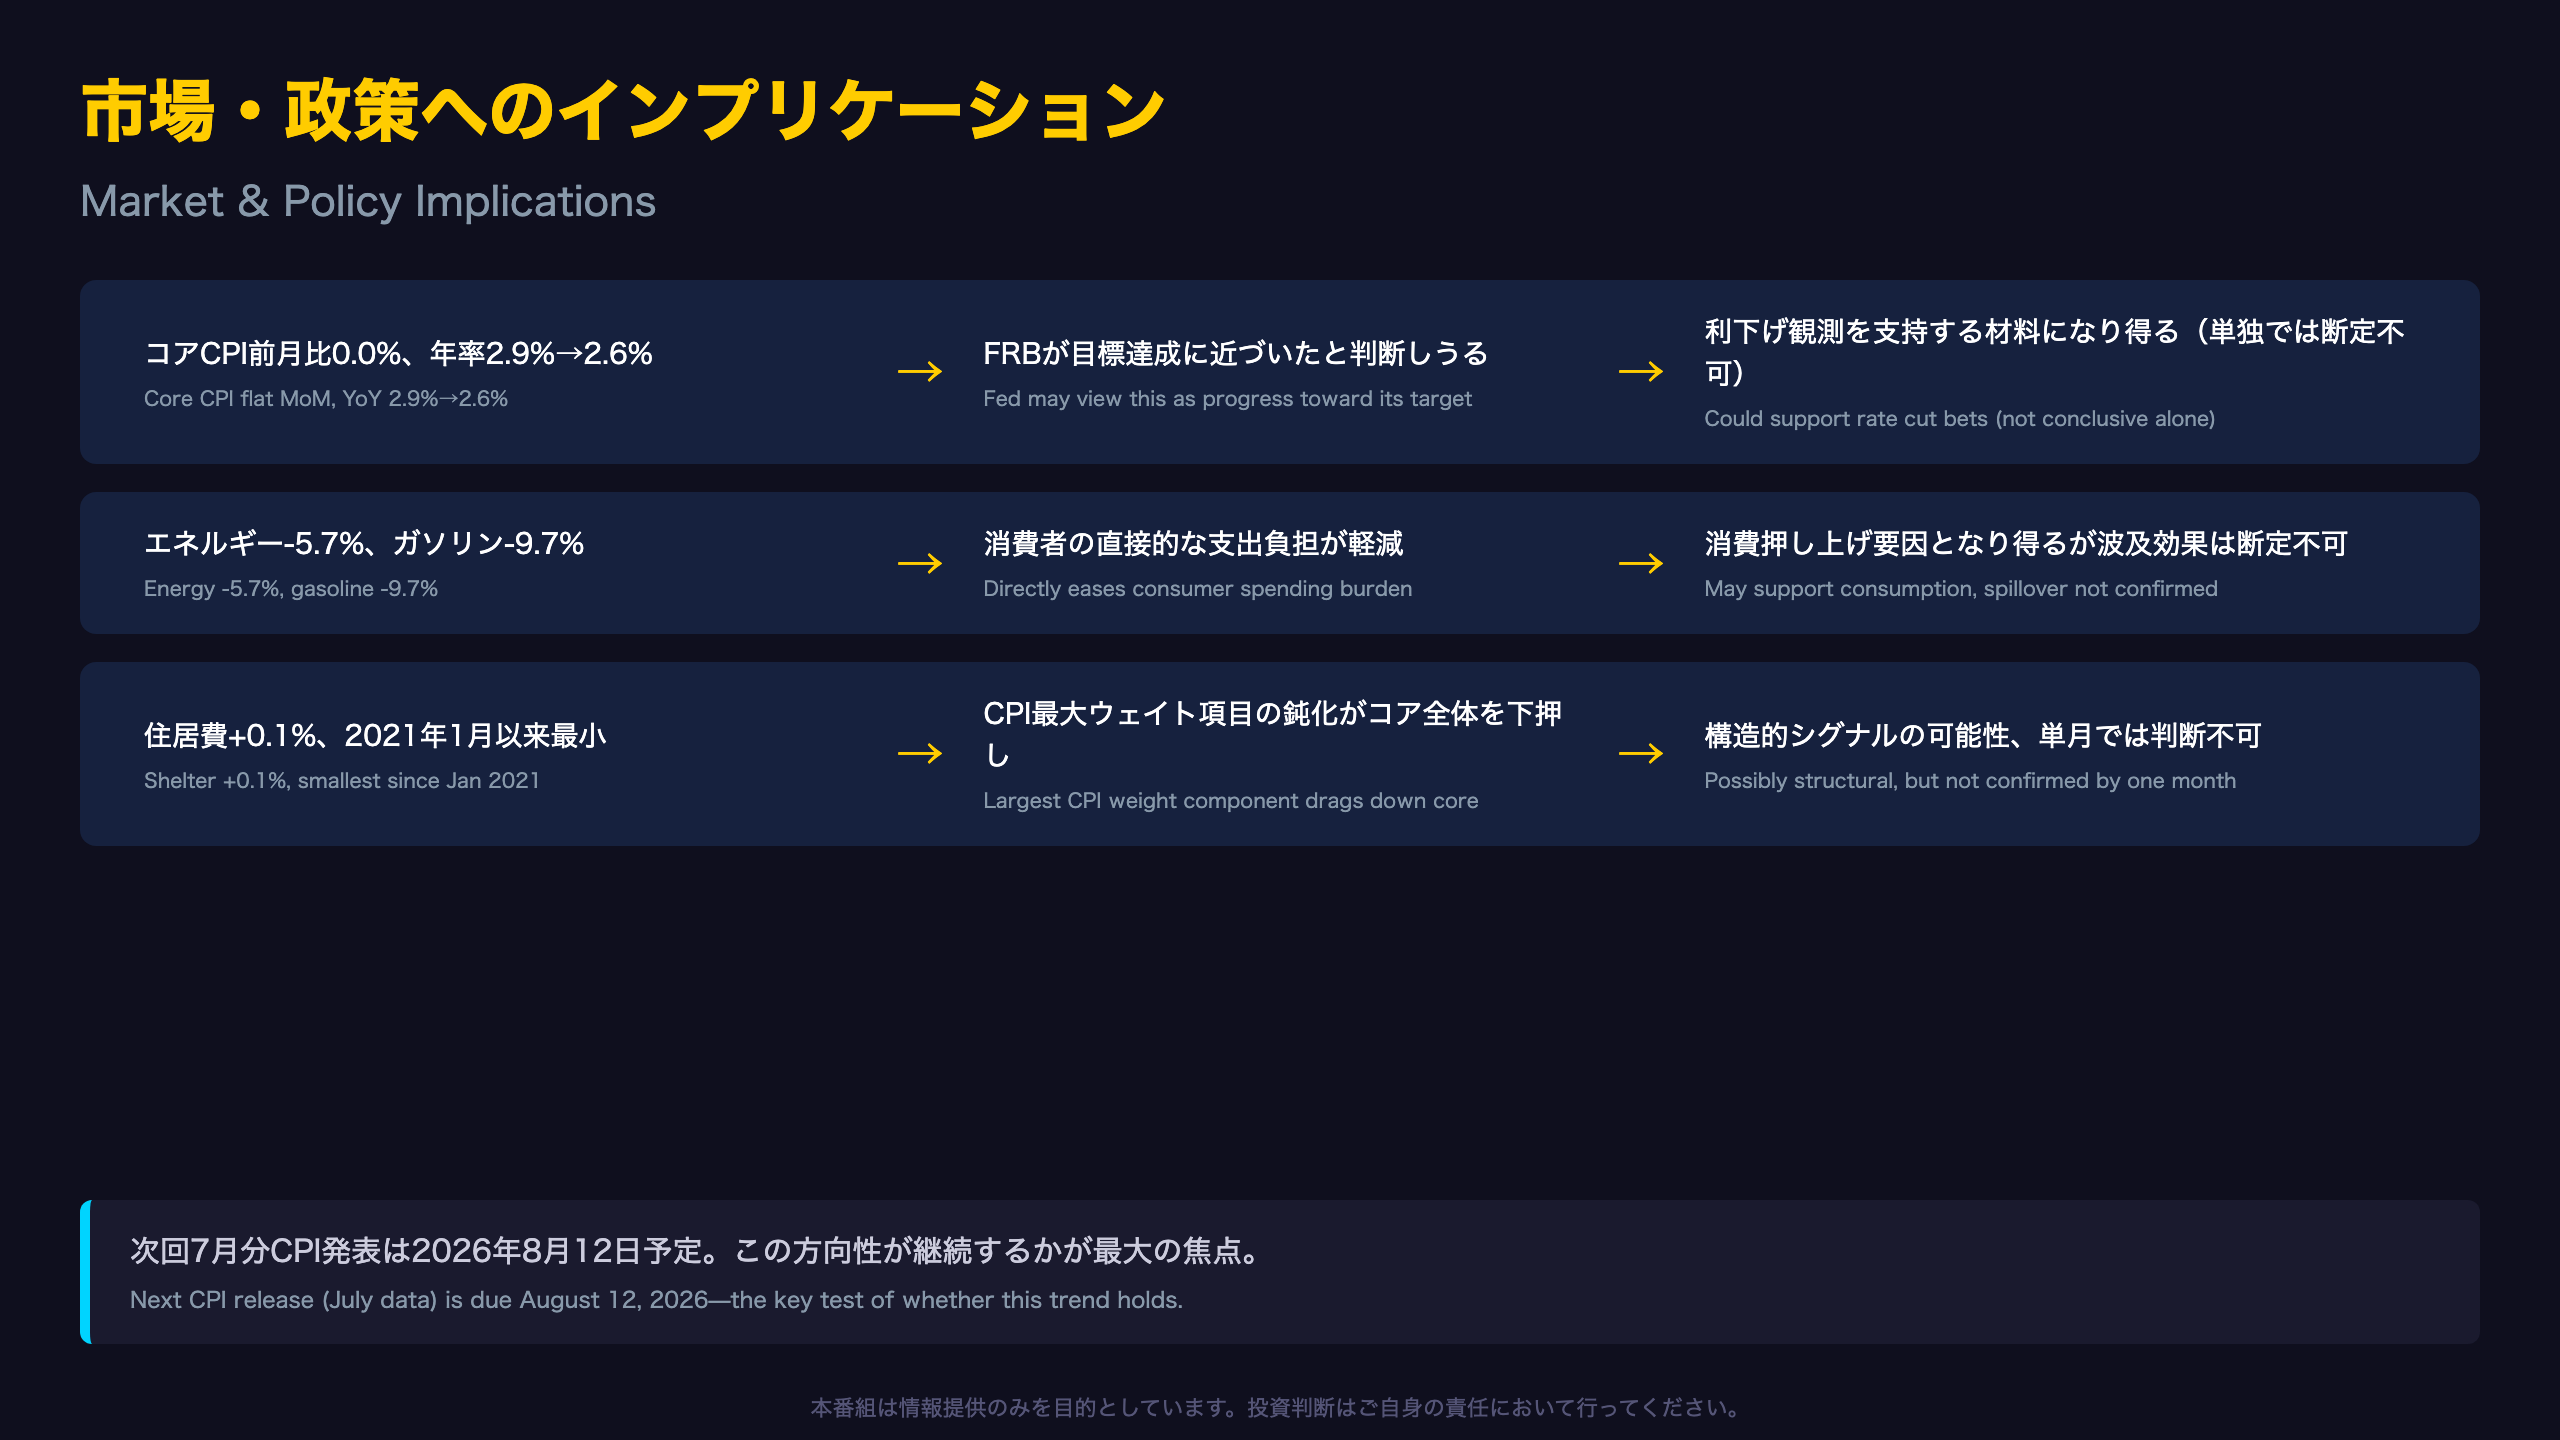
What This Data Implies for Markets
Chain of Reasoning for Market Implications
[Fact from the release] Core CPI was flat at 0.0% MoM in June, with annual core inflation decelerating from 2.9% in May to 2.6% in June → [Economic mechanism] Generally speaking, sustained core disinflation is viewed by the Fed as progress toward its price stability mandate, reducing the perceived need for continued monetary tightening → [Market implication] This could support Fed rate cut expectations, though this single data point alone cannot be conclusive.
[Fact from the release] Energy fell 5.7% MoM, with gasoline down 9.7% → [Economic mechanism] A sharp energy price decline directly reduces household spending burdens at the pump and on utility bills → [Market implication] This is generally thought to be supportive of consumer spending, though the standalone data cannot confirm the actual spillover effect on consumption.
[Fact from the release] Shelter rose just 0.1% MoM, the smallest change since January 2021 → [Economic mechanism] Shelter carries over 35% weight in the CPI basket, the largest single component, so its deceleration meaningfully drags down the core index → [Market implication] Sustained shelter deceleration is generally seen as a structural disinflation signal, though this single month’s data cannot determine whether it is a temporary blip or a durable trend.
Summary
This CPI report sends two distinct signals simultaneously: a dramatic headline decline that is likely mostly energy-driven noise, and a gentler but steadier core deceleration that may carry more weight for Fed policy deliberations. For readers accustomed to the Bank of Japan’s inflation framework, it’s worth noting that the Fed operates under a dual mandate (price stability and maximum employment), unlike the BOJ’s single price-stability target, meaning labor market data released alongside CPI often shapes the Fed’s reaction function just as much as inflation prints themselves. Both interpretations here rest on a single month of data—the July release, due August 12, 2026, will be the critical test of whether this trajectory holds.
Disclaimer Note
This content is provided for informational purposes only and does not constitute investment advice.
Disclaimer: This article is for informational purposes only. All investment decisions are made solely at your own risk.







