📺 Watch the Full Video Analysis
This article was automatically generated by the NFC Market Live AI analysis system. (Updated: 2026-06-30 21:56 JST)
📄 Primary Source
Statistics Canada
https://www150.statcan.gc.ca/n1/daily-quotidien/260630/dq260630a-eng.htm
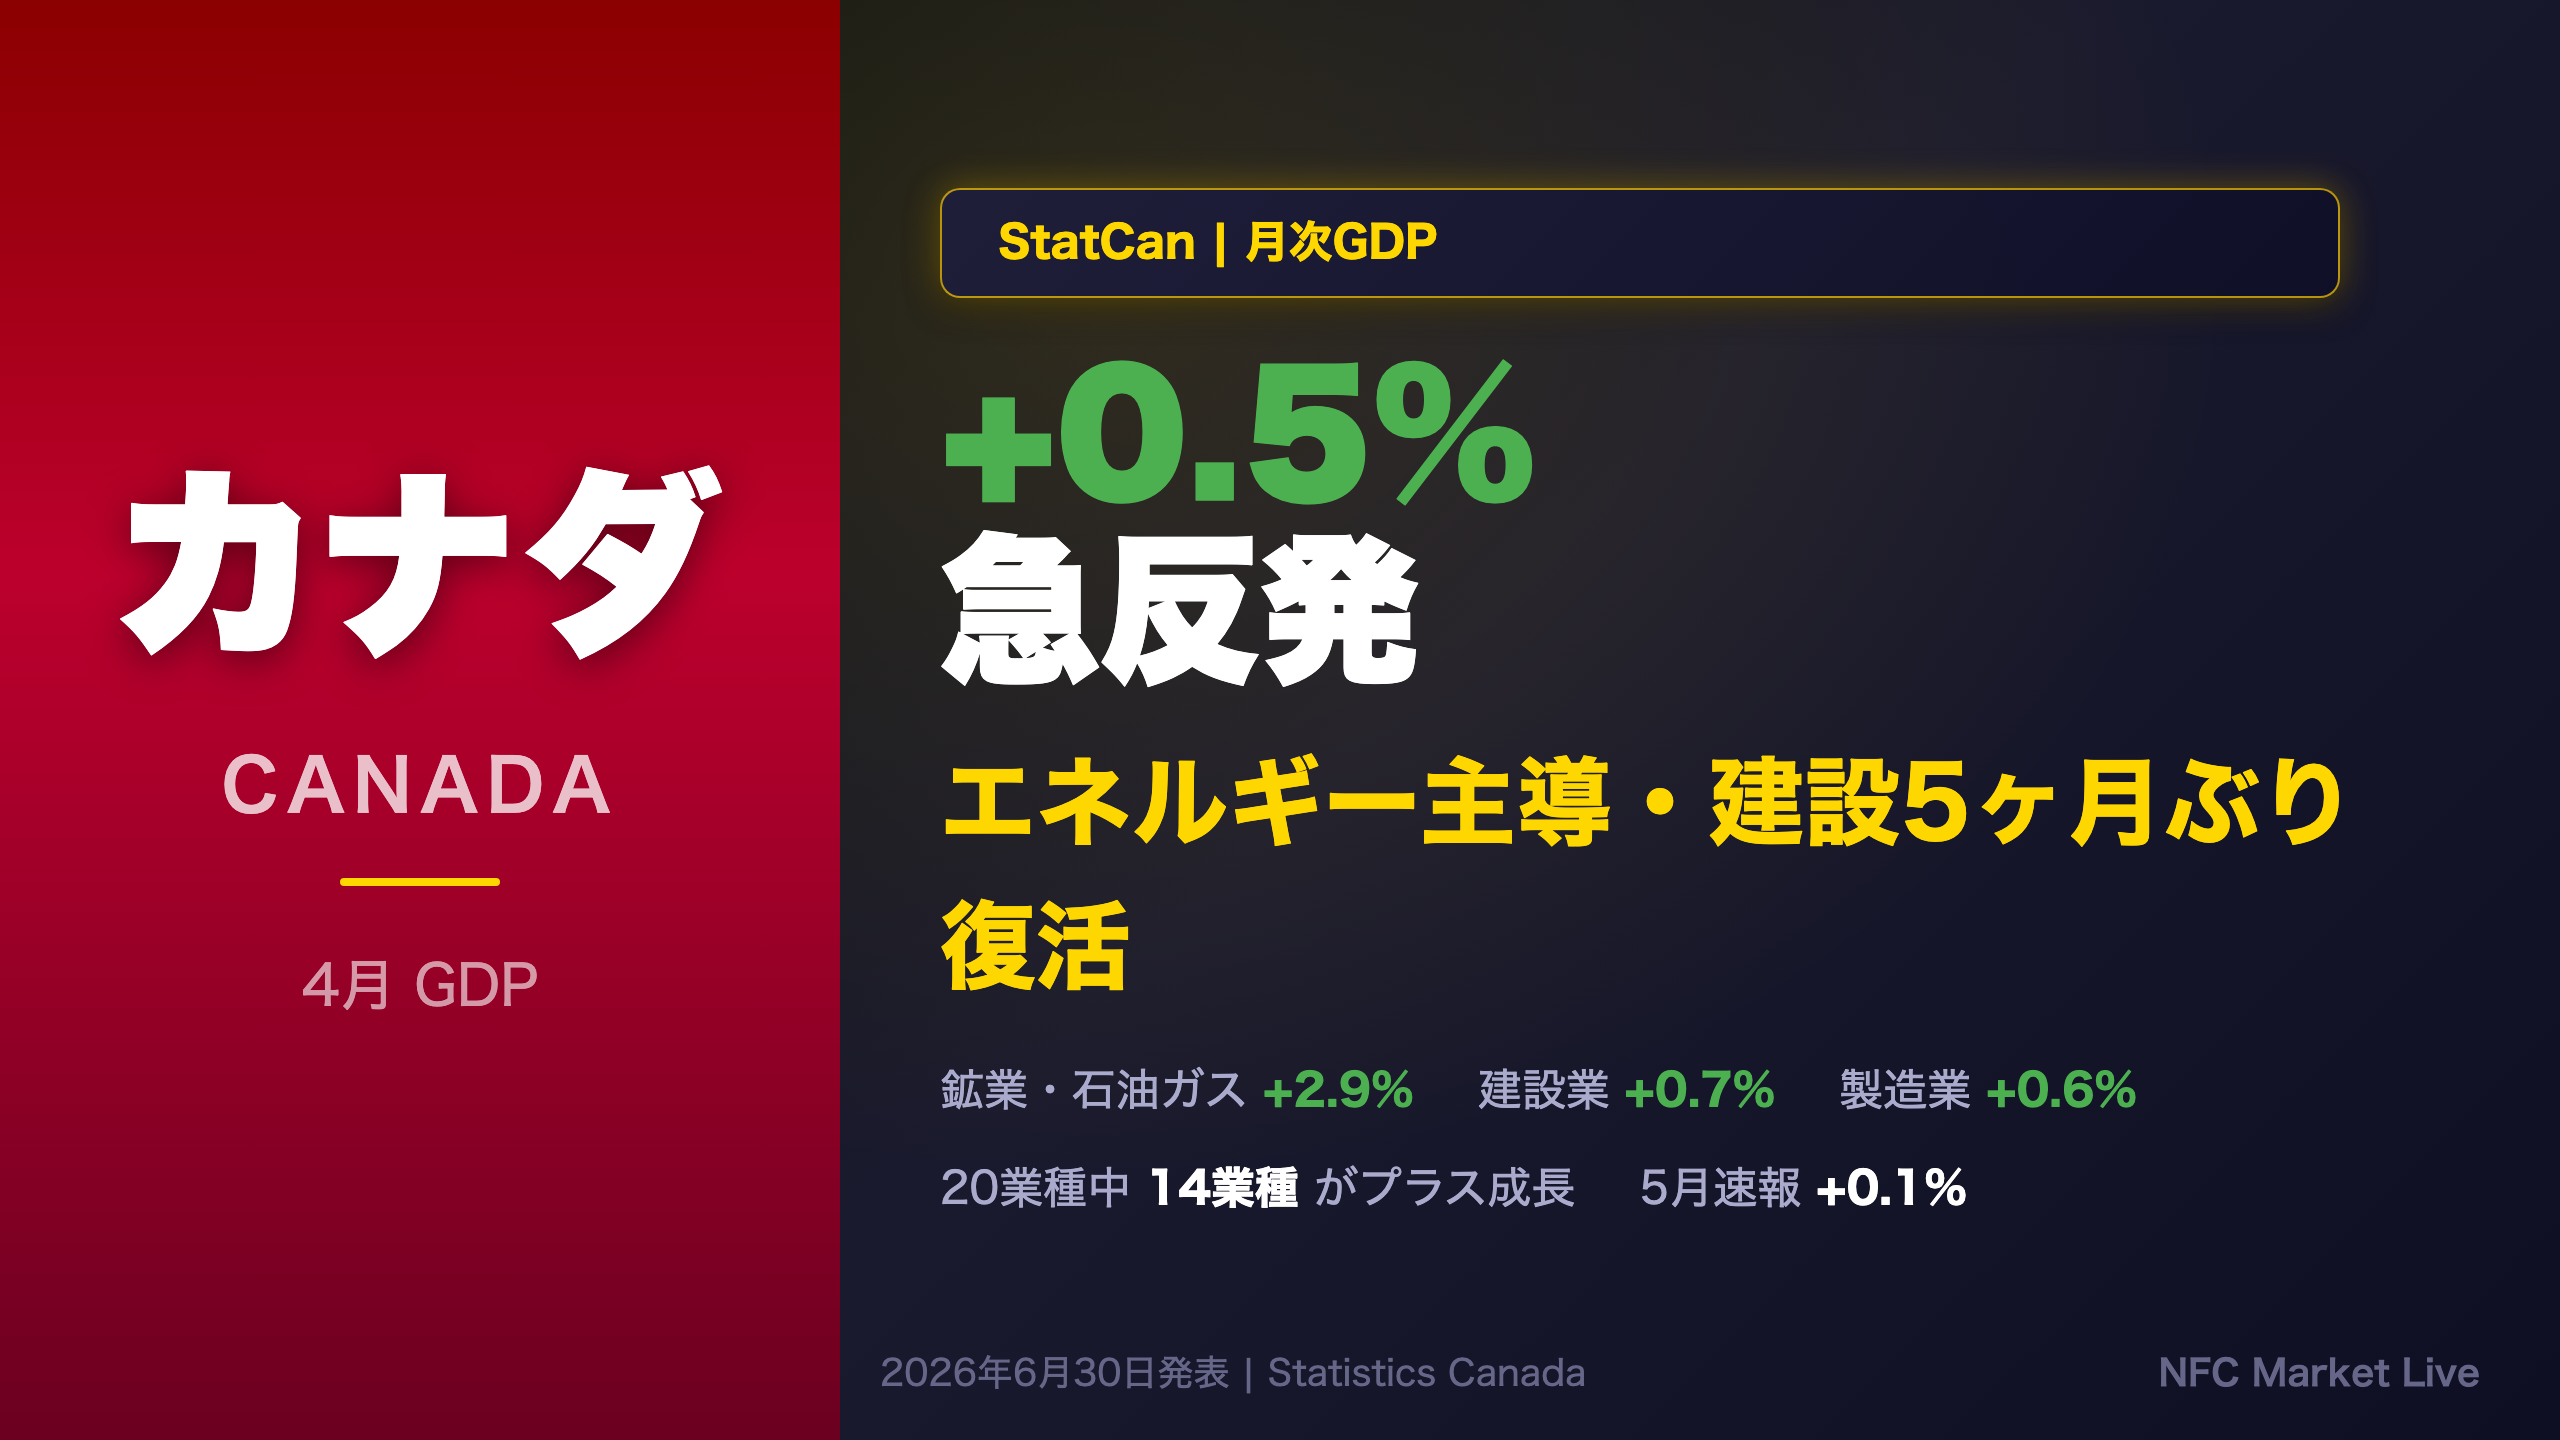
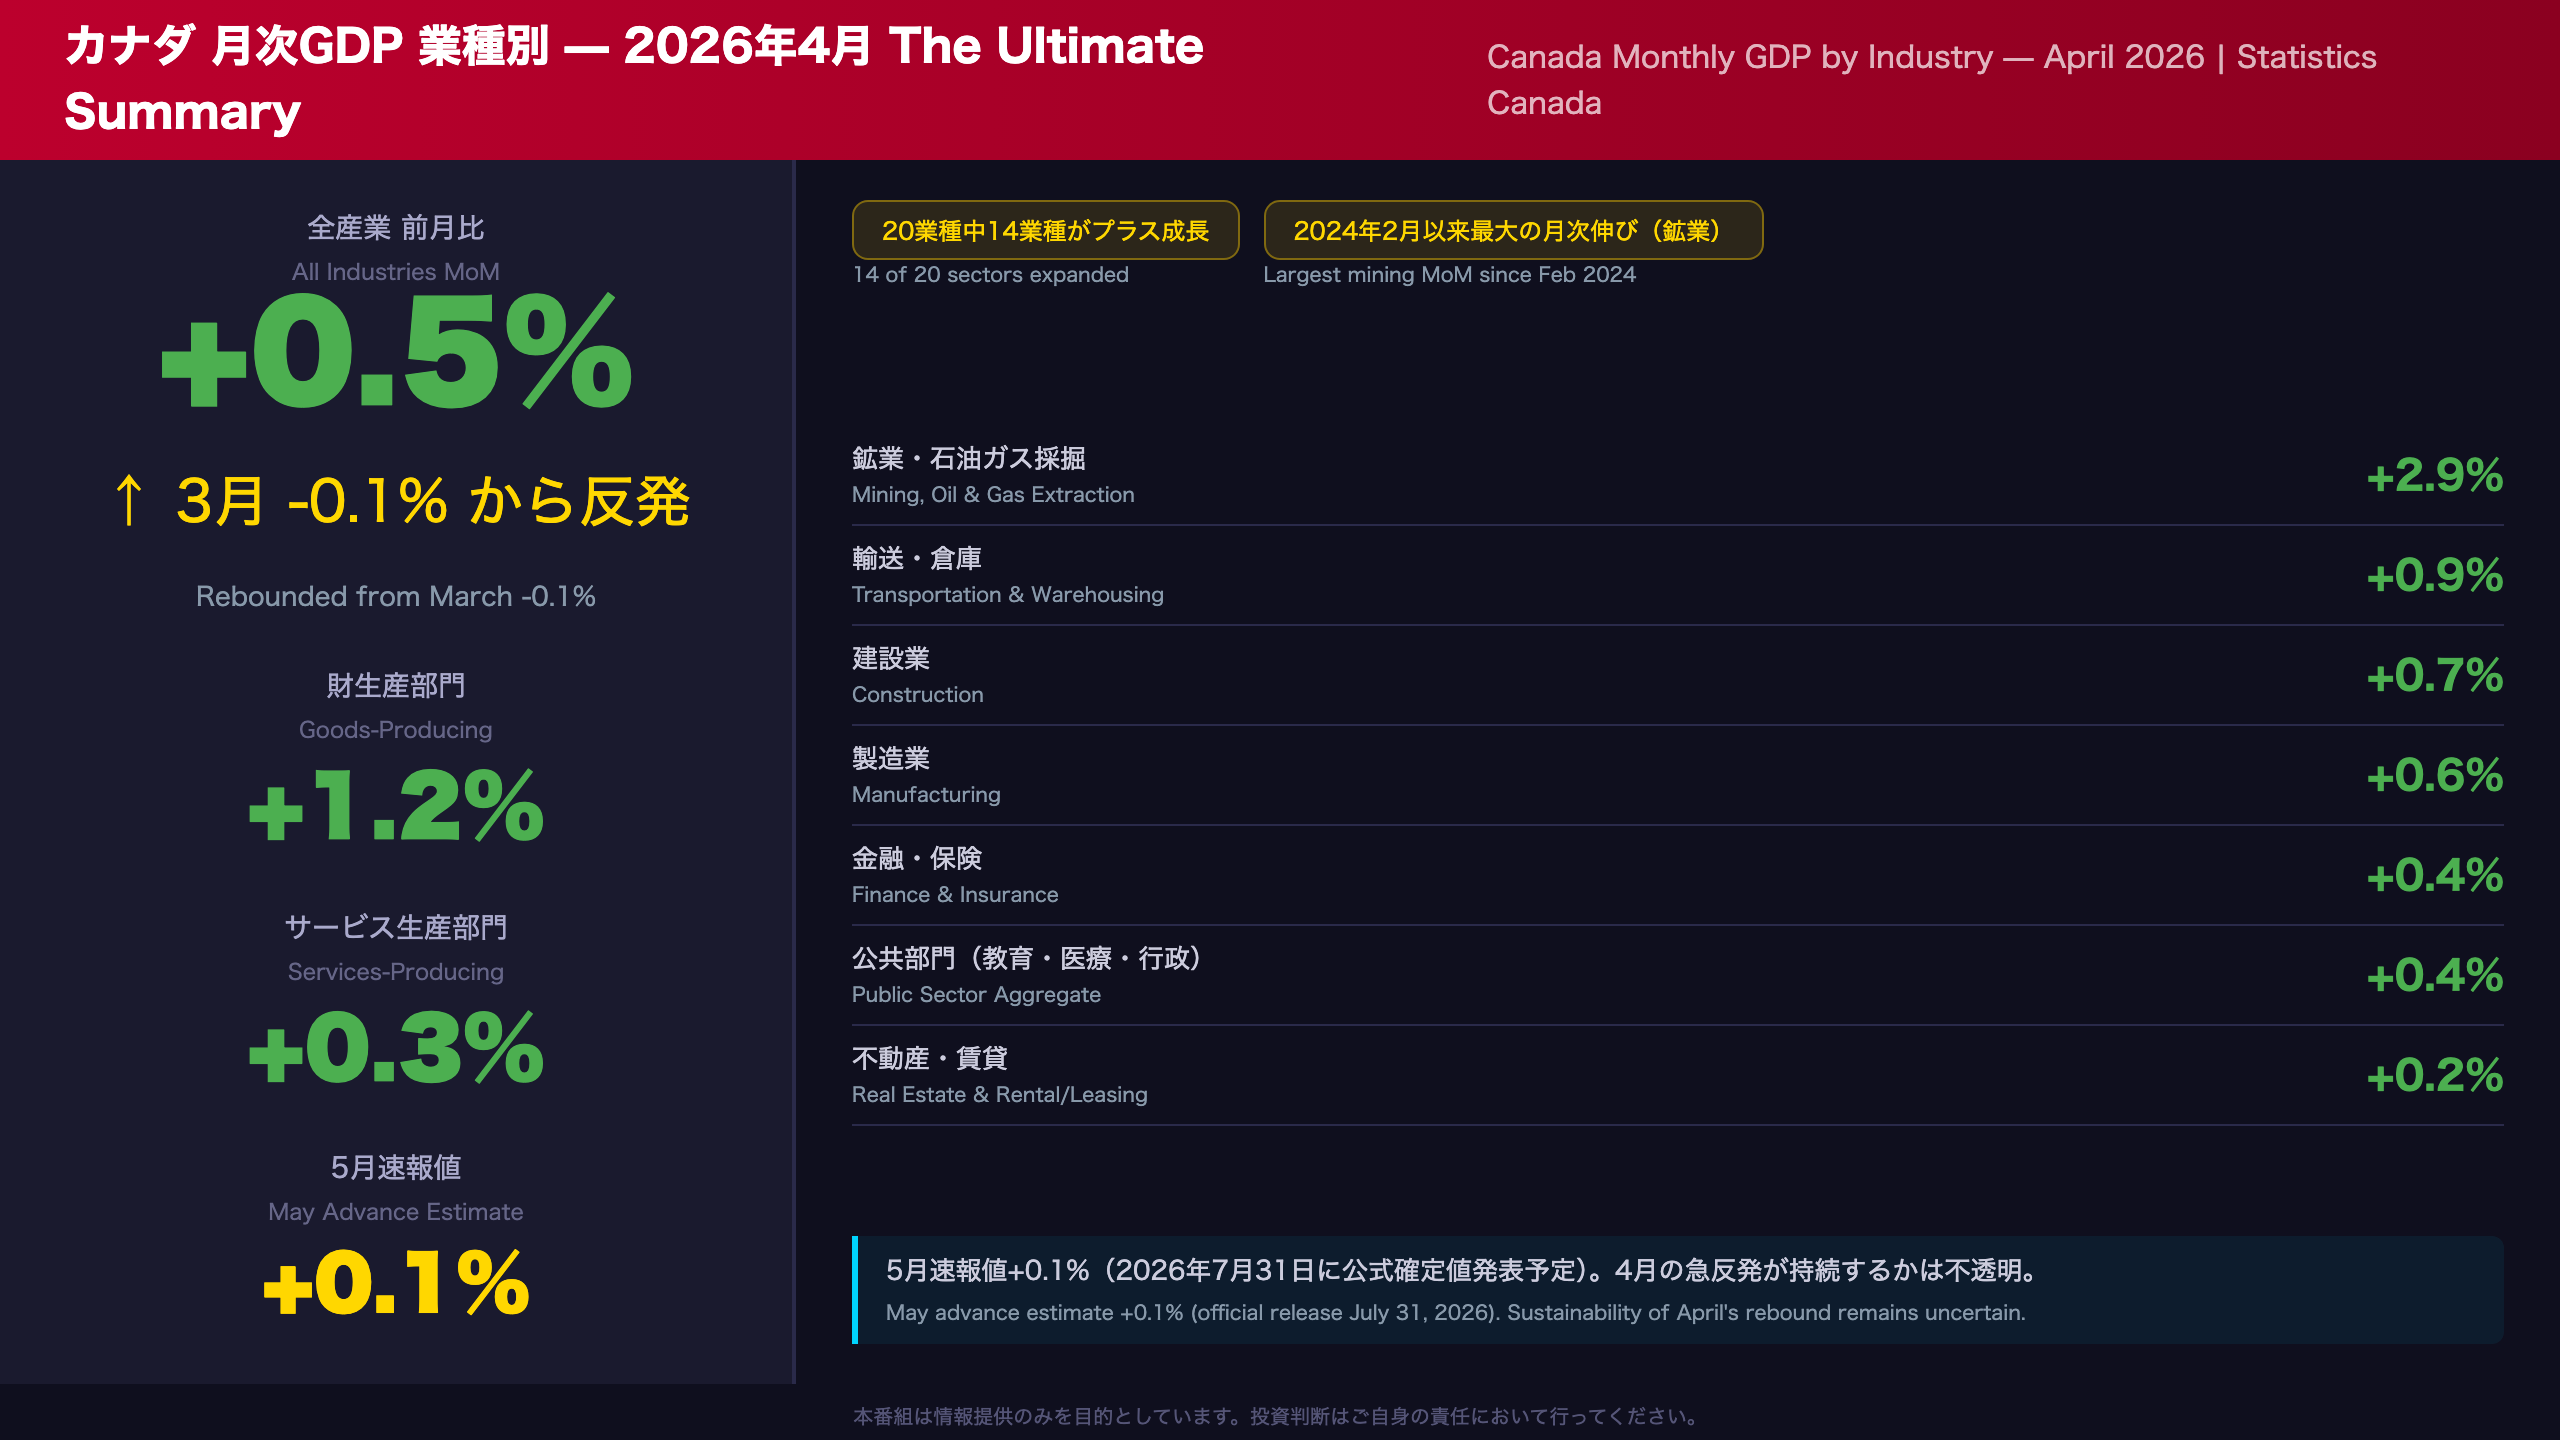
Canada’s real GDP by industry rose 0.5% in April 2026, rebounding sharply from March’s -0.1% contraction. Mining, quarrying & oil/gas extraction surged 2.9% — the largest monthly gain since February 2024. Construction turned positive for the first time in five months (+0.7%). 14 of 20 industrial sectors expanded. May advance estimate: +0.1%. We analyze the sector breakdown, BOC policy implications, and CAD outlook.
The Ultimate Summary:カナダ4月GDP +0.5%、3月マイナスから急反発
Canada April 2026 Monthly GDP: The Full Picture
What Is This Report?
Statistics Canada’s monthly GDP by industry (CANSIM Table 36-10-0434-01) measures real output at basic prices, expressed in chained 2017 dollars and seasonally adjusted. It is the most timely indicator of Canada’s economic activity, released approximately 60 days after the reference month — faster than the quarterly expenditure-based GDP.
Key Headline Numbers
| Indicator | April 2026 | March 2026 |
|---|---|---|
| All Industries MoM | +0.5% | -0.1% |
| Goods-Producing | +1.2% | — |
| Services-Producing | +0.3% | — |
| Sectors with positive growth | 14 of 20 | — |
Breadth of Recovery
The fact that 14 of 20 sectors expanded is a meaningful signal of broad-based recovery, not a narrow, energy-only bounce. Both goods and services sectors contributed positively — a combination that reduces the risk of interpreting April’s rebound as a statistical fluke.
The May Caveat
The advance estimate for May 2026 shows only +0.1% growth. This is a preliminary figure subject to revision on July 31, but it does suggest that April’s energy-driven surge is not carrying forward at the same pace.
Quasi-Quarterly Context
For investors tracking the BOC’s Hidden Markov Model (HMM) inputs, the quasi-quarterly growth rate (approximating FRED series NAEXKP01CAQ657S) for Q2 2026 is off to a positive start: April +0.5% followed by May’s advance of +0.1%. This contrasts with Q1 2026, which was weighed down by energy sector maintenance disruptions and construction weakness.
Bull vs. Bear Interpretation
Bull case: Breadth of 14/20 sectors, simultaneous goods and services recovery, construction ending a four-month losing streak — all point to genuine economic resilience.
Bear case: The headline is heavily influenced by oil sands production rebounding from “longer than anticipated unscheduled maintenance” — a one-off factor. May’s +0.1% advance estimate supports the view that underlying momentum remains modest.
財生産 vs サービス生産:構造的な強弱の対比
Goods vs. Services: Structural Breakdown
Goods-Producing Industries (+1.2%)
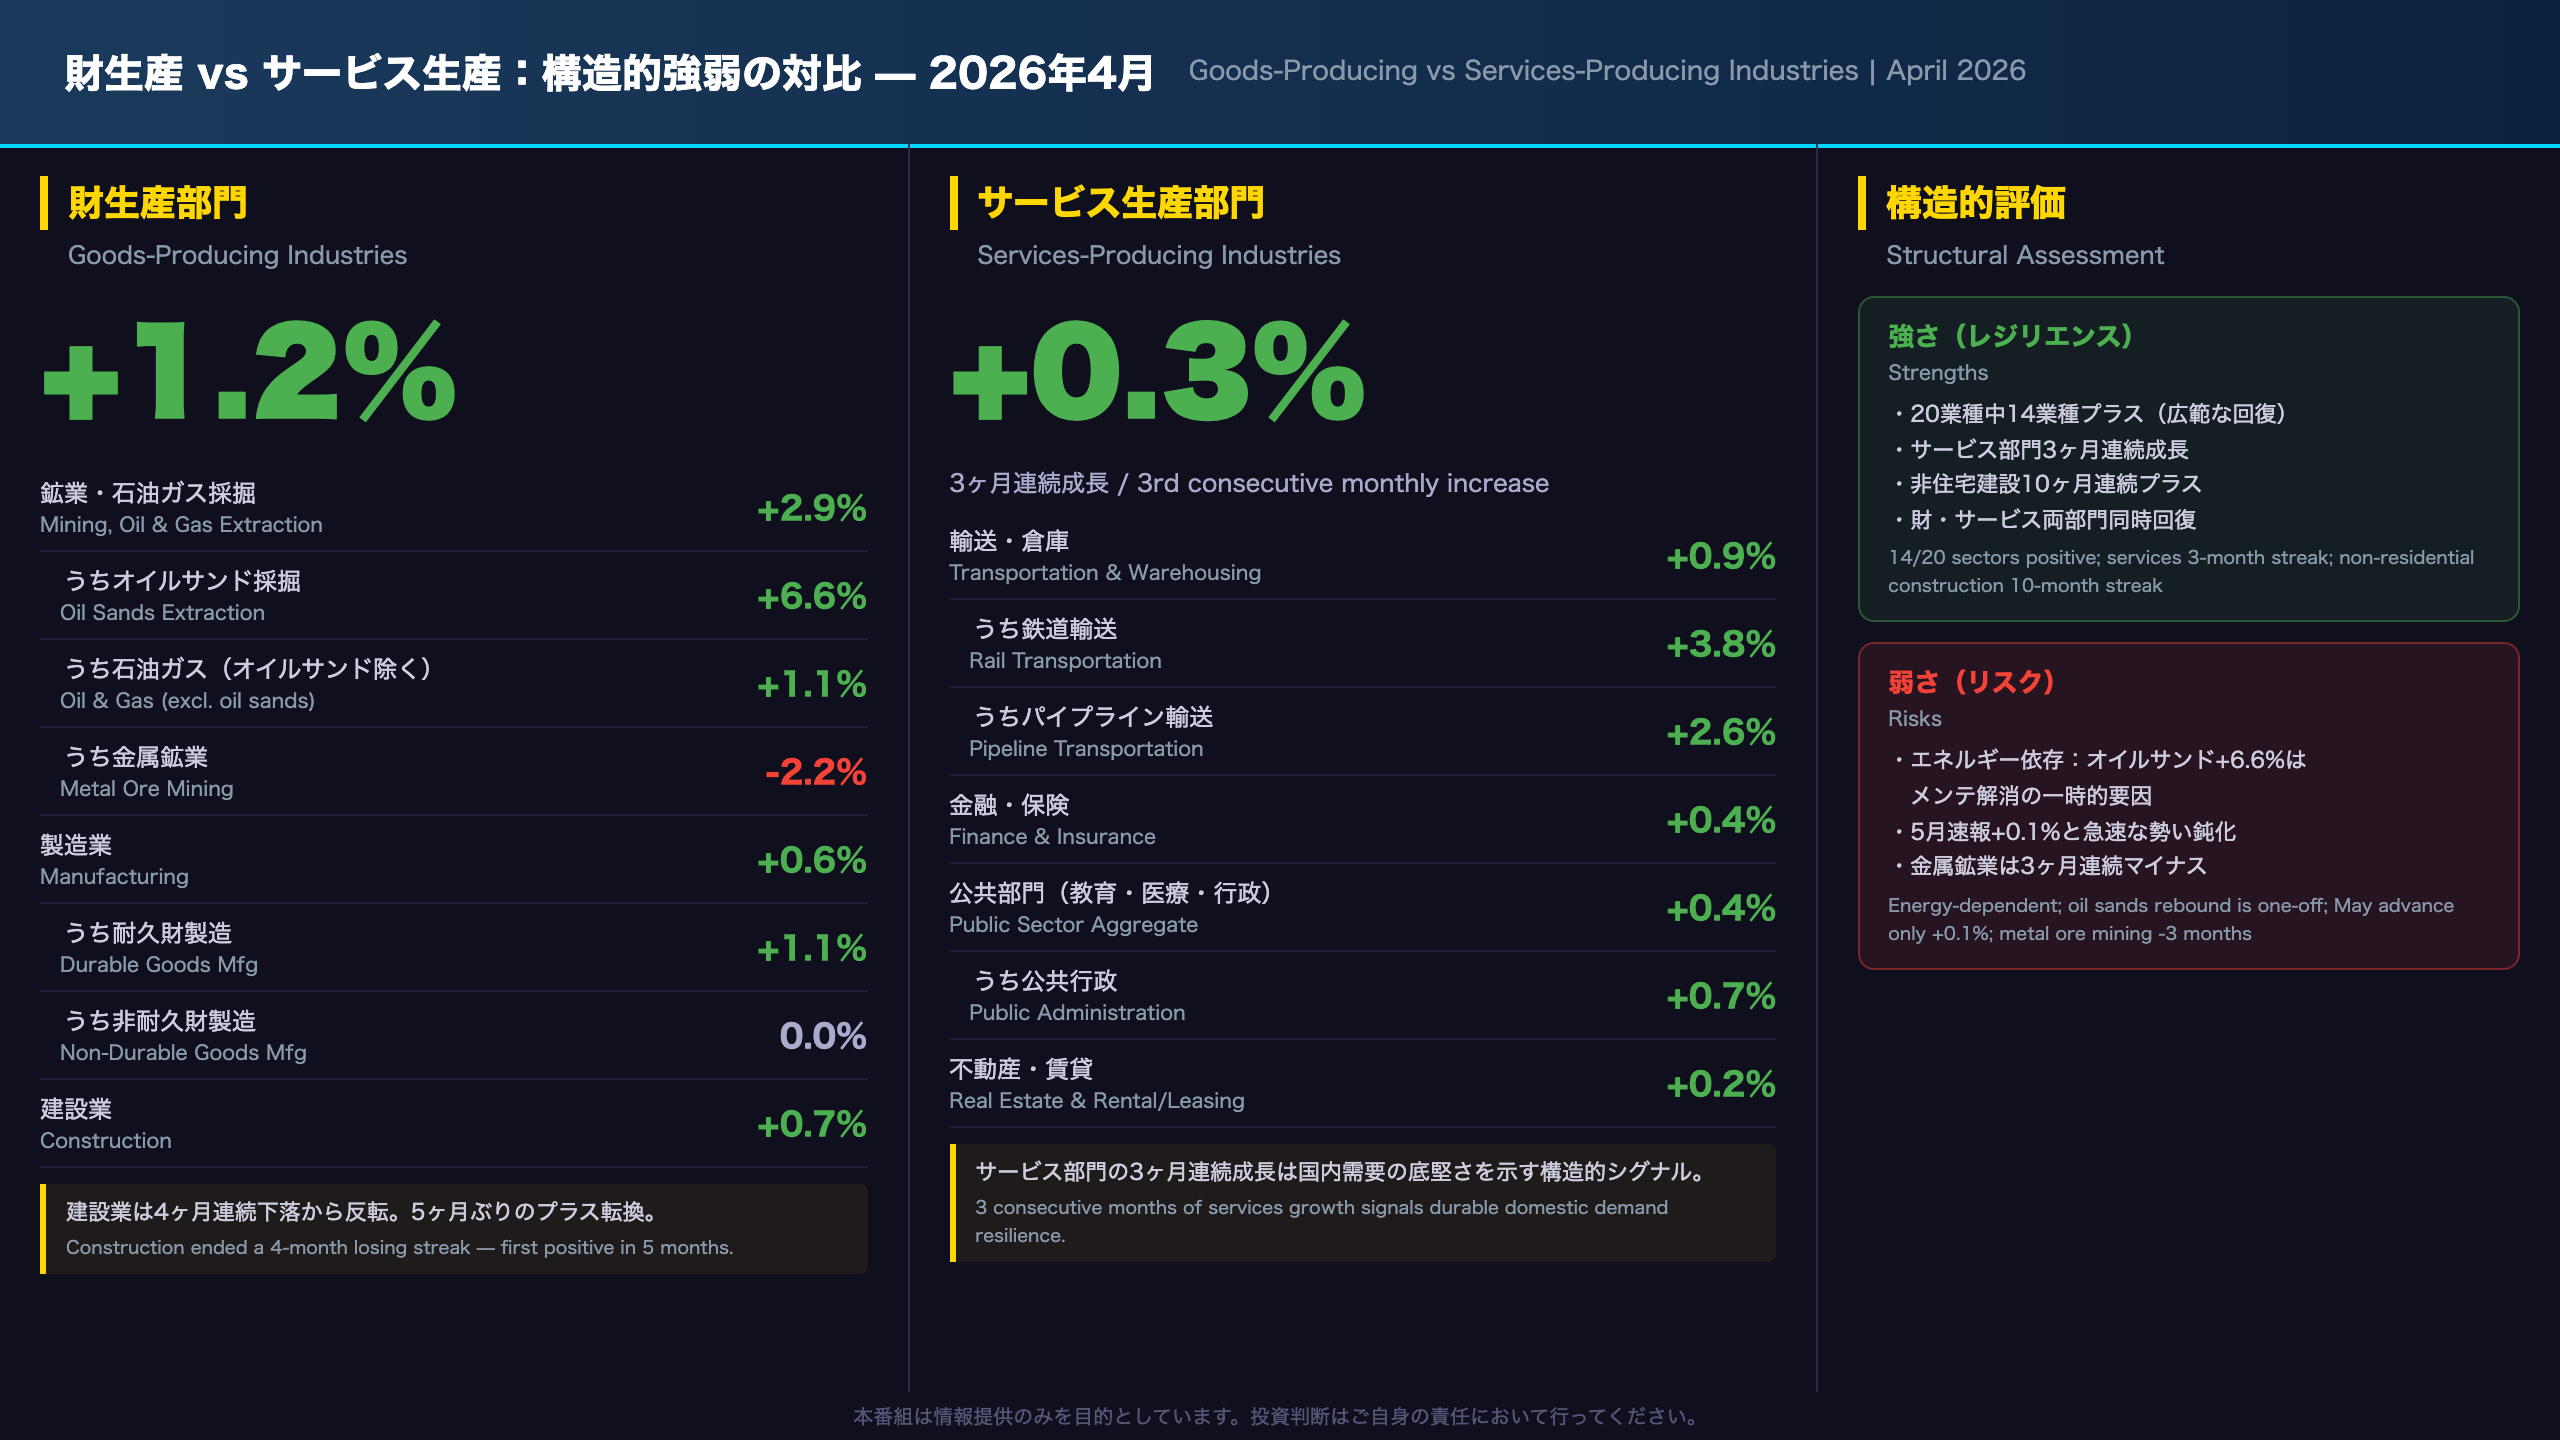
The goods sector’s 1.2% expansion was the stronger of the two broad categories, but its composition warrants scrutiny.
Mining, Quarrying & Oil/Gas Extraction (+2.9%): This was the single largest contributor to April’s headline. Oil sands extraction surged 6.6%, driven by the normalization of synthetic crude oil production after “longer than anticipated unscheduled maintenance” constrained output through Q1 2026. This is a classic supply-side rebound from a one-off disruption, not a demand-driven acceleration. Investors should be cautious about extrapolating this rate forward.
Manufacturing (+0.6%): Durable goods led at +1.1%, with machinery manufacturing (+3.0%) coinciding with higher exports of industrial machinery. Non-durable goods were flat — petroleum and coal products (+5.8%) were fully offset by chemical manufacturing (-6.8%).
Construction (+0.7%): The end of a four-month losing streak is a genuine positive. Residential building construction (+1.3%) was driven by multi-unit buildings and alterations. Non-residential building construction (+1.2%) extended its streak to 10 consecutive months of growth — a durable signal of business investment activity.
Services-Producing Industries (+0.3%)
The services sector’s third consecutive monthly gain is arguably more structurally significant than the goods sector’s energy-driven spike.
| Subsector | MoM | Key Driver |
|---|---|---|
| Transportation & Warehousing | +0.9% | Rail +3.8% (largest since Mar 2025), Pipeline +2.6% |
| Finance & Insurance | +0.4% | Deposits and mutual fund activity |
| Public Sector | +0.4% | 5th increase in 6 months |
| Real Estate & Rental | +0.2% | GTA home resale activity |
Structural Assessment
The goods sector recovery is energy-dependent and carries mean-reversion risk. The services sector’s steady, broad-based growth is the more durable signal for Canada’s domestic economic health — and the more relevant input for BOC’s assessment of underlying demand conditions.
業種別貢献度ランキング:プラス・マイナス要因の全解剖
Sector-by-Sector Contribution Analysis
Top Positive Contributors
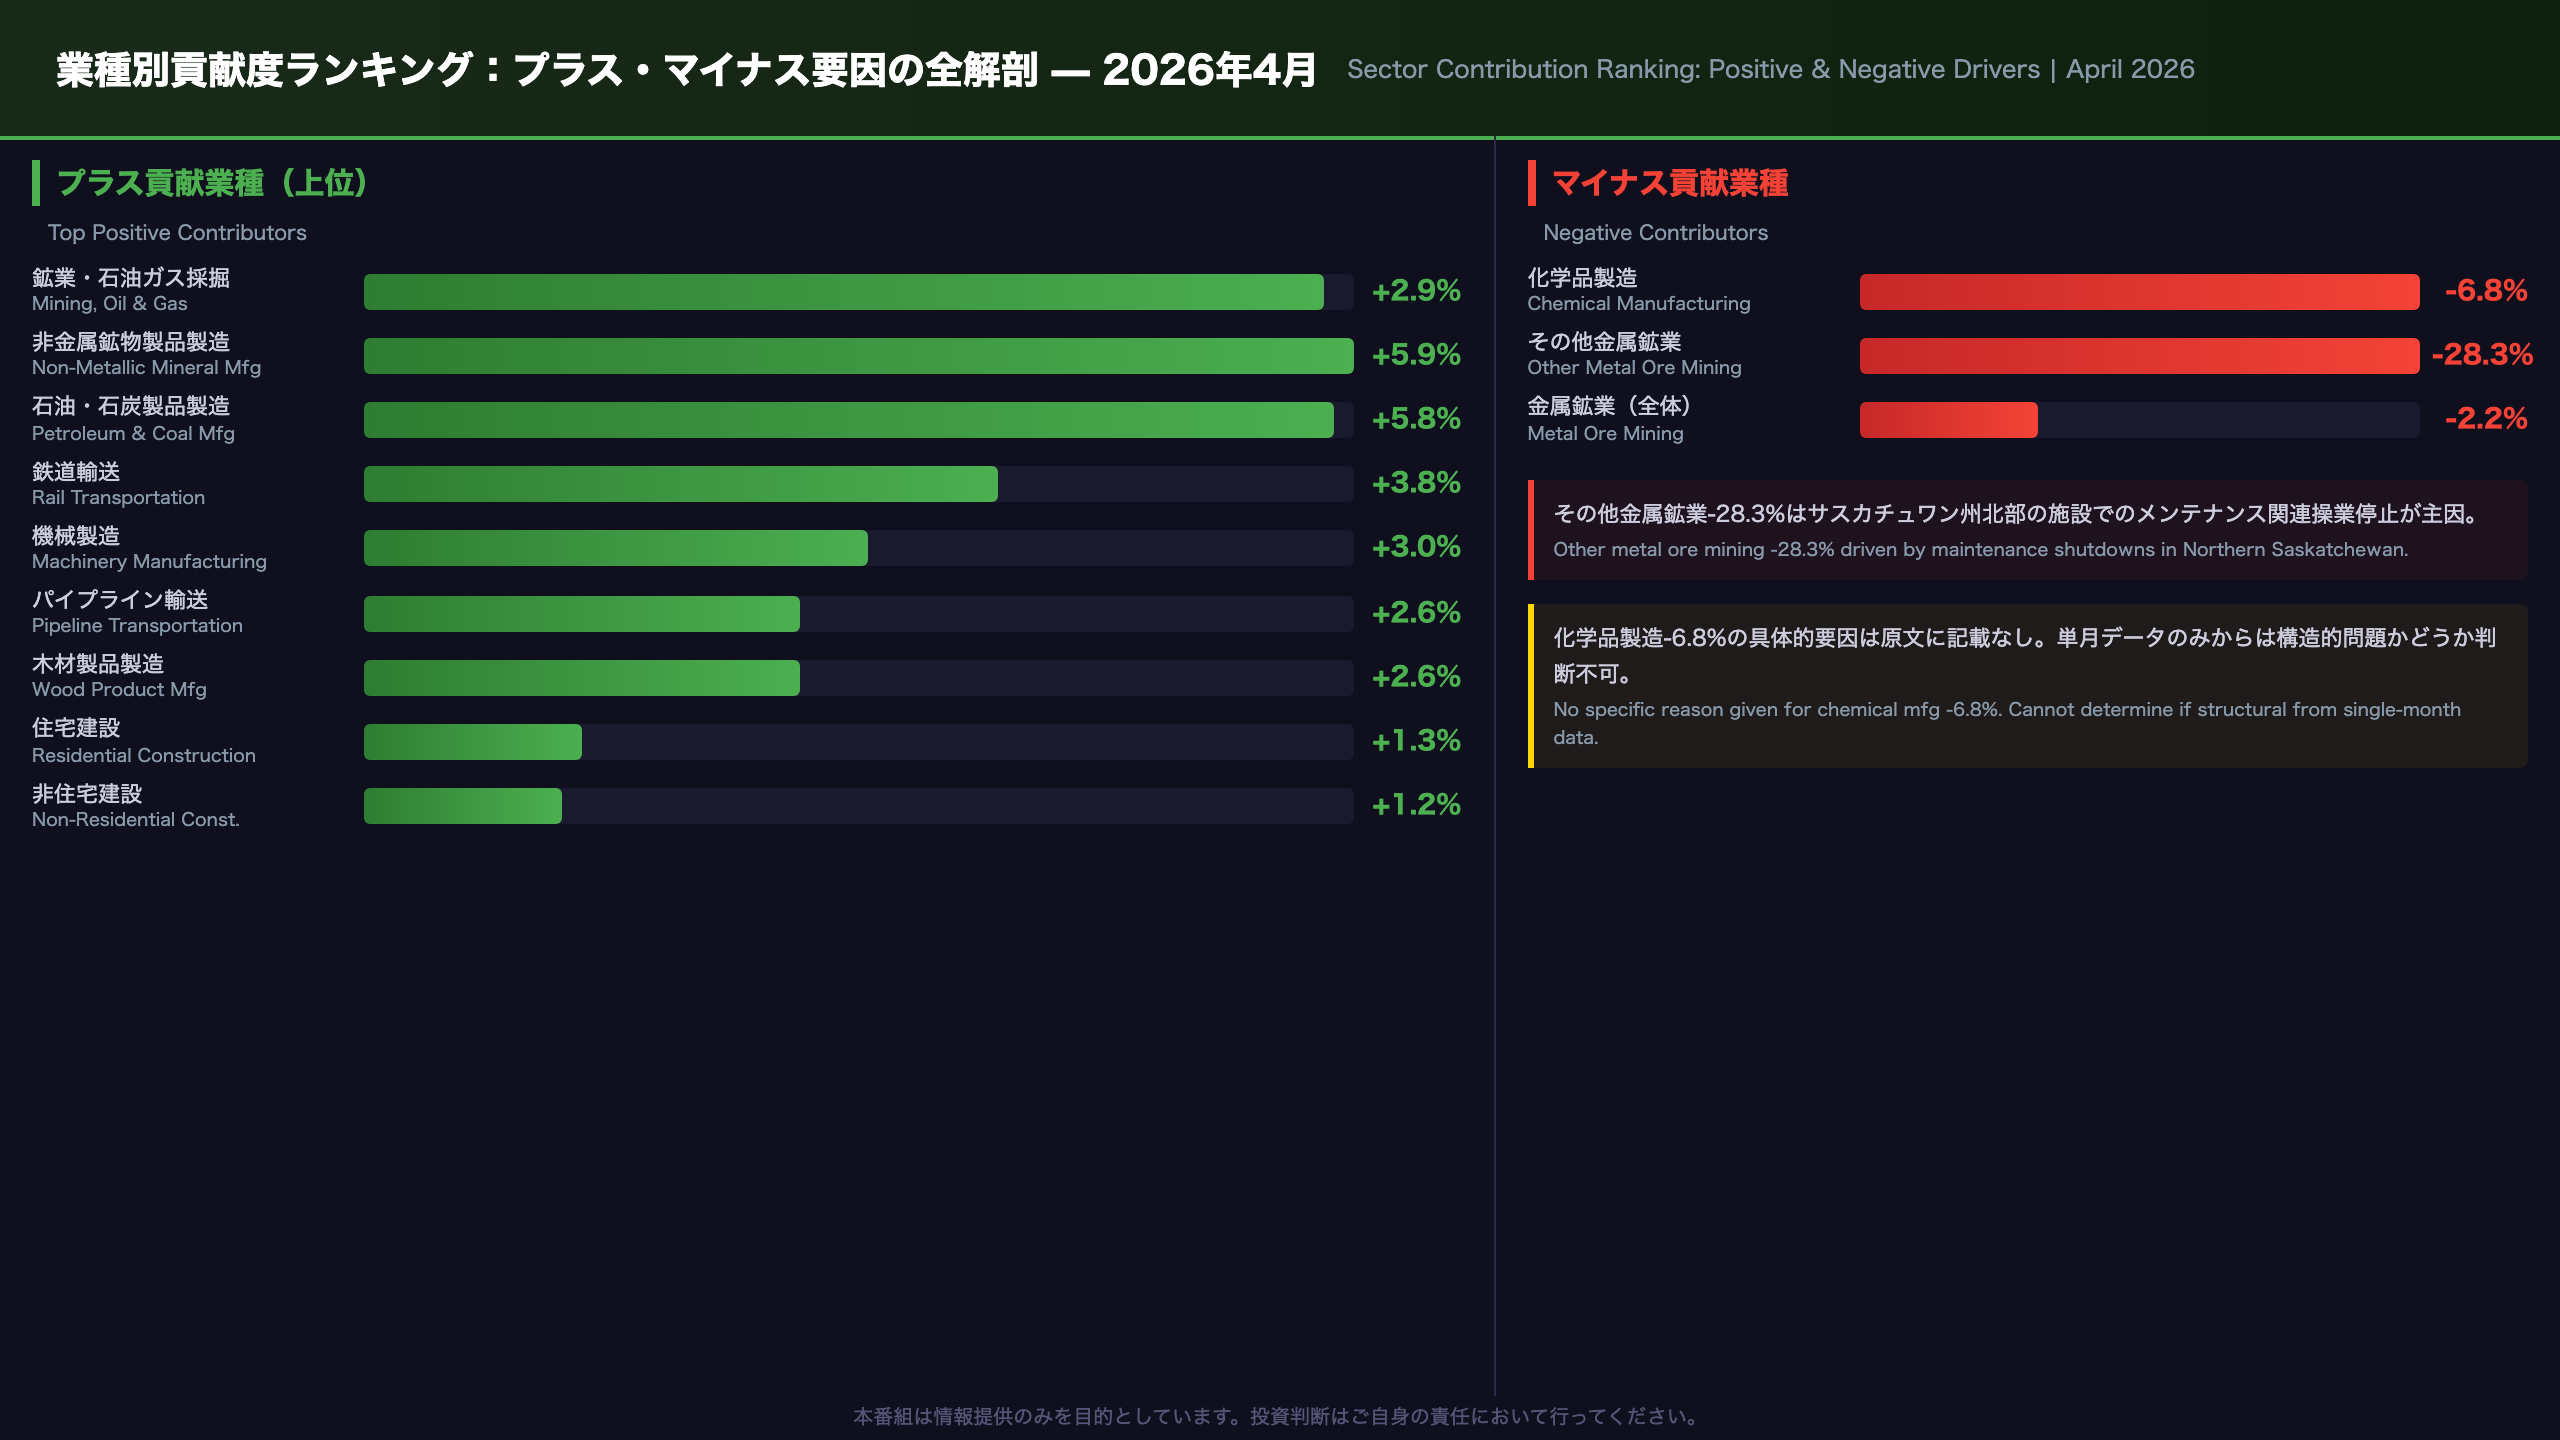
| Sector | MoM | Key Note |
|---|---|---|
| Mining, Oil & Gas Extraction | +2.9% | Largest since Feb 2024; oil sands +6.6% |
| Non-Metallic Mineral Product Mfg | +5.9% | Largest gain within manufacturing |
| Petroleum & Coal Product Mfg | +5.8% | 3rd consecutive monthly gain |
| Machinery Manufacturing | +3.0% | Coincided with higher industrial machinery exports |
| Rail Transportation | +3.8% | Largest since March 2025; grain & auto carloadings |
| Pipeline Transportation | +2.6% | Reversed 4-month decline; largest since July 2020 |
| Wood Product Manufacturing | +2.6% | Likely linked to residential construction activity |
| Residential Building Construction | +1.3% | Multi-unit buildings and alterations |
| Non-Residential Building Construction | +1.2% | 10th consecutive monthly increase |
| Public Administration | +0.7% | All levels of government expanded |
Negative Contributors
| Sector | MoM | Key Note |
|---|---|---|
| Chemical Manufacturing | -6.8% | Fully offset petroleum & coal product gains |
| Metal Ore Mining | -2.2% | 3rd consecutive monthly decline |
| Other Metal Ore Mining | -28.3% | Maintenance shutdowns in Northern Saskatchewan |
Pipeline Transportation: A Structural Signal
Pipeline transportation’s +2.6% — the largest expansion since July 2020 — is particularly noteworthy. The StatCan release notes that “operational disruptions that slowed crude oil movement in the first quarter of 2026 eased up.” This normalization corroborates the oil sands production rebound and suggests that Q1 2026 was artificially depressed by supply-side constraints rather than demand weakness.
Chemical Manufacturing Collapse (-6.8%)
The StatCan release does not provide a specific explanation for the chemical manufacturing contraction. Its magnitude (-6.8%) is striking given the broader manufacturing recovery. Without additional context, it is premature to characterize this as a structural deterioration — single-month data alone cannot support that conclusion.
BOC政策インプリケーション & HMMレジーム評価
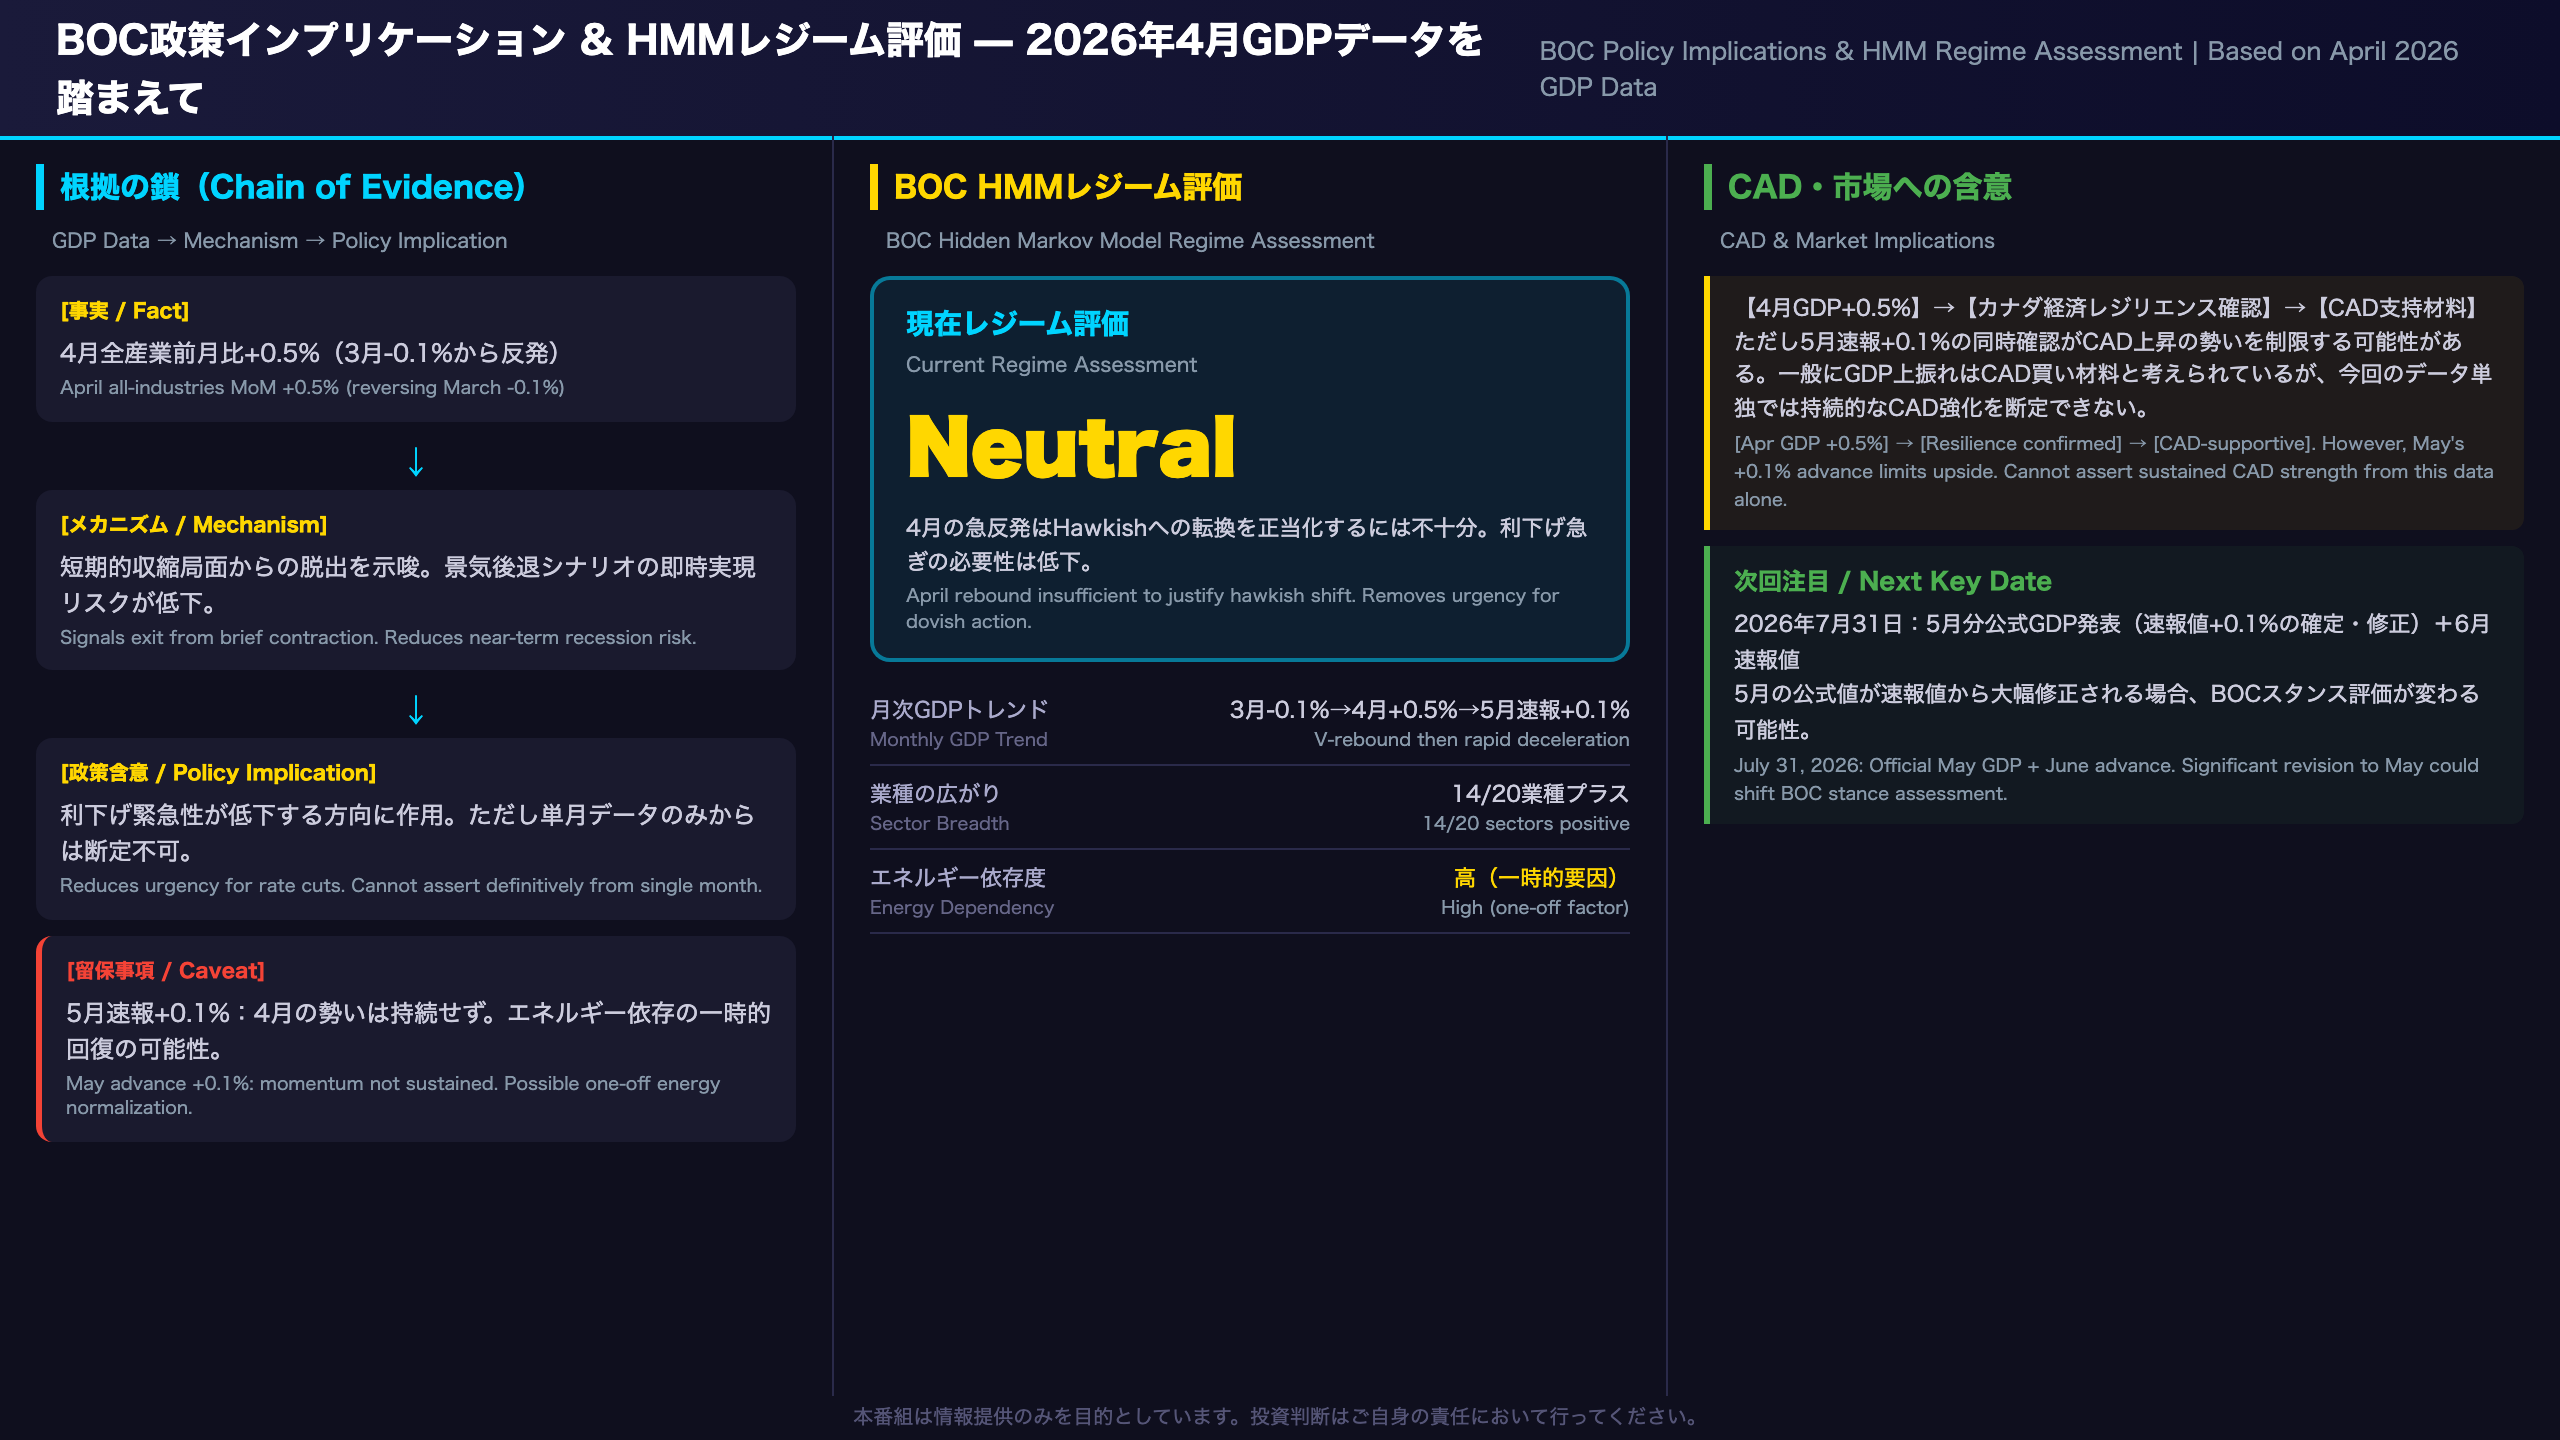
BOC Policy Implications & HMM Regime Assessment
The Chain of Evidence
GDP Data → Economic Mechanism → Policy Implication
-
[Fact] April all-industries MoM: +0.5% (reversing March’s -0.1%)
→ [Mechanism] Signals exit from a brief contractionary episode. Reduces the near-term probability of the “tariff-shock recession” scenario that the BOC has flagged as a downside risk.
→ [Policy Implication] Reduces urgency for additional rate cuts in the near term. However, this cannot be asserted definitively from a single month’s data. -
[Fact] May advance estimate: +0.1%
→ [Mechanism] Suggests April’s surge is not carrying forward. If the energy sector rebound was a one-off supply normalization, mean reversion in subsequent months is expected.
→ [Policy Implication] The BOC is likely to avoid over-interpreting April’s headline. A cautious, data-dependent stance is the most probable response.
BOC HMM Regime Assessment
| Dimension | Assessment |
|---|---|
| Monthly GDP Trend | Mar -0.1% → Apr +0.5% → May advance +0.1%: V-shaped rebound followed by rapid deceleration |
| Quasi-Quarterly (Q2 start) | April +0.5% + May advance +0.1% = positive Q2 start, improving from Q1 weakness |
| Sector Breadth | 14/20 sectors positive — consistent with Neutral to mildly positive regime |
| Energy Dependency | Growth concentrated in one-off energy normalization — sustainability risk |
| Overall Regime | Neutral — insufficient to justify hawkish shift; removes urgency for dovish action |
CAD Implications
[April GDP +0.5%] → [Canadian economic resilience confirmed] → [CAD-supportive]
However, the simultaneous confirmation of May’s +0.1% advance estimate limits the magnitude of any CAD appreciation. It is generally understood that GDP upside surprises support the domestic currency, but today’s data alone cannot justify a sustained CAD strengthening thesis.
Key Dates to Watch
- July 31, 2026: Official May GDP release (revision of +0.1% advance) + June advance estimate
- A significant upward revision to May’s figure would strengthen the case for BOC holding rates steady; a downward revision would revive dovish expectations
Disclaimer: This article is for informational purposes only. All investment decisions are made solely at your own risk.