📺 Watch the Full Video Analysis
This article was automatically generated by the NFC Market Live AI analysis system. (Updated: 2026-06-30 10:38 JST)
📄 Primary Source
Reserve Bank of Australia
https://www.rba.gov.au/statistics/frequency/fin-agg/2026/fin-agg-0526.html
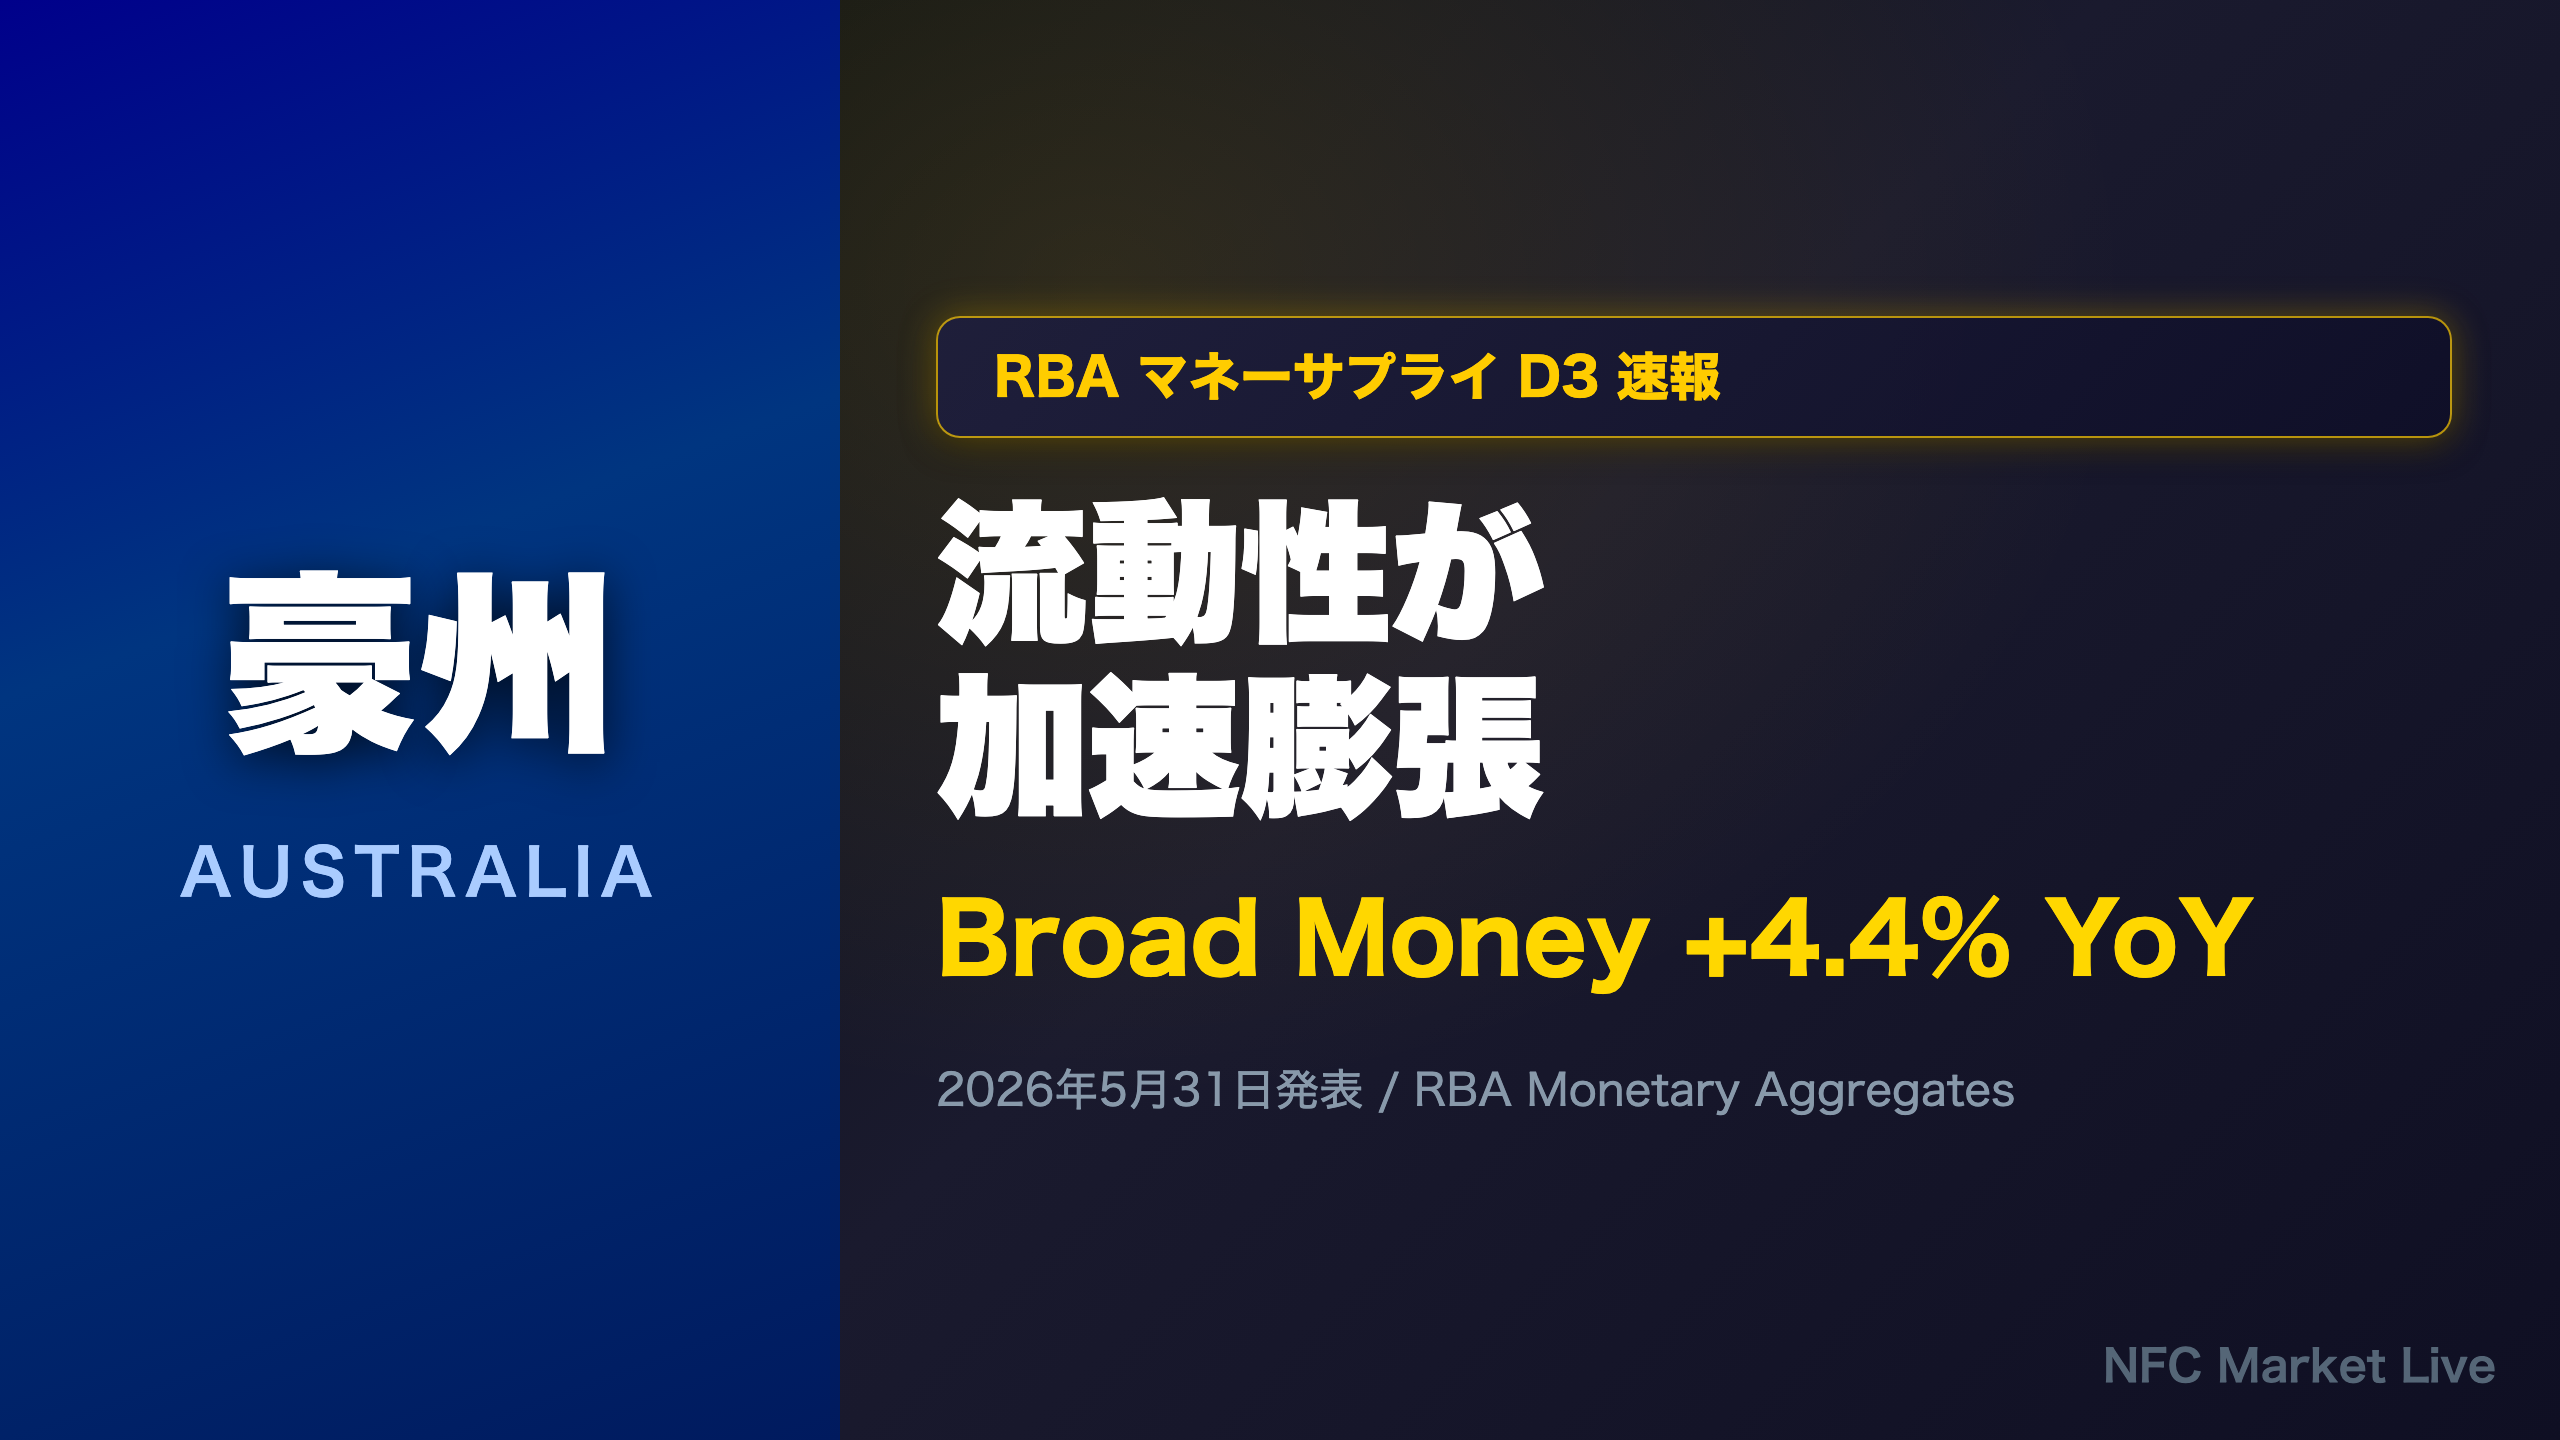
Deep dive into Australia’s latest RBA Monetary Aggregates (D3) released May 2026. Broad Money surged to AUD 3,461B (+4.4% YoY), M3 hit AUD 3,447B, and M1 expanded sharply. We analyze what accelerating liquidity growth means for RBA’s rate-cut cycle, AUD/USD, and Australian equities. Essential viewing for macro investors tracking the RBA policy path.
#AustraliaMacro #RBA #MoneySupply #AUD #BroadMoney #LiquidityWatch
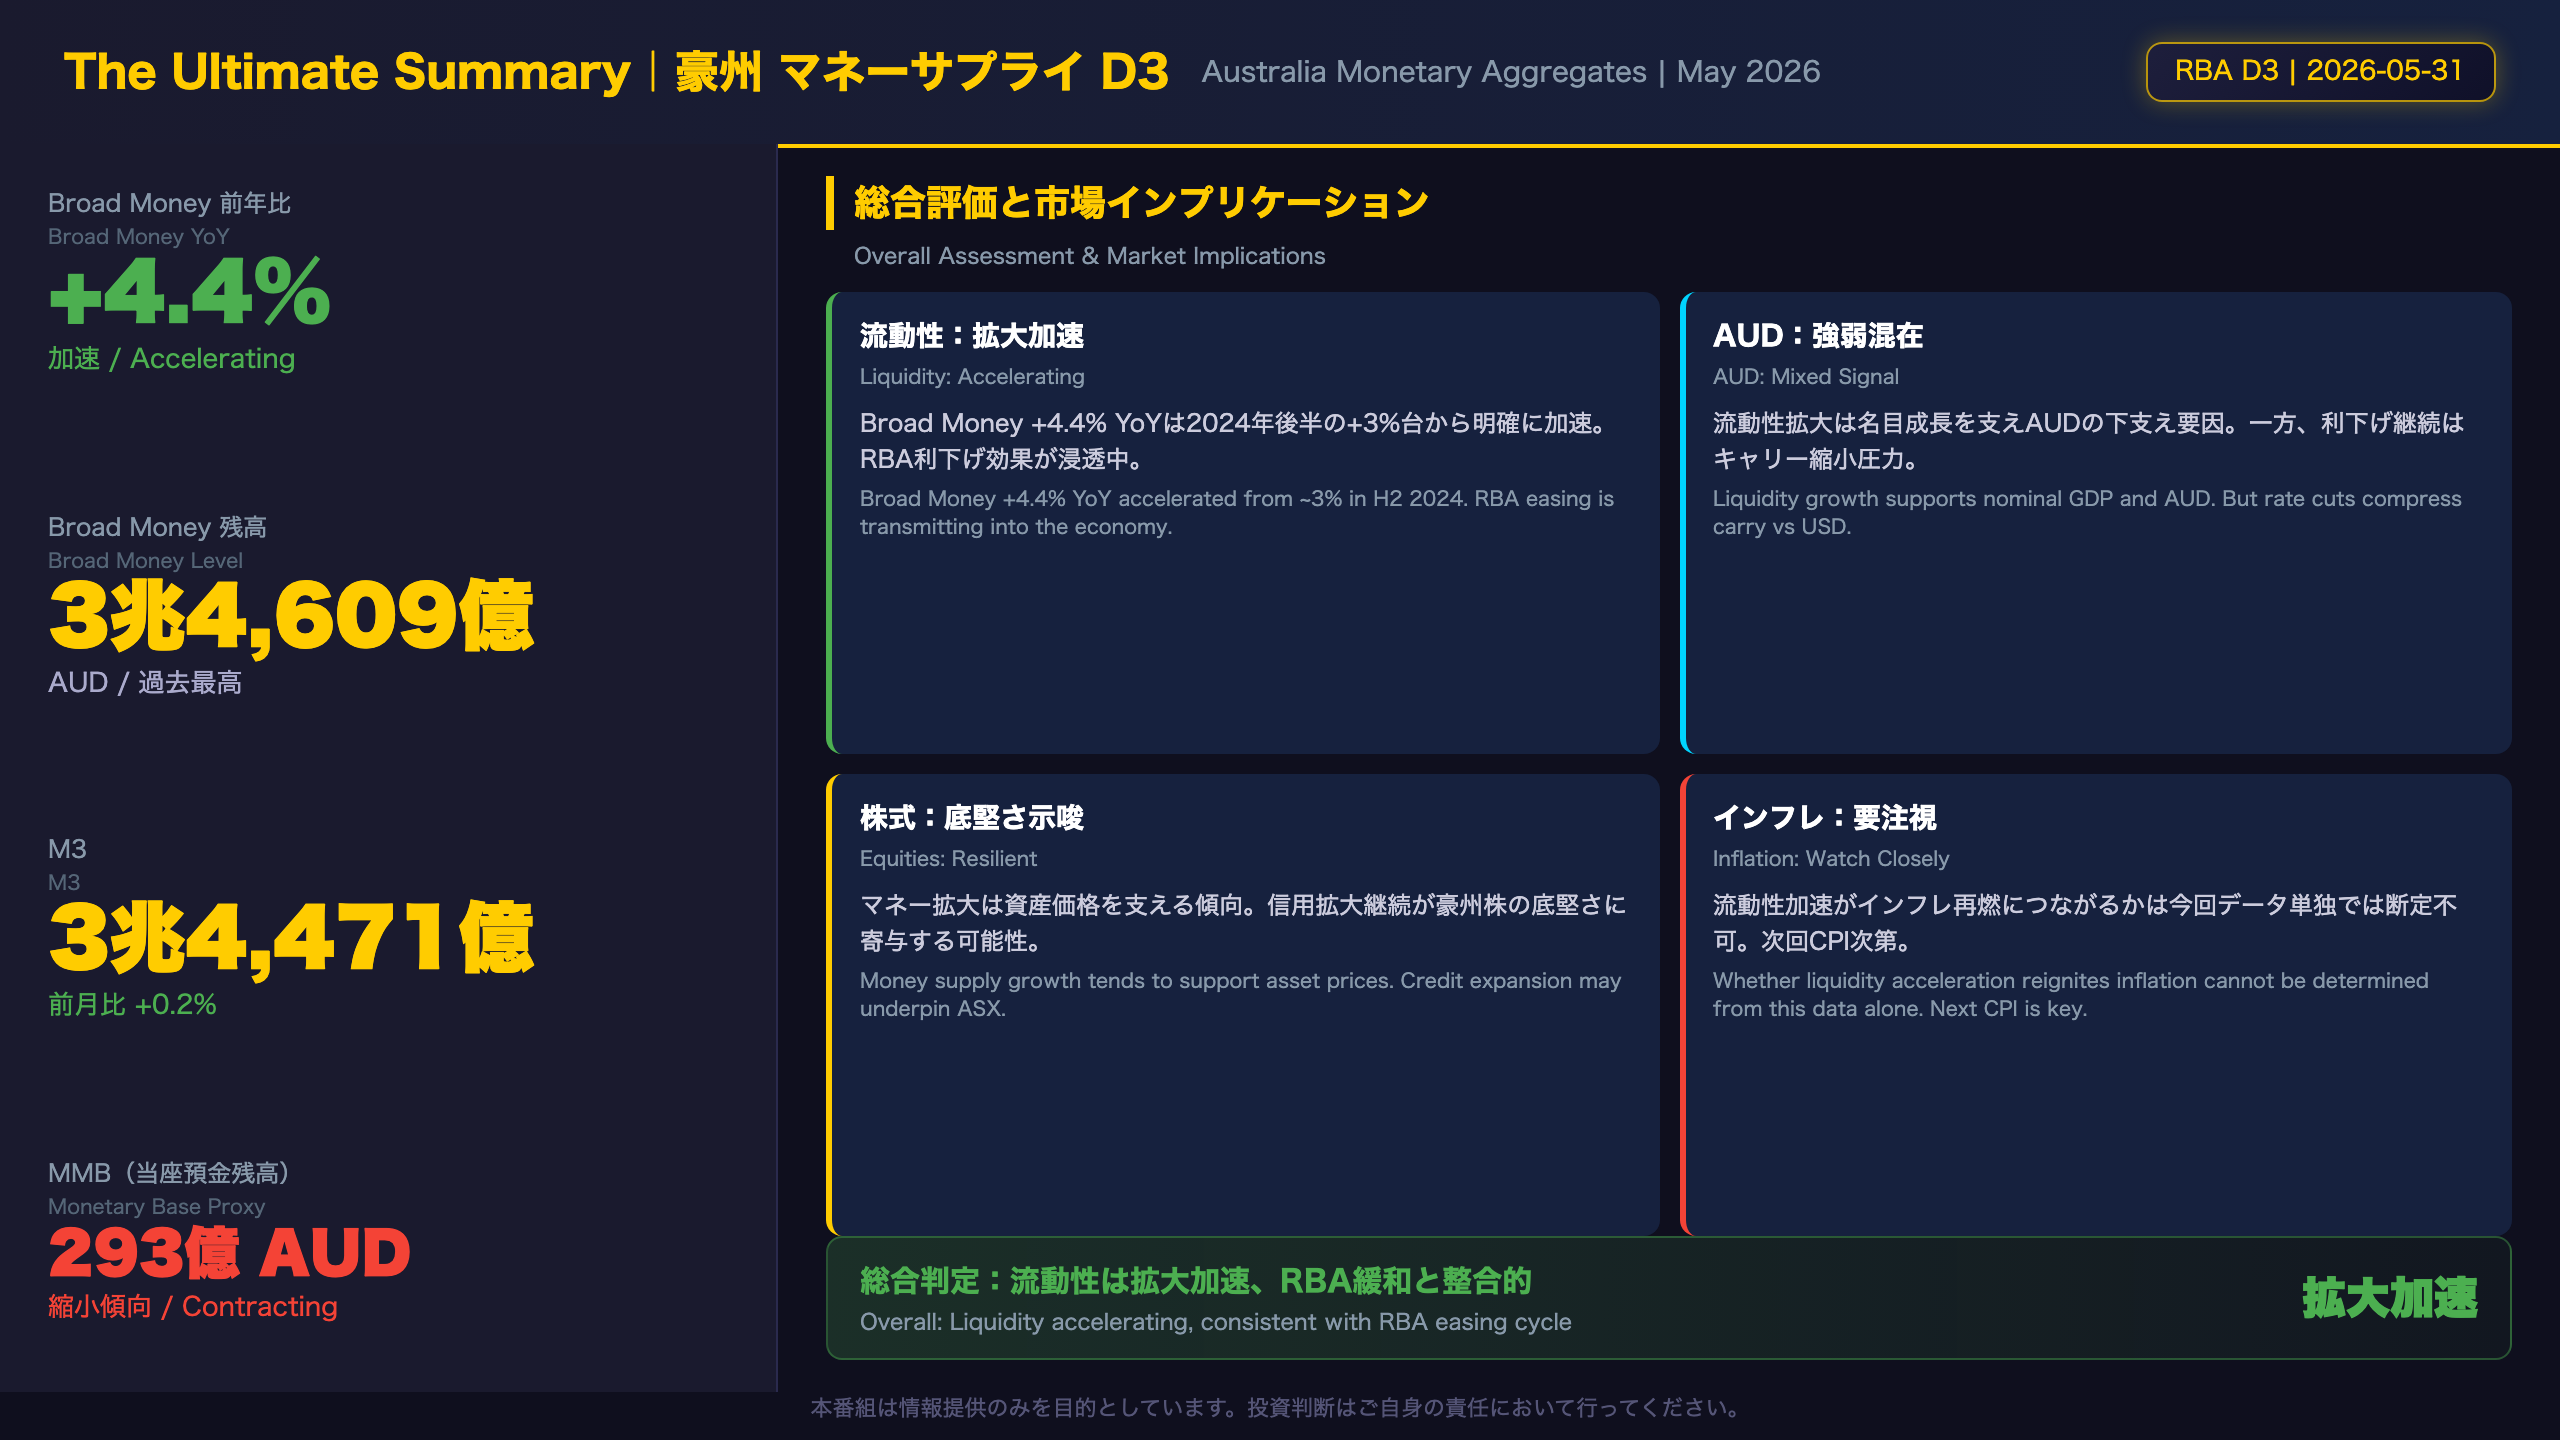
The Ultimate Summary:流動性は加速拡大、RBA利下げと整合的だが過熱リスクも点灯
The Ultimate Summary: Australia Money Supply — May 2026
The Headline Finding
The RBA’s May 2026 Monetary Aggregates release (D3) reveals that Broad Money grew 4.4% year-on-year to AUD 3.461 trillion — a clear acceleration from the 3% range seen in late 2024. This represents an increase of approximately AUD 140 billion from June 2024 levels, strongly suggesting that the RBA’s rate-cutting cycle is successfully transmitting into broader monetary expansion.
What Is the RBA D3 Report?
The RBA publishes monthly monetary aggregate statistics (Table D3) covering the Australian financial system. Key series include:
– M1: Currency + current deposits (narrow money)
– M3: M1 + all deposits at banks and credit unions (broad credit)
– Broad Money: M3 + borrowings from private sector by AFIs (most comprehensive)
– MMB: A proxy for the monetary base / excess reserves
Strengths (Bullish Signals)
- Broad Money +4.4% YoY: Acceleration from ~3% in H2 2024. Liquidity is ample to support nominal GDP growth.
- M3 at AUD 3.447T: Up ~20% from early 2023 levels of ~AUD 2.87T, reflecting sustained credit expansion.
- Term Deposits at AUD 1.879T: Elevated savings buffers suggest households and corporates retain financial capacity.
Weaknesses (Cautionary Signals)
- M1 dipped MoM: Fell slightly from AUD 1.984T to AUD 1.979T, suggesting a temporary pullback in short-term liquidity.
- MMB contraction: The monetary base proxy fell to AUD 29.3B from AUD 36.5B in January 2025 — a ~20% decline. This indicates compression of excess reserves in the banking system, potentially reducing liquidity buffers.
Comparison with Global Context
For reference, the US Fed’s M2 growth has been running at approximately 3-4% YoY in 2025-2026. Australia’s Broad Money at +4.4% is modestly above this pace, consistent with a more aggressive easing cycle. The ECB’s M3 growth has been recovering from near-zero in 2023. Australia’s trajectory appears more robust than the Eurozone but broadly in line with the US.
Market Implications
- AUD/USD: Liquidity expansion supports nominal growth and may underpin AUD, but ongoing rate cuts compress the interest rate differential vs USD, creating a mixed signal.
- ASX equities: Money supply growth historically correlates with asset price appreciation. The sustained expansion is a structural tailwind.
- RBA policy path: Whether this liquidity acceleration reignites inflation is the key question. The next CPI print will be decisive for the RBA’s rate decision.
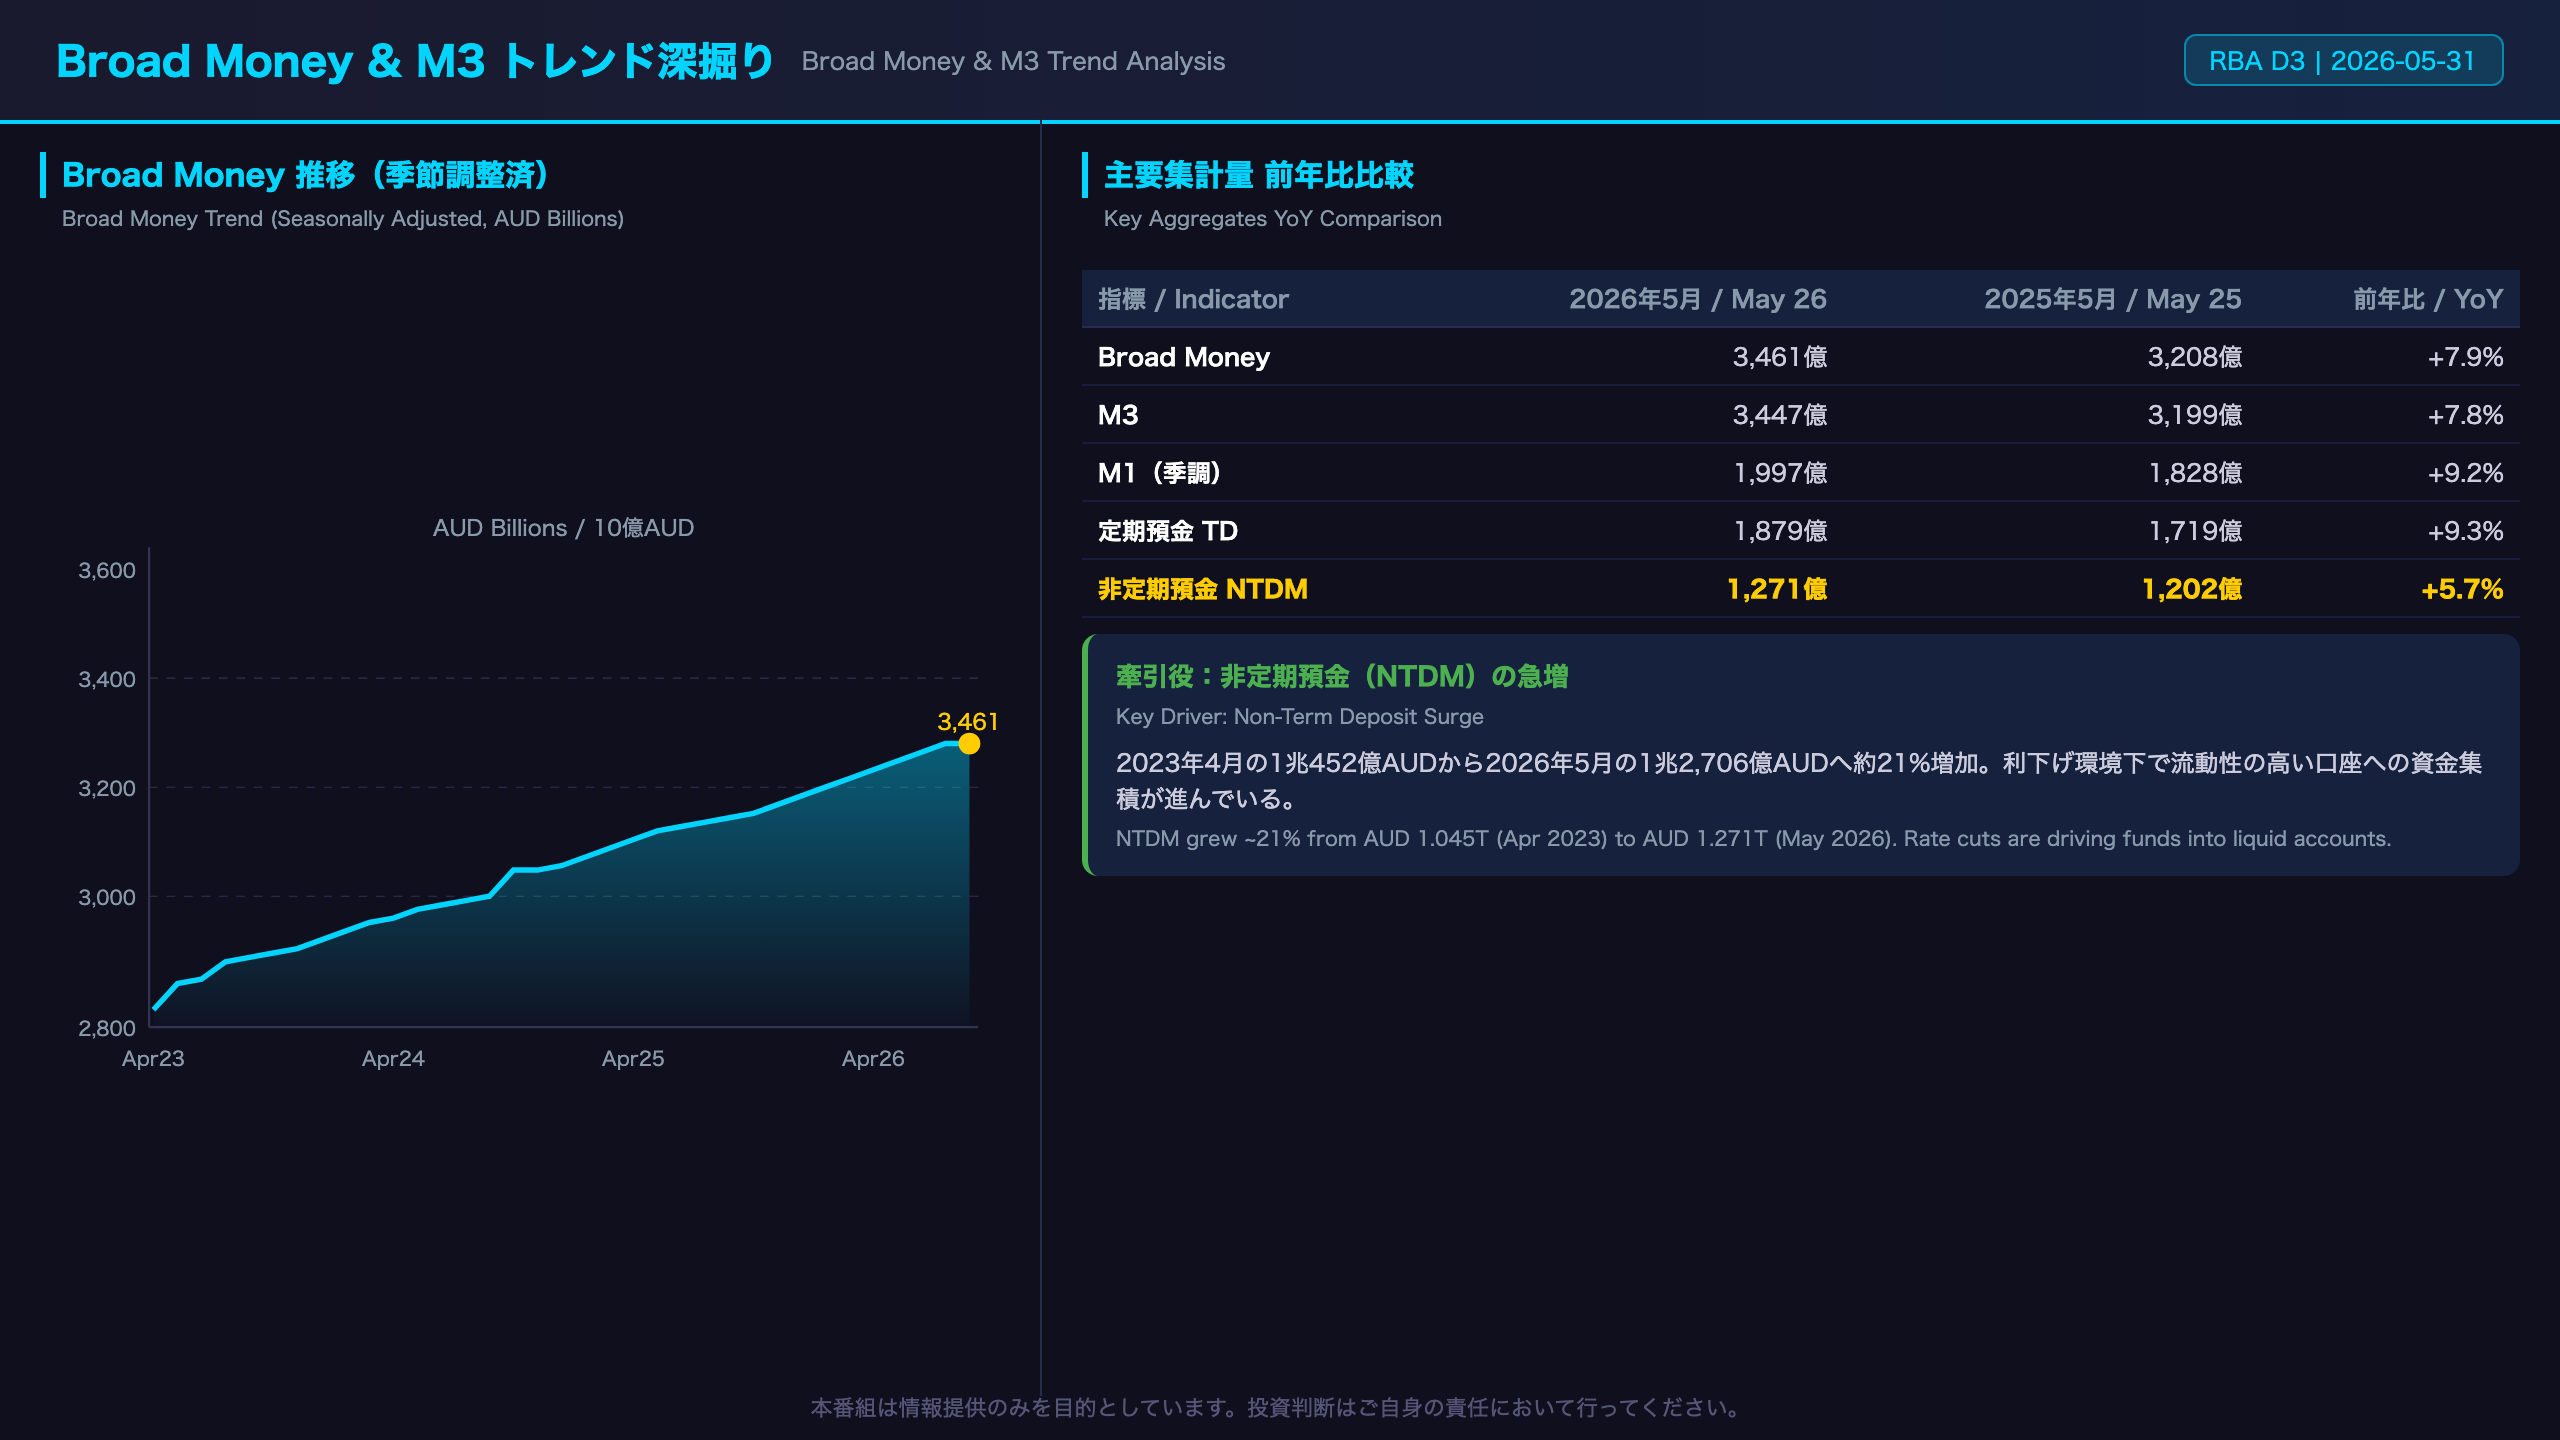
Broad Money & M3 トレンド深掘り:加速の構造を読む
Broad Money & M3 Trend Deep Dive
Broad Money Acceleration in Historical Context
| Date | Broad Money (AUD) | YoY Growth (est.) |
|---|---|---|
| Apr 2023 | 2.883T | — |
| Apr 2024 | 3.028T | +5.0% |
| Apr 2025 | 3.201T | +5.7% |
| Apr 2026 | 3.463T | +8.2% |
| May 2026 | 3.461T | +4.4% |
The April 2026 YoY figure of +8.2% stands out, though this partly reflects a lower base in April 2025. May’s +4.4% is more moderate but still above the ~3% range seen in H1 2024.
Decomposing M3 Growth
The primary driver of M3 expansion is non-term deposits (NTDM), which grew from AUD 1.045T in April 2023 to AUD 1.271T in May 2026 — a ~21% increase. This reflects accumulation of funds in liquid, on-call accounts by households and corporates.
Term deposits (TD) growth has moderated after peaking in late 2024. As the RBA cuts rates, the relative attractiveness of fixed-rate term deposits diminishes, and funds appear to be rotating into more liquid accounts. This is a classic behavioral response to a rate-cutting cycle.
International Comparison
Australia’s Broad Money growth of +4.4% YoY compares favorably with:
– US M2: ~3-4% YoY in 2025-2026 (recovering from contraction in 2022-2023)
– Eurozone M3: Recovering from near-zero in 2023, now ~3-4% YoY
– UK M4: ~3-5% YoY range
Australia’s pace is modestly above peers, consistent with a more aggressive easing cycle relative to the Fed and ECB.
Bull vs Bear Interpretation
Bull case: Broad Money acceleration signals that RBA easing is successfully transmitting into the real economy. Credit creation is healthy, supporting nominal GDP growth and asset prices.
Bear case: If liquidity expansion flows into asset price inflation rather than productive investment, it could reignite consumer price inflation or fuel asset bubbles. This risk cannot be assessed from monetary data alone — the next CPI print and credit quality data are essential inputs.
Key Threshold to Watch
If Broad Money YoY growth exceeds 5% for two consecutive months, this would historically be associated with above-target inflation in Australia. The current +4.4% is approaching but has not yet breached this threshold.
M1・MMB・ODCD:短期流動性と銀行システムの内部構造
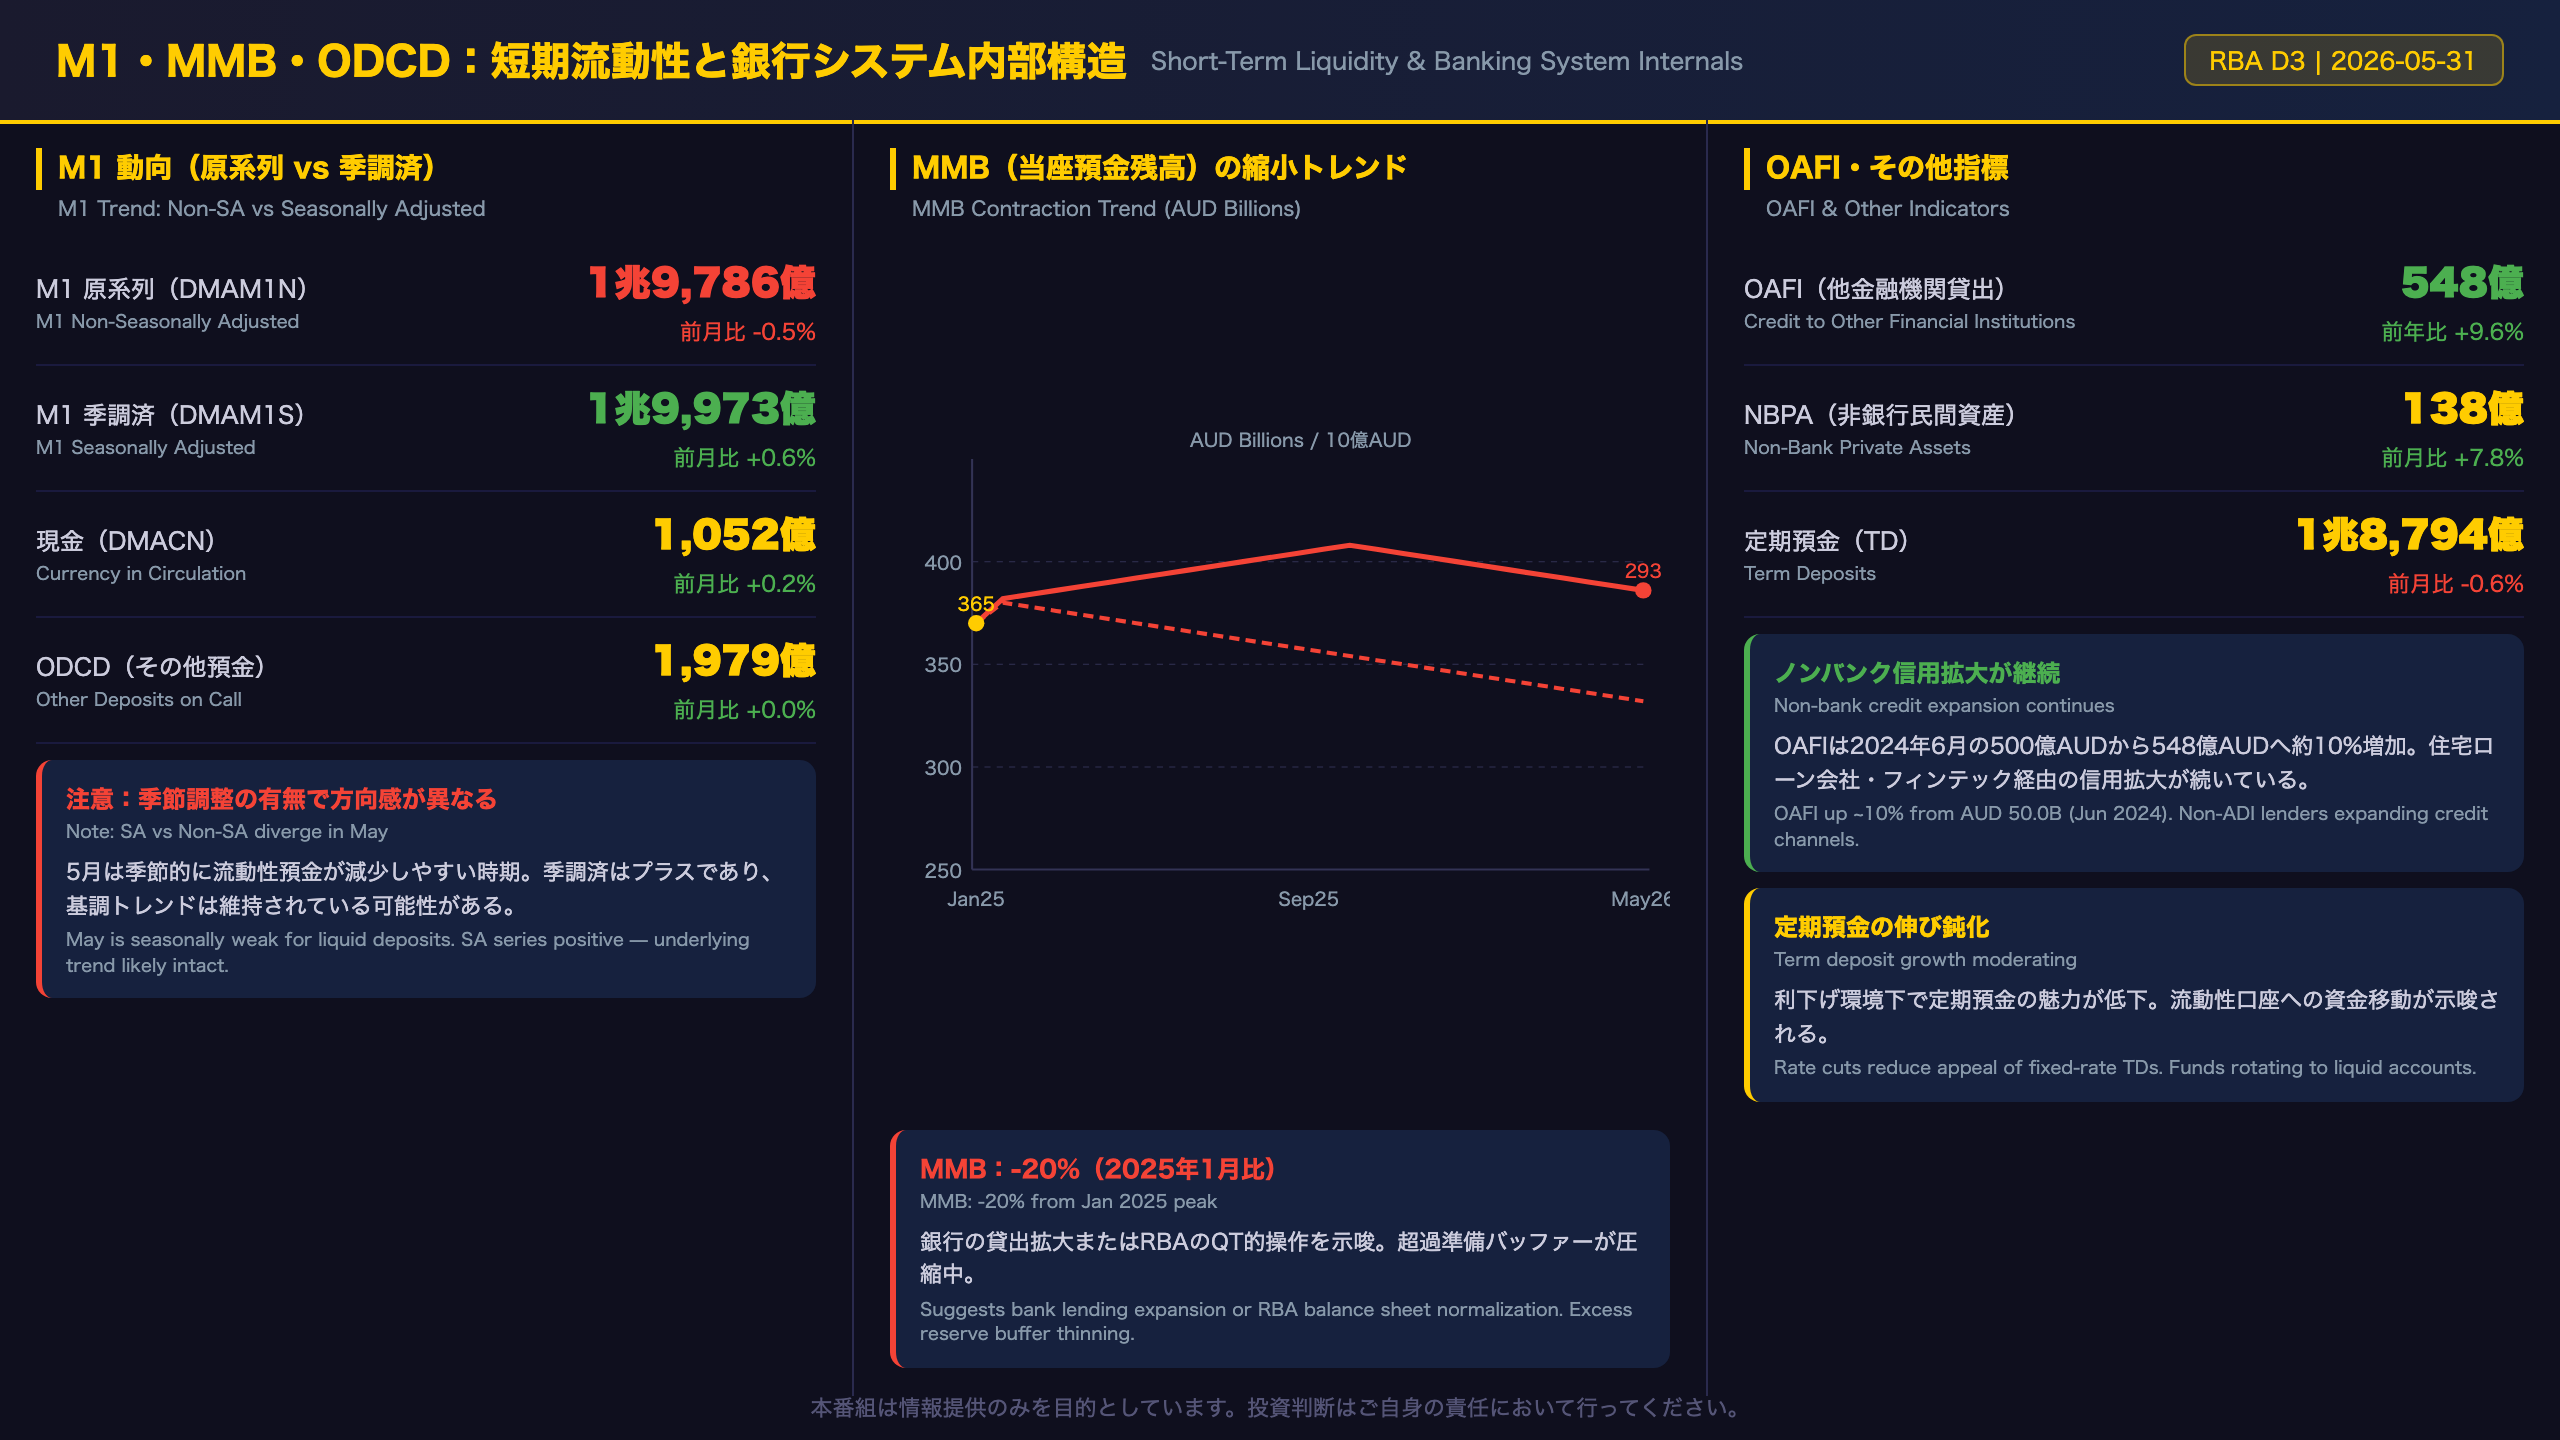
M1, MMB, and ODCD: Short-Term Liquidity and Banking System Internals
M1 Dynamics: Adjusted vs Unadjusted Tell Different Stories
| Series | Apr 2026 | May 2026 | MoM |
|---|---|---|---|
| M1 Non-SA (DMAM1N) | 1,989.4B | 1,978.6B | -0.5% |
| M1 Seasonally Adj (DMAM1S) | 1,984.8B | 1,997.3B | +0.6% |
The divergence between adjusted and unadjusted M1 is important context. May is typically a month when cash and liquid deposits seasonally decline in Australia. The seasonally adjusted series turning positive suggests the underlying trend remains intact. Interpreting the raw series decline as a bearish signal would be an overreach.
MMB Contraction: The Most Structurally Significant Change
MMB (DMAMMB) serves as a proxy for excess reserves and settlement balances within the Australian banking system — analogous to the “reserves” component of the monetary base in the US Federal Reserve framework.
- January 2025 peak: AUD 36.5B
- May 2026: AUD 29.3B
- Change: approximately -20% over ~16 months
Three interpretations are plausible:
1. RBA balance sheet normalization: The RBA may be allowing maturing bonds to roll off without reinvestment, reducing system liquidity.
2. Bank lending expansion: Banks drawing down excess reserves to fund loan growth — consistent with Broad Money expansion.
3. Regulatory changes: Possible but not evidenced in the source data.
OAFI: Non-Bank Credit Expansion
OAFI (credit to other financial institutions) reached AUD 54.8B in May 2026, up ~10% from AUD 50.0B in June 2024. This suggests continued expansion of non-bank credit channels — mortgage companies, fintechs, and other non-ADI lenders — which is a structural feature of the Australian financial system.
Bull vs Bear on MMB Contraction
Bull: MMB contraction reflects banks actively deploying excess reserves into productive lending. This is a healthy sign of credit intermediation functioning normally.
Bear: Compression of excess reserves reduces the banking system’s liquidity buffer. In a stress scenario, this could amplify funding pressures. However, no stress indicators are visible in the current data.
市場インプリケーション:AUD・豪州株・RBA政策への含意

Market Implications: AUD, ASX, and RBA Policy
The Evidence Chain Framework
1. Australian Dollar (AUD/USD)
Bullish chain:
Broad Money +4.4% YoY [data fact] → Ample liquidity supports nominal GDP growth [economic mechanism] → Potential tailwind for AUD [market implication]
Bearish chain:
RBA rate-cutting cycle [assumption] → Narrowing AUD-USD interest rate differential [economic mechanism] → Reduced carry appeal for AUD [market implication]
Net assessment: These two forces are in tension. The net direction for AUD cannot be determined from monetary data alone. The RBA’s forward guidance and the Fed’s policy path are equally important inputs.
2. Australian Equities (ASX 200)
Chain:
Sustained Broad Money expansion [data fact] → Money supply growth is generally associated with asset price appreciation [general economic principle] → Suggests resilience in ASX equities [market implication]
Note: The link between money supply and equity prices is a general principle that does not always hold in the short term. This data point is one supportive factor among many.
3. RBA Policy Path
Chain:
Broad Money accelerating to +4.4% YoY [data fact] → Excess liquidity may increase inflationary pressure over time [economic mechanism, general principle] → May narrow RBA’s room for further rate cuts [market implication]
Critical caveat: The relationship between money supply growth and consumer price inflation is notoriously unstable in the short run. This data point alone is insufficient to predict RBA policy. The next CPI print is the decisive input.
Scenario Matrix
| Scenario | Trigger | AUD | ASX | RBA |
|---|---|---|---|---|
| Bull | CPI continues to moderate | Supported | Upside | Cuts continue |
| Neutral | CPI stable | Range-bound | Sideways | Pause |
| Bear | CPI re-accelerates | Downside | Correction | Pivot to hike |
Key Data to Watch
- Next Australia CPI release: Confirms whether liquidity expansion is translating into price pressures
- Next RBA policy meeting: Rate cut continuation vs pause decision
- Next RBA D3 (June 2026 data): Whether Broad Money acceleration is sustained
Disclaimer: This article is for informational purposes only. All investment decisions are made solely at your own risk.