📺 Watch the Full Video Analysis
This article was automatically generated by the NFC Market Live AI analysis system. (Updated: 2026-06-27 07:09 JST)
📄 Primary Source
米国労働省(DOL)— 新規失業保険申請件数
https://www.dol.gov/newsroom/releases/eta/eta20260625
米国エネルギー情報局(EIA)— 週間石油状況レポート
https://www.eia.gov/petroleum/supply/weekly/pdf/highlights.pdf
連邦準備制度理事会(FRB)— H.4.1 バランスシート
https://www.federalreserve.gov/releases/h41/current/h41.htm
This week’s US macro triple: Initial jobless claims plunged to 215K (best in months), crude oil inventories fell 6.1M barrels to 7% below the 5-year average, and the Fed’s balance sheet showed a $82B drop in reserve balances as the TGA surged $38B. We break down what these three signals mean for labor markets, energy inflation, and financial system liquidity heading into Q3 2026.
今週のアルティメット・サマリー:米国経済の現在地
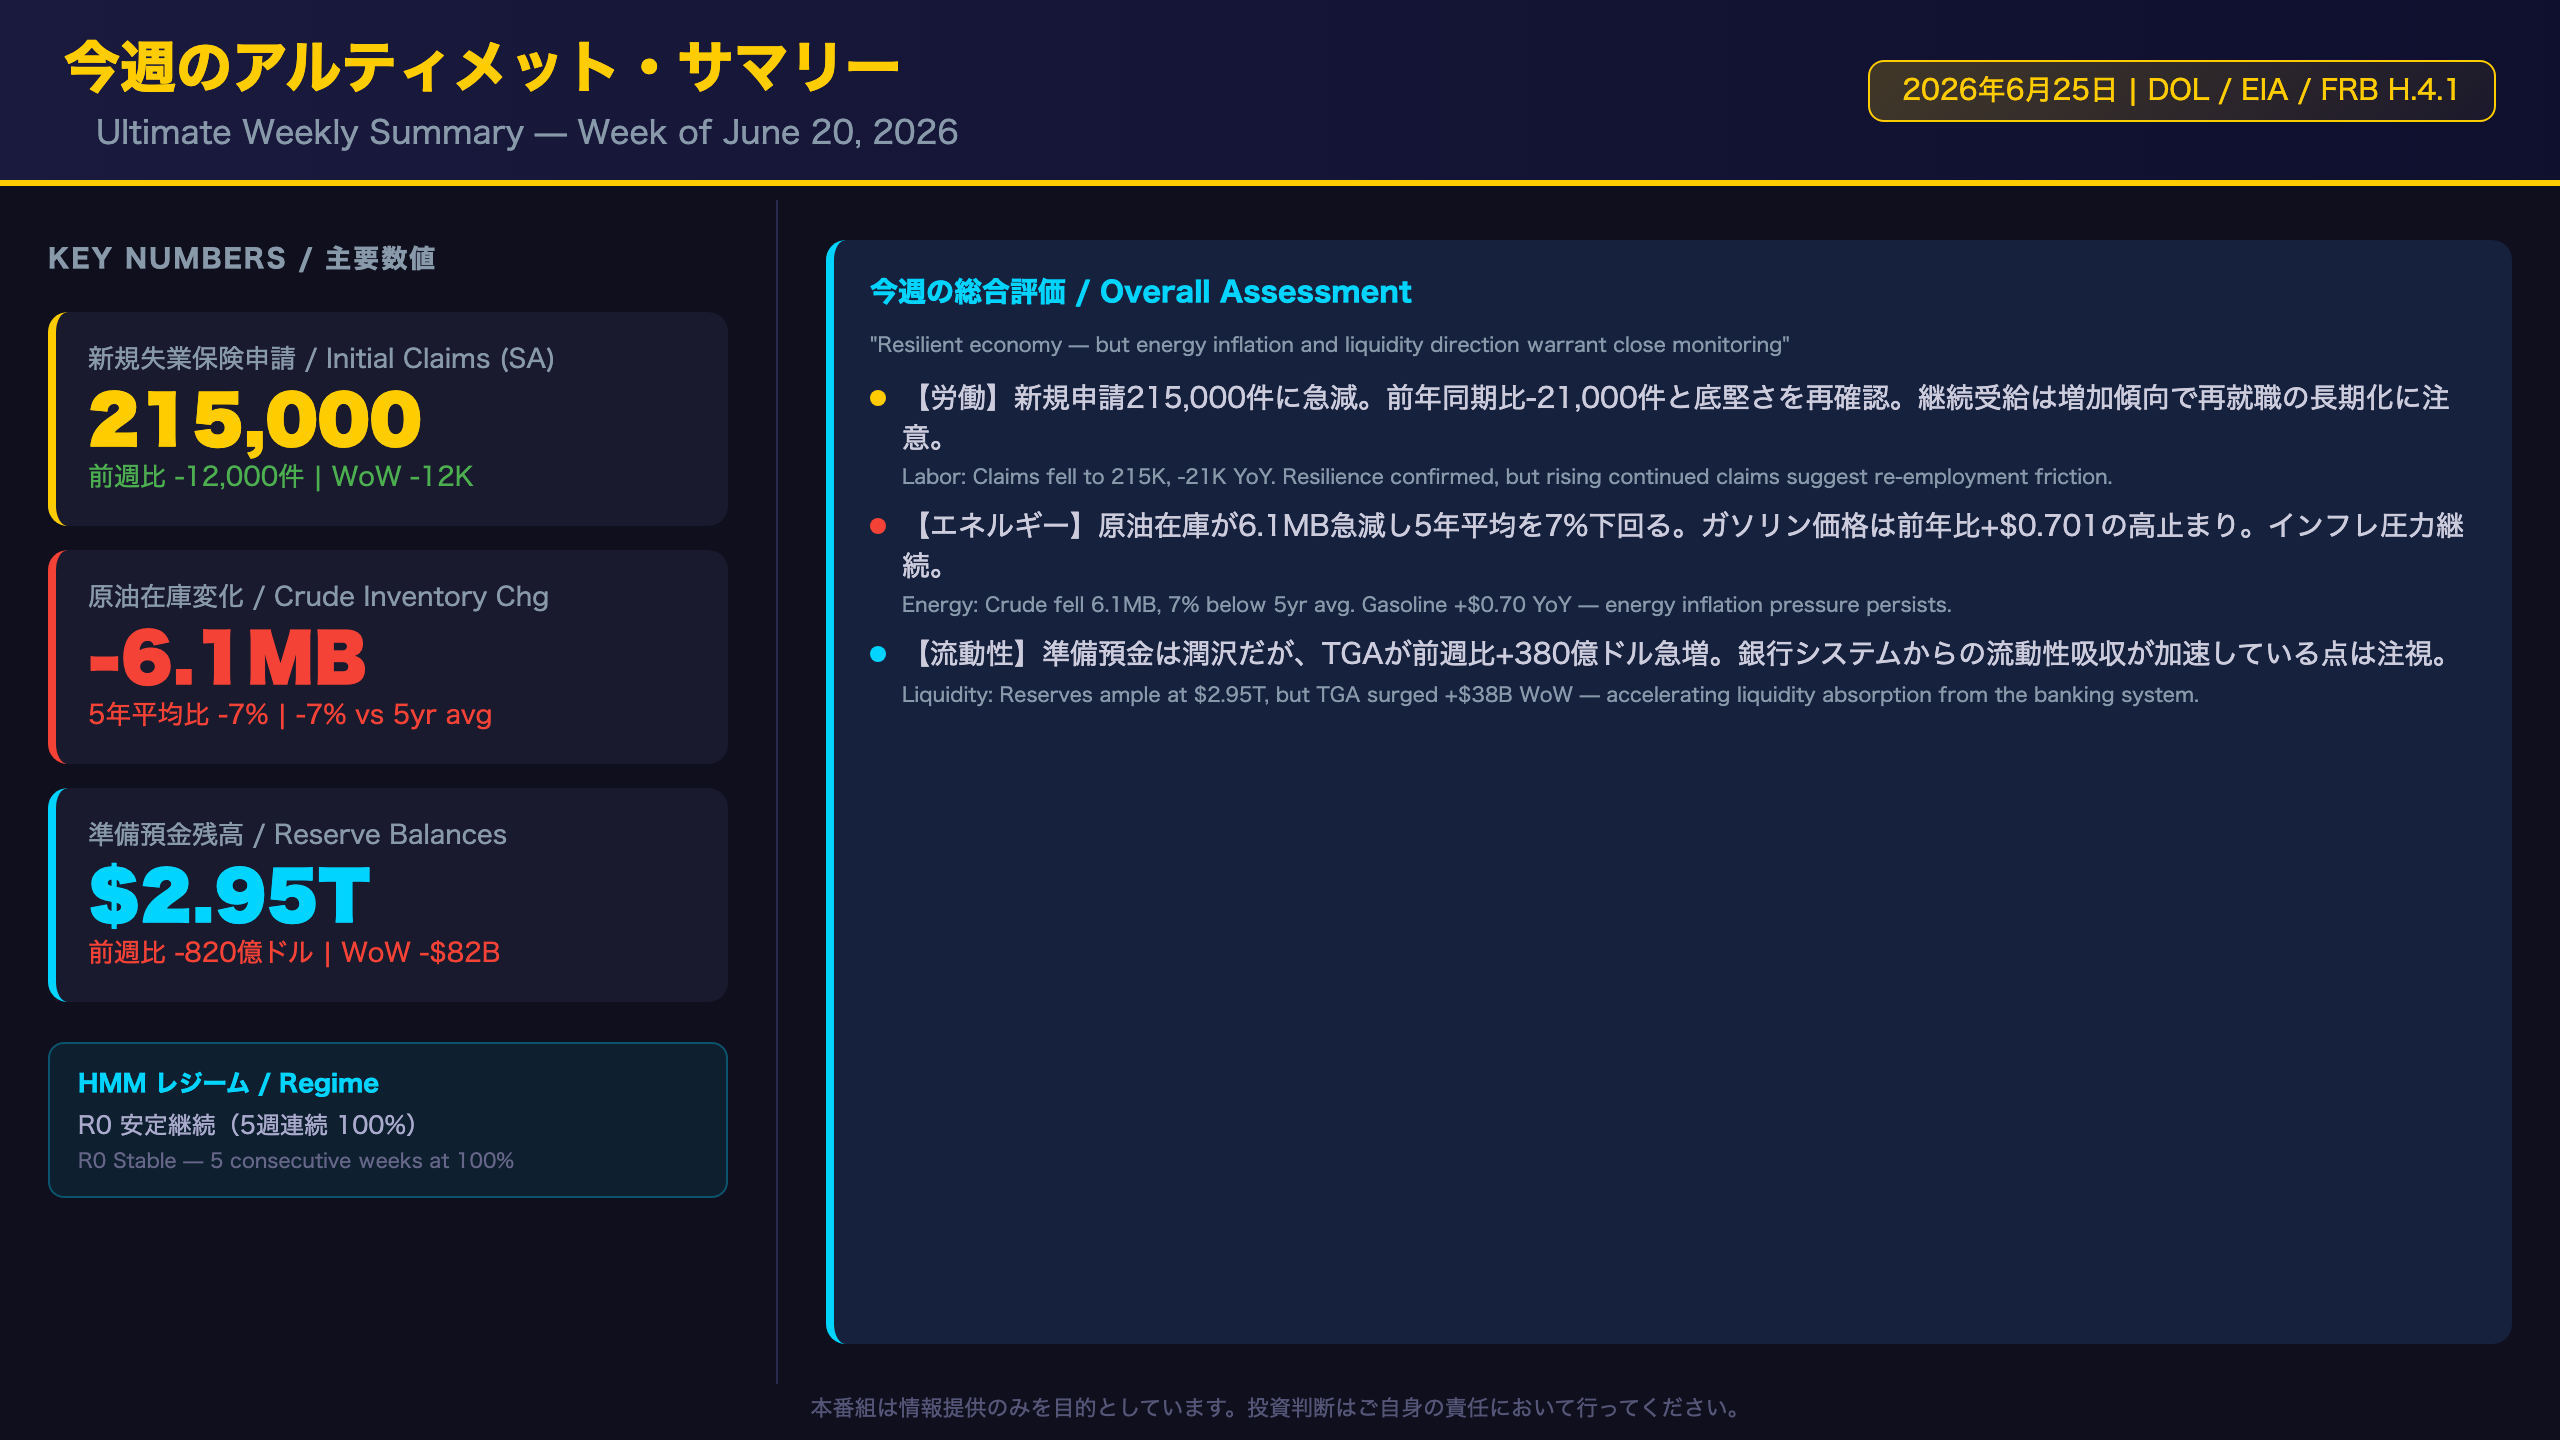
US Weekly Macro Triple: Integrated Assessment — Week of June 20, 2026
What Are These Three Reports?
Every Thursday, three key US macro data releases converge: the Department of Labor (DOL) weekly jobless claims report, the Energy Information Administration (EIA) weekly petroleum status report, and the Federal Reserve’s H.4.1 balance sheet release. Together, they provide a real-time snapshot of labor market health, energy supply/demand dynamics, and financial system liquidity.
The Week’s Verdict: Resilient but Watchful
This week’s data collectively paint a picture of a US economy that remains fundamentally sound, but with two notable pressure points — energy inflation and shifting Fed liquidity.
| Indicator | Direction | YoY Change | Signal |
|---|---|---|---|
| Initial Jobless Claims | Improved | -21,000 | Positive |
| Crude Oil Inventories | Tightened | -7% vs. 5yr avg | Cautious |
| Reserve Balances | Declined | -$418B YoY | Neutral-Cautious |
HMM Regime Context
The proprietary Hidden Markov Model (HMM) regime tracker has maintained Regime R0 at 100% probability for five consecutive weeks, with the centroid distance holding flat at 1.8918 — indicating stability within the current regime. However, anomaly detection flags energy CPI (gasoline YoY +28.4%, energy YoY +17.9%) and long-term unemployment (Z=2.28) as outliers relative to the R0 centroid, suggesting structural divergences beneath the surface calm.
Bull vs. Bear Reads
Bull case: Claims at 215K are near the cycle lows seen in late April 2026. Refinery utilization at 96.1% (vs. 93.9% a year ago) signals robust industrial activity. Reserve balances at $2.95T remain well above stress thresholds.
Bear case: Continued claims are trending higher at 1.821M, suggesting re-employment friction. Energy prices remain 70+ cents above year-ago levels, compressing real consumer purchasing power. The TGA surge of $38B in a single week is a mechanical liquidity drain that could tighten short-term funding conditions.
What to Watch Next Week
The June Non-Farm Payrolls report (expected early July) will be the critical test of whether this week’s claims drop signals genuine labor market re-acceleration or a one-week statistical anomaly.
労働市場の現在地:DOL 新規失業保険申請(6月20日週)
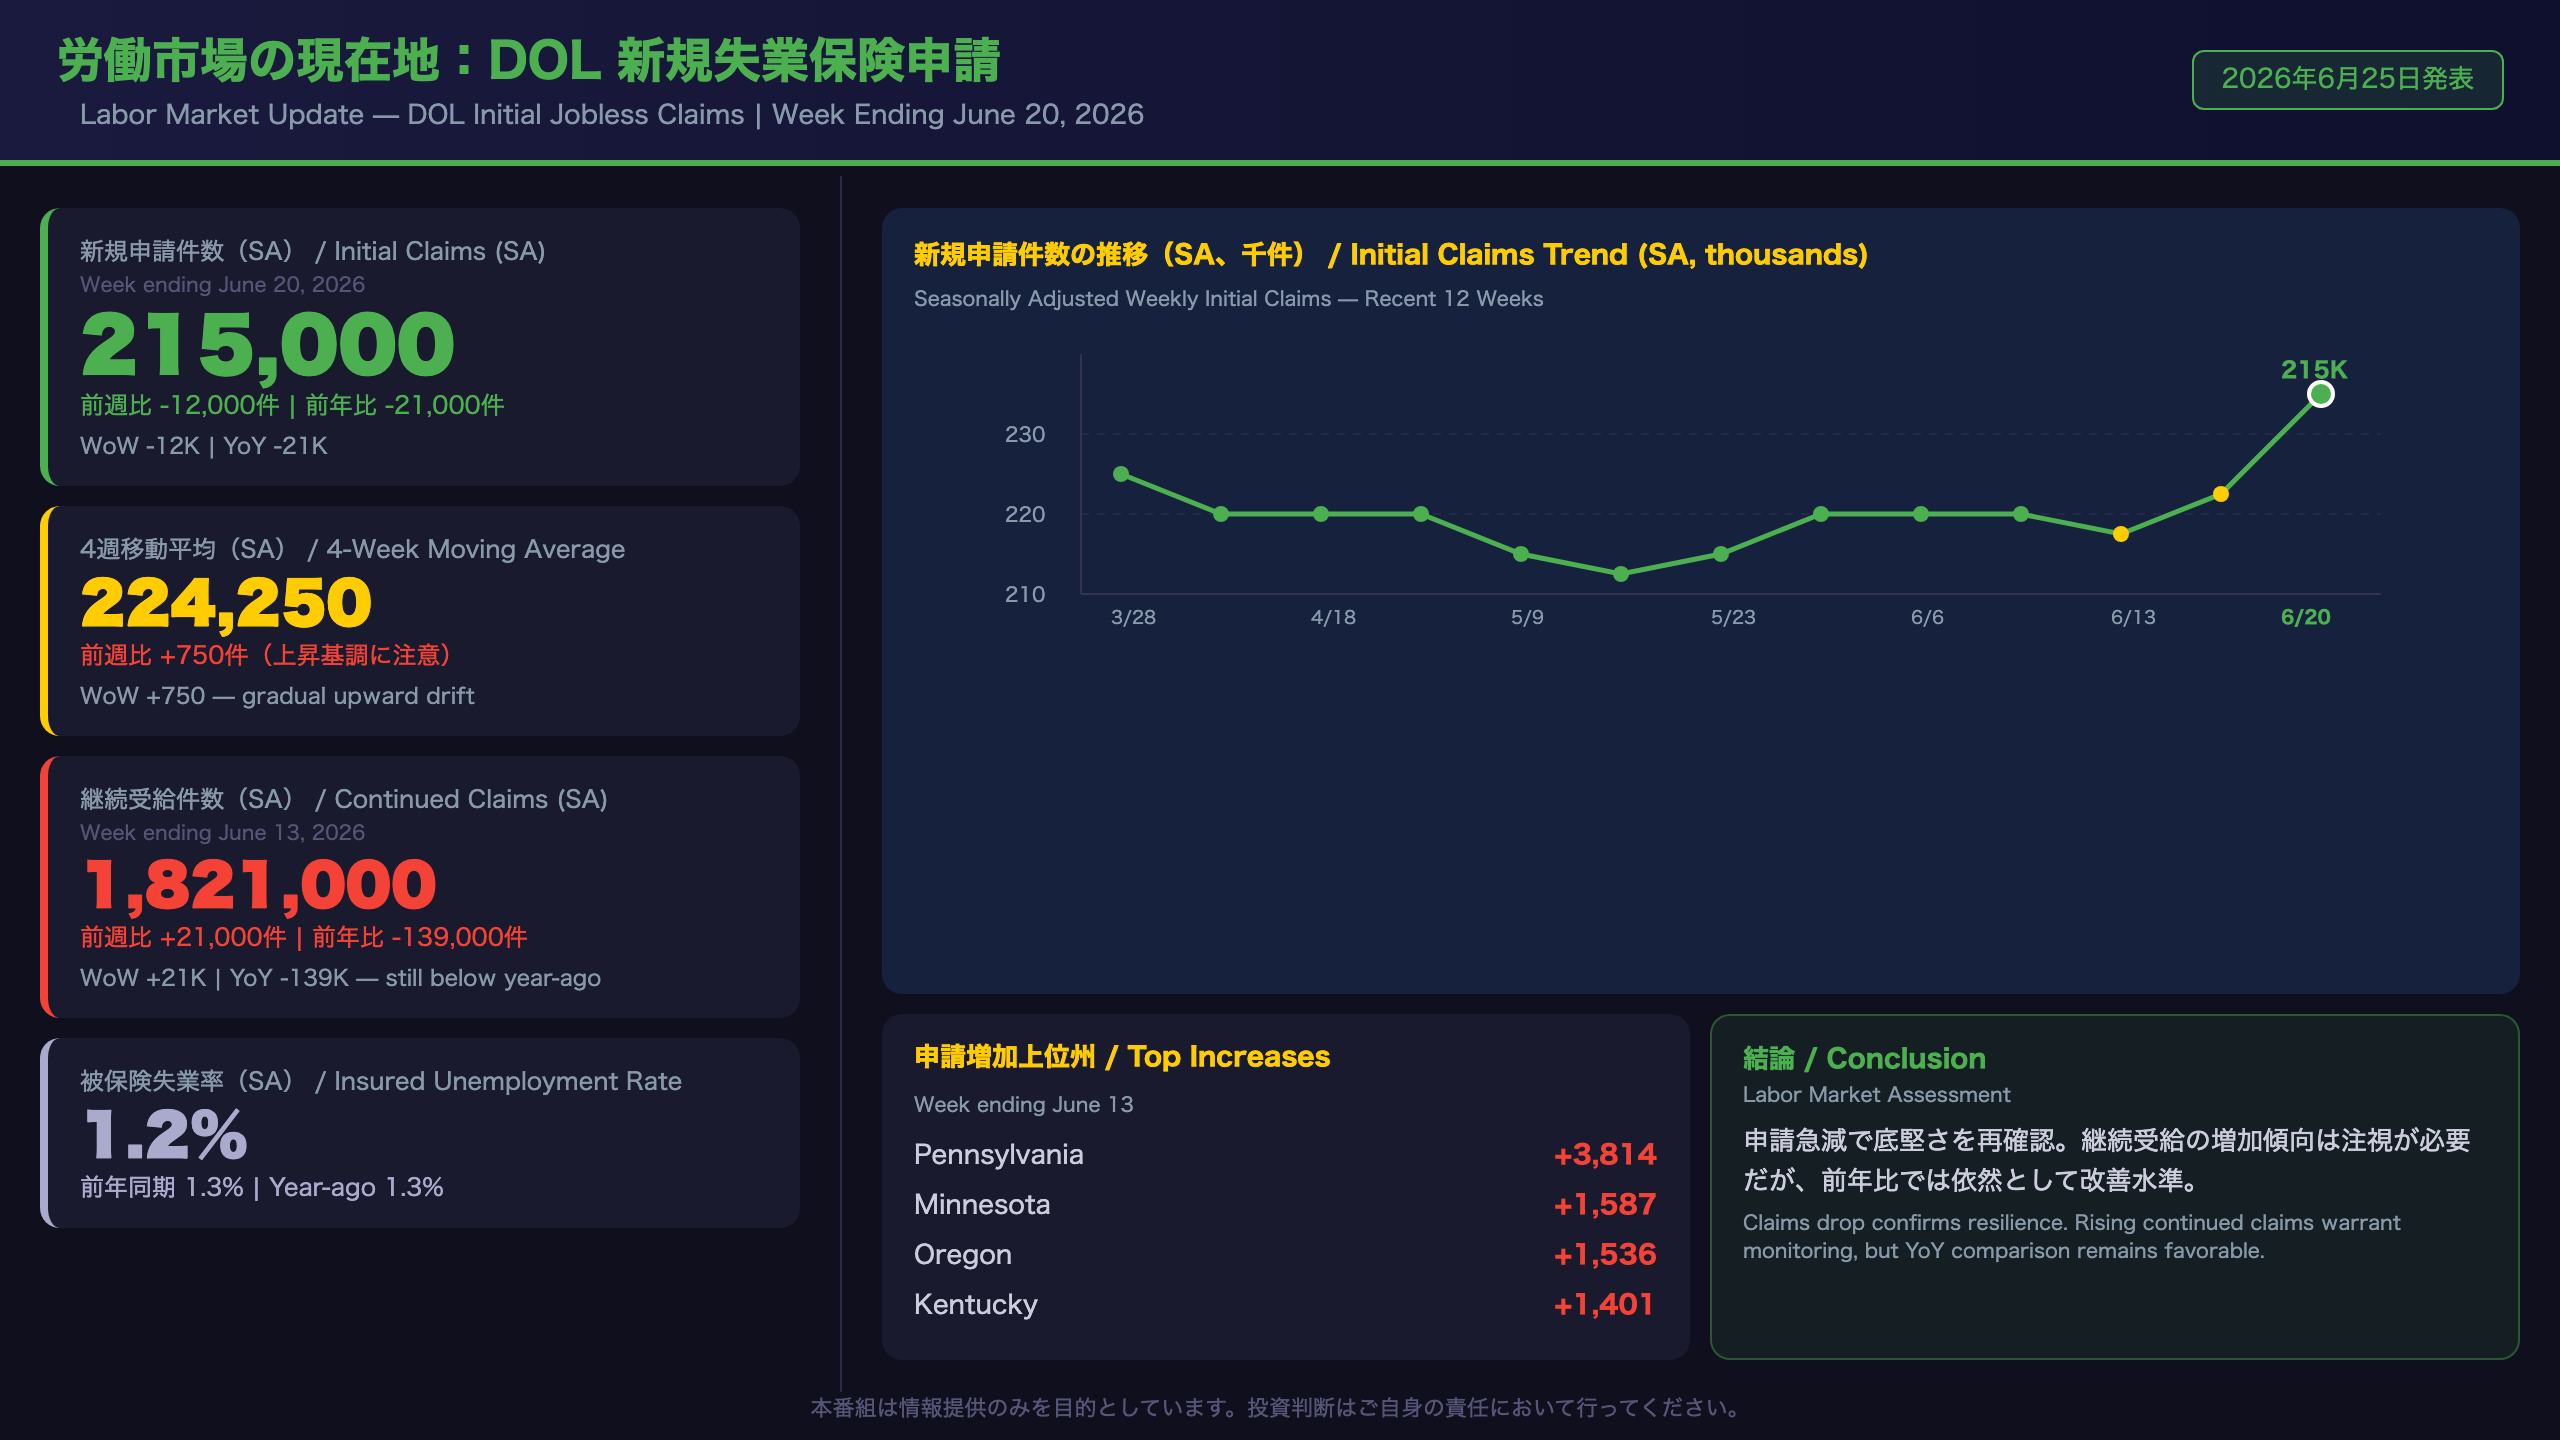
US Labor Market Deep Dive: DOL Jobless Claims — Week Ending June 20, 2026
What Is This Report?
The Department of Labor (DOL) releases weekly unemployment insurance (UI) claims data every Thursday morning. Initial claims measure the number of newly unemployed workers filing for benefits — a leading indicator of labor market conditions. Continued claims (insured unemployment) measure workers already receiving benefits, providing a coincident read on re-employment dynamics.
Key Data Points
| Metric | This Week | Prior Week (Revised) | Year Ago |
|---|---|---|---|
| Initial Claims (SA) | 215,000 | 227,000 | 236,000 |
| 4-Week MA (SA) | 224,250 | 223,500 | 242,250 |
| Continued Claims (SA) | 1,821,000 | 1,800,000 | 1,960,000 |
| Insured Unemployment Rate | 1.2% | 1.2% | 1.3% |
The Seasonal Adjustment Story
The unadjusted (NSA) figure of 207,133 fell 13,509 from the prior week — far exceeding the seasonal expectation of a 1,592-unit decline. This means the seasonally adjusted improvement is partly driven by a stronger-than-expected seasonal pattern. However, the year-over-year comparison (207,133 vs. 227,516 in 2025) confirms genuine underlying improvement.
Rising Continued Claims: Friction or Structural Shift?
The four-week moving average for continued claims has risen from 1,781,500 in late March to 1,794,500 now — a gradual but consistent upward drift. This pattern, where initial claims remain low but continued claims rise, can indicate re-employment friction: workers are not losing jobs at an elevated rate, but those who do are taking longer to find new positions. This is consistent with the HMM anomaly flag on long-term unemployed (Z=2.28 above R0 centroid).
State-Level Highlights
Pennsylvania (+3,814) reported layoffs in transportation, warehousing, and food services — sectors sensitive to trade and consumer spending. Minnesota (+1,587) and Oregon (+1,536) saw increases in educational services, likely reflecting end-of-school-year seasonal patterns rather than structural deterioration.
Bottom Line for Investors
The labor market remains firm. The 215K print is the lowest since late April 2026 and well below the year-ago trend. For Fed watchers, this data alone does not provide a compelling case for near-term rate cuts — the labor market is simply not weak enough to force the Fed’s hand.
エネルギー需給の現在地:EIA 週間石油状況(6月19日週)
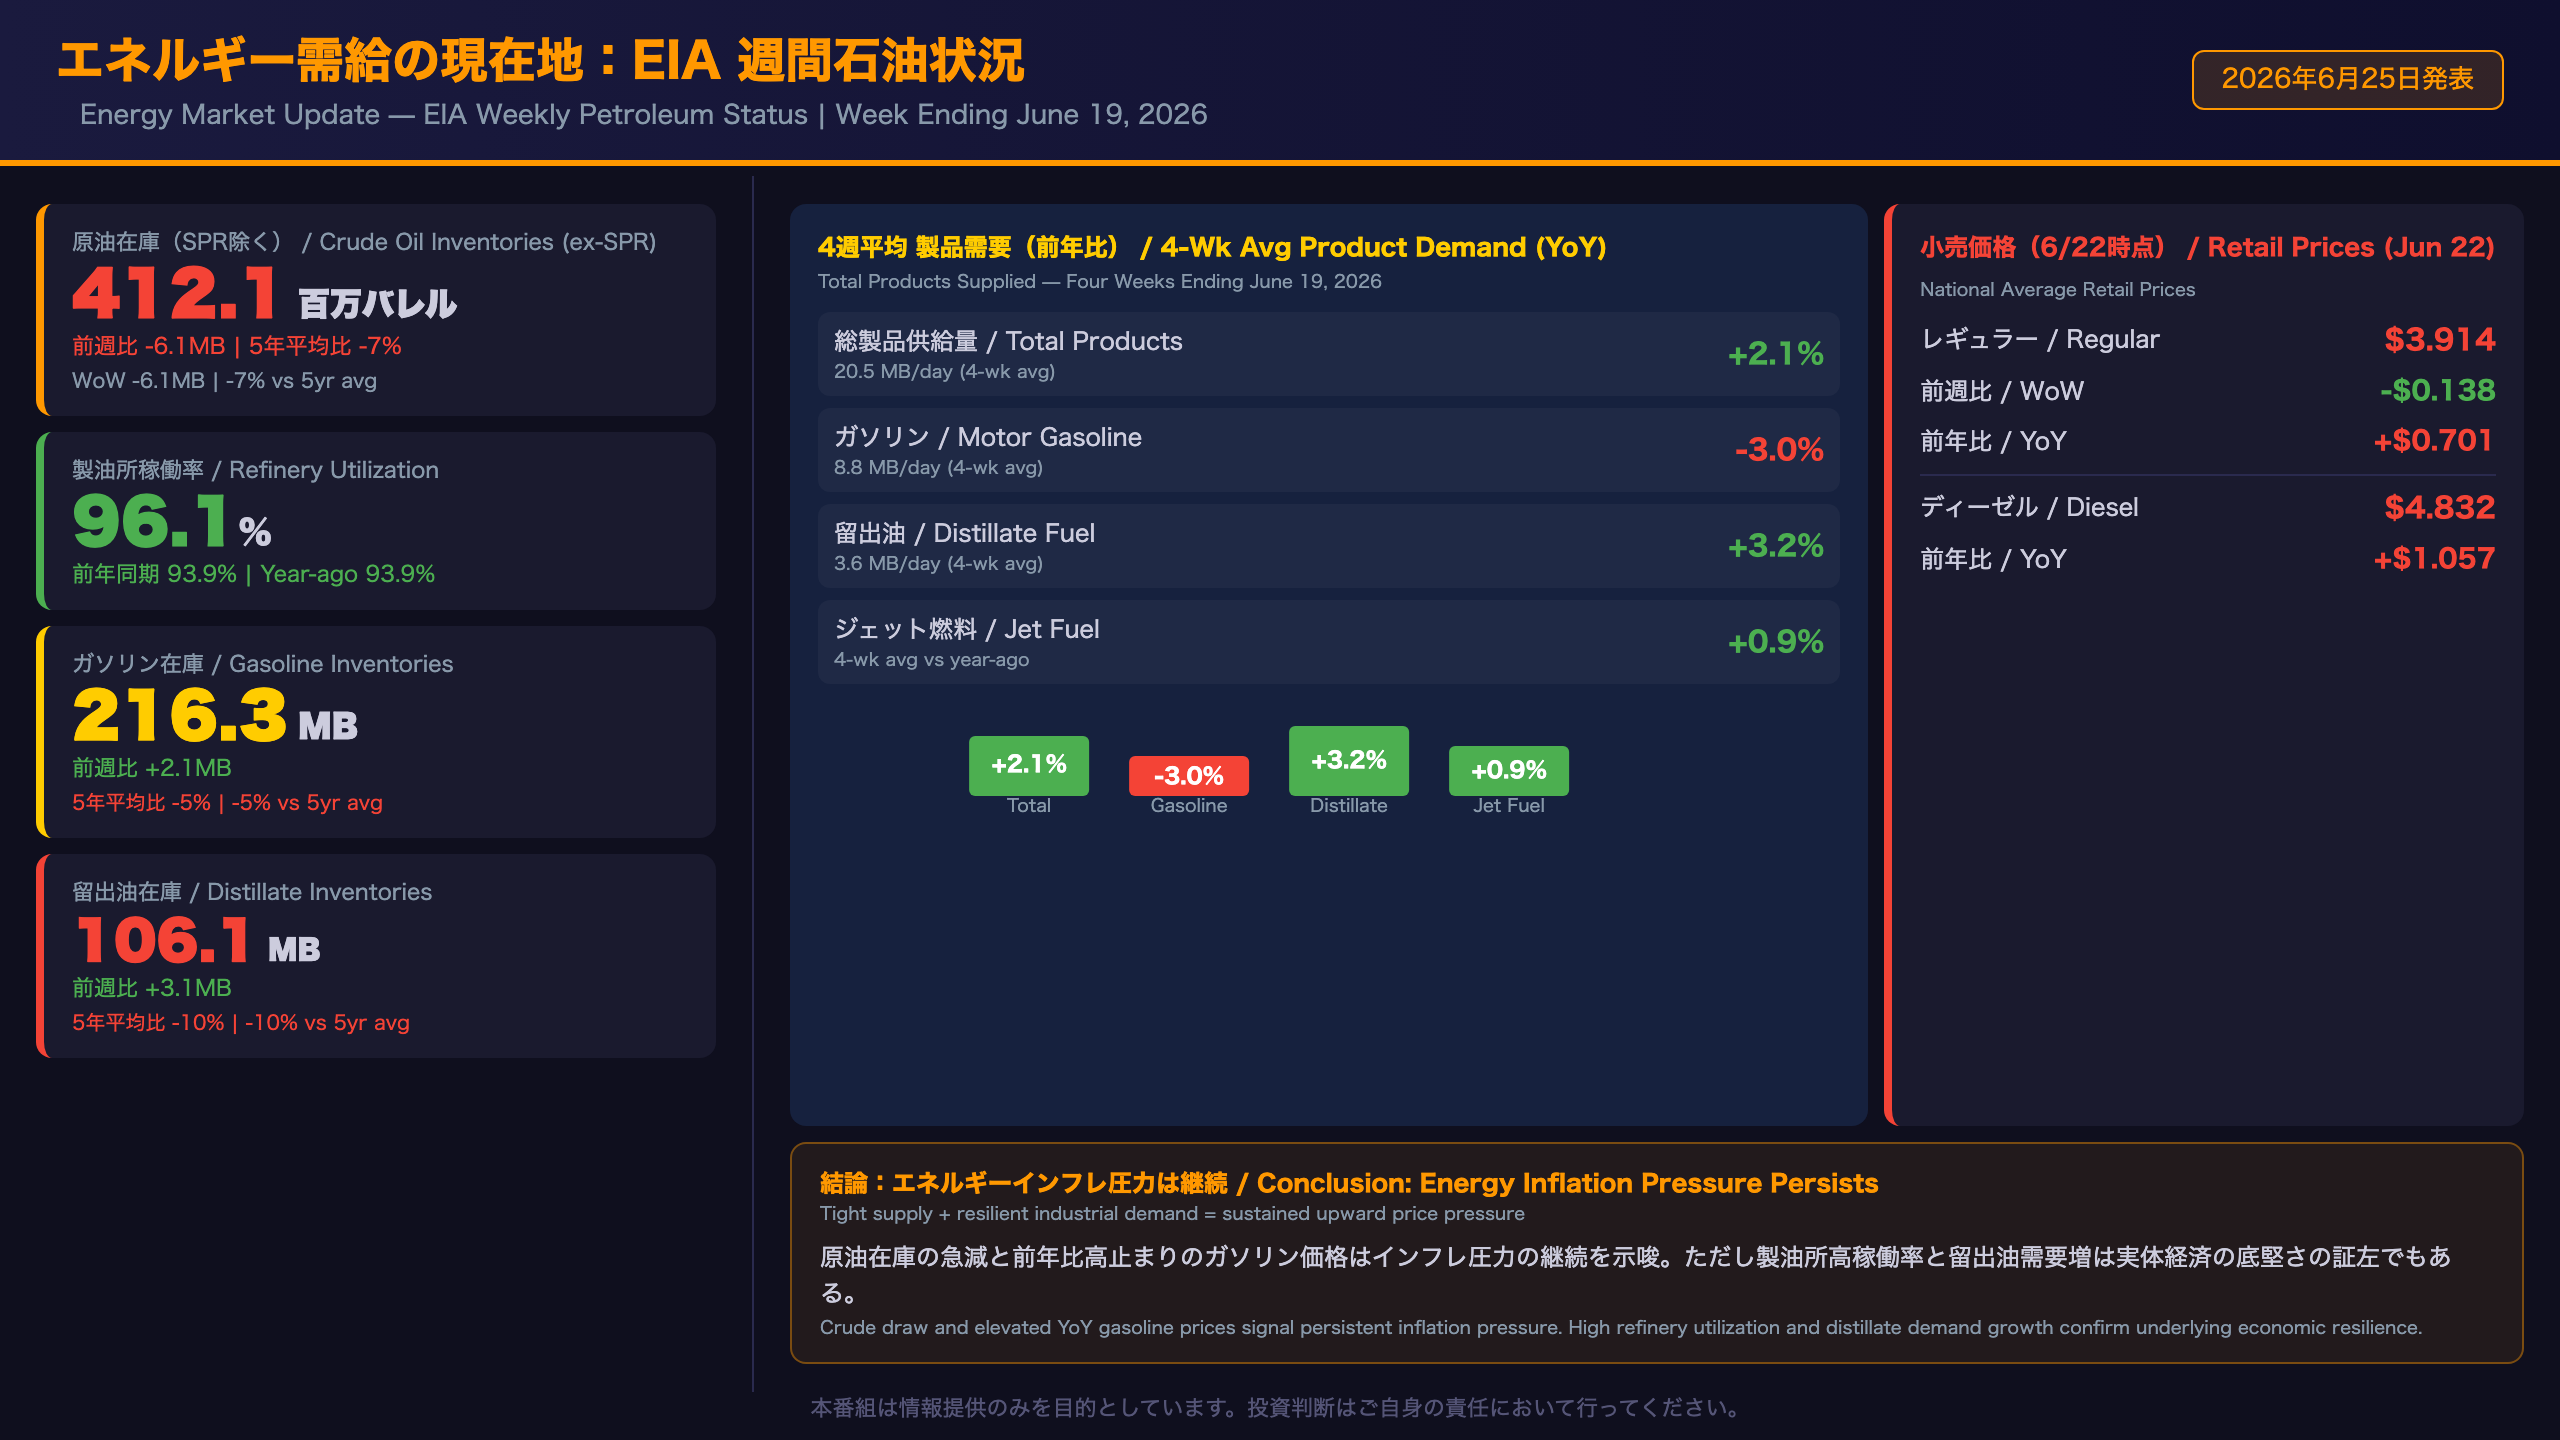
US Energy Market Deep Dive: EIA Weekly Petroleum Status — Week Ending June 19, 2026
What Is the EIA Weekly Petroleum Status Report?
The Energy Information Administration (EIA) releases its Weekly Petroleum Status Report every Wednesday, providing data on US crude oil and petroleum product inventories, refinery operations, imports, and retail prices. For macro investors, this report is a real-time gauge of energy supply/demand balance and a leading indicator of energy-driven inflation.
Inventory Snapshot
| Product | This Week (MB) | Prior Week | Year Ago | vs. 5yr Avg |
|---|---|---|---|---|
| Crude Oil (ex-SPR) | 412.1 | 418.2 | 415.1 | -7% |
| Motor Gasoline | 216.3 | 214.2 | 227.9 | -5% |
| Distillate Fuel | 106.1 | 103.1 | 105.3 | -10% |
| Propane/Propylene | Increased | — | — | +35% |
The Crude Draw: Why It Matters
The 6.1 million barrel crude draw is notable because it occurred despite a 436,000 barrel/day increase in crude imports. This means refinery demand — running at 96.1% utilization — overwhelmed the additional supply. The 7% deficit versus the five-year average is particularly significant during the summer driving season, when demand typically peaks. This structural tightness supports elevated crude prices.
Demand Bifurcation: Gasoline vs. Distillates
The four-week average product supplied data reveals a split: gasoline demand is down 3.0% year-over-year (suggesting consumer price sensitivity or EV adoption effects), while distillate fuel (diesel/heating oil) is up 3.2% YoY — a signal of robust industrial and freight activity. Jet fuel is up 0.9% YoY, consistent with continued aviation recovery.
Energy Inflation: The Fed’s Dilemma
The HMM anomaly detection flags gasoline CPI YoY at +28.4% (Z=2.86) and energy CPI YoY at +17.9% (Z=2.70) as significant outliers from the R0 regime centroid. This week’s retail gasoline price of $3.914/gallon — $0.701 above year-ago — is consistent with these elevated readings. Energy inflation at this magnitude can feed into core CPI through transportation and production costs, complicating the Fed’s path to rate cuts.
However, the week-over-week decline of $0.138/gallon in gasoline prices and $0.227/gallon in diesel prices suggests some near-term relief may be materializing.
Bottom Line
The energy picture is one of tight supply meeting resilient demand — a combination that keeps upward pressure on prices. The 10% deficit in distillate inventories versus the five-year average is particularly worth monitoring as it reflects both industrial demand strength and potential supply constraints.
FRB流動性の現在地:H.4.1 バランスシート(6月24日週)
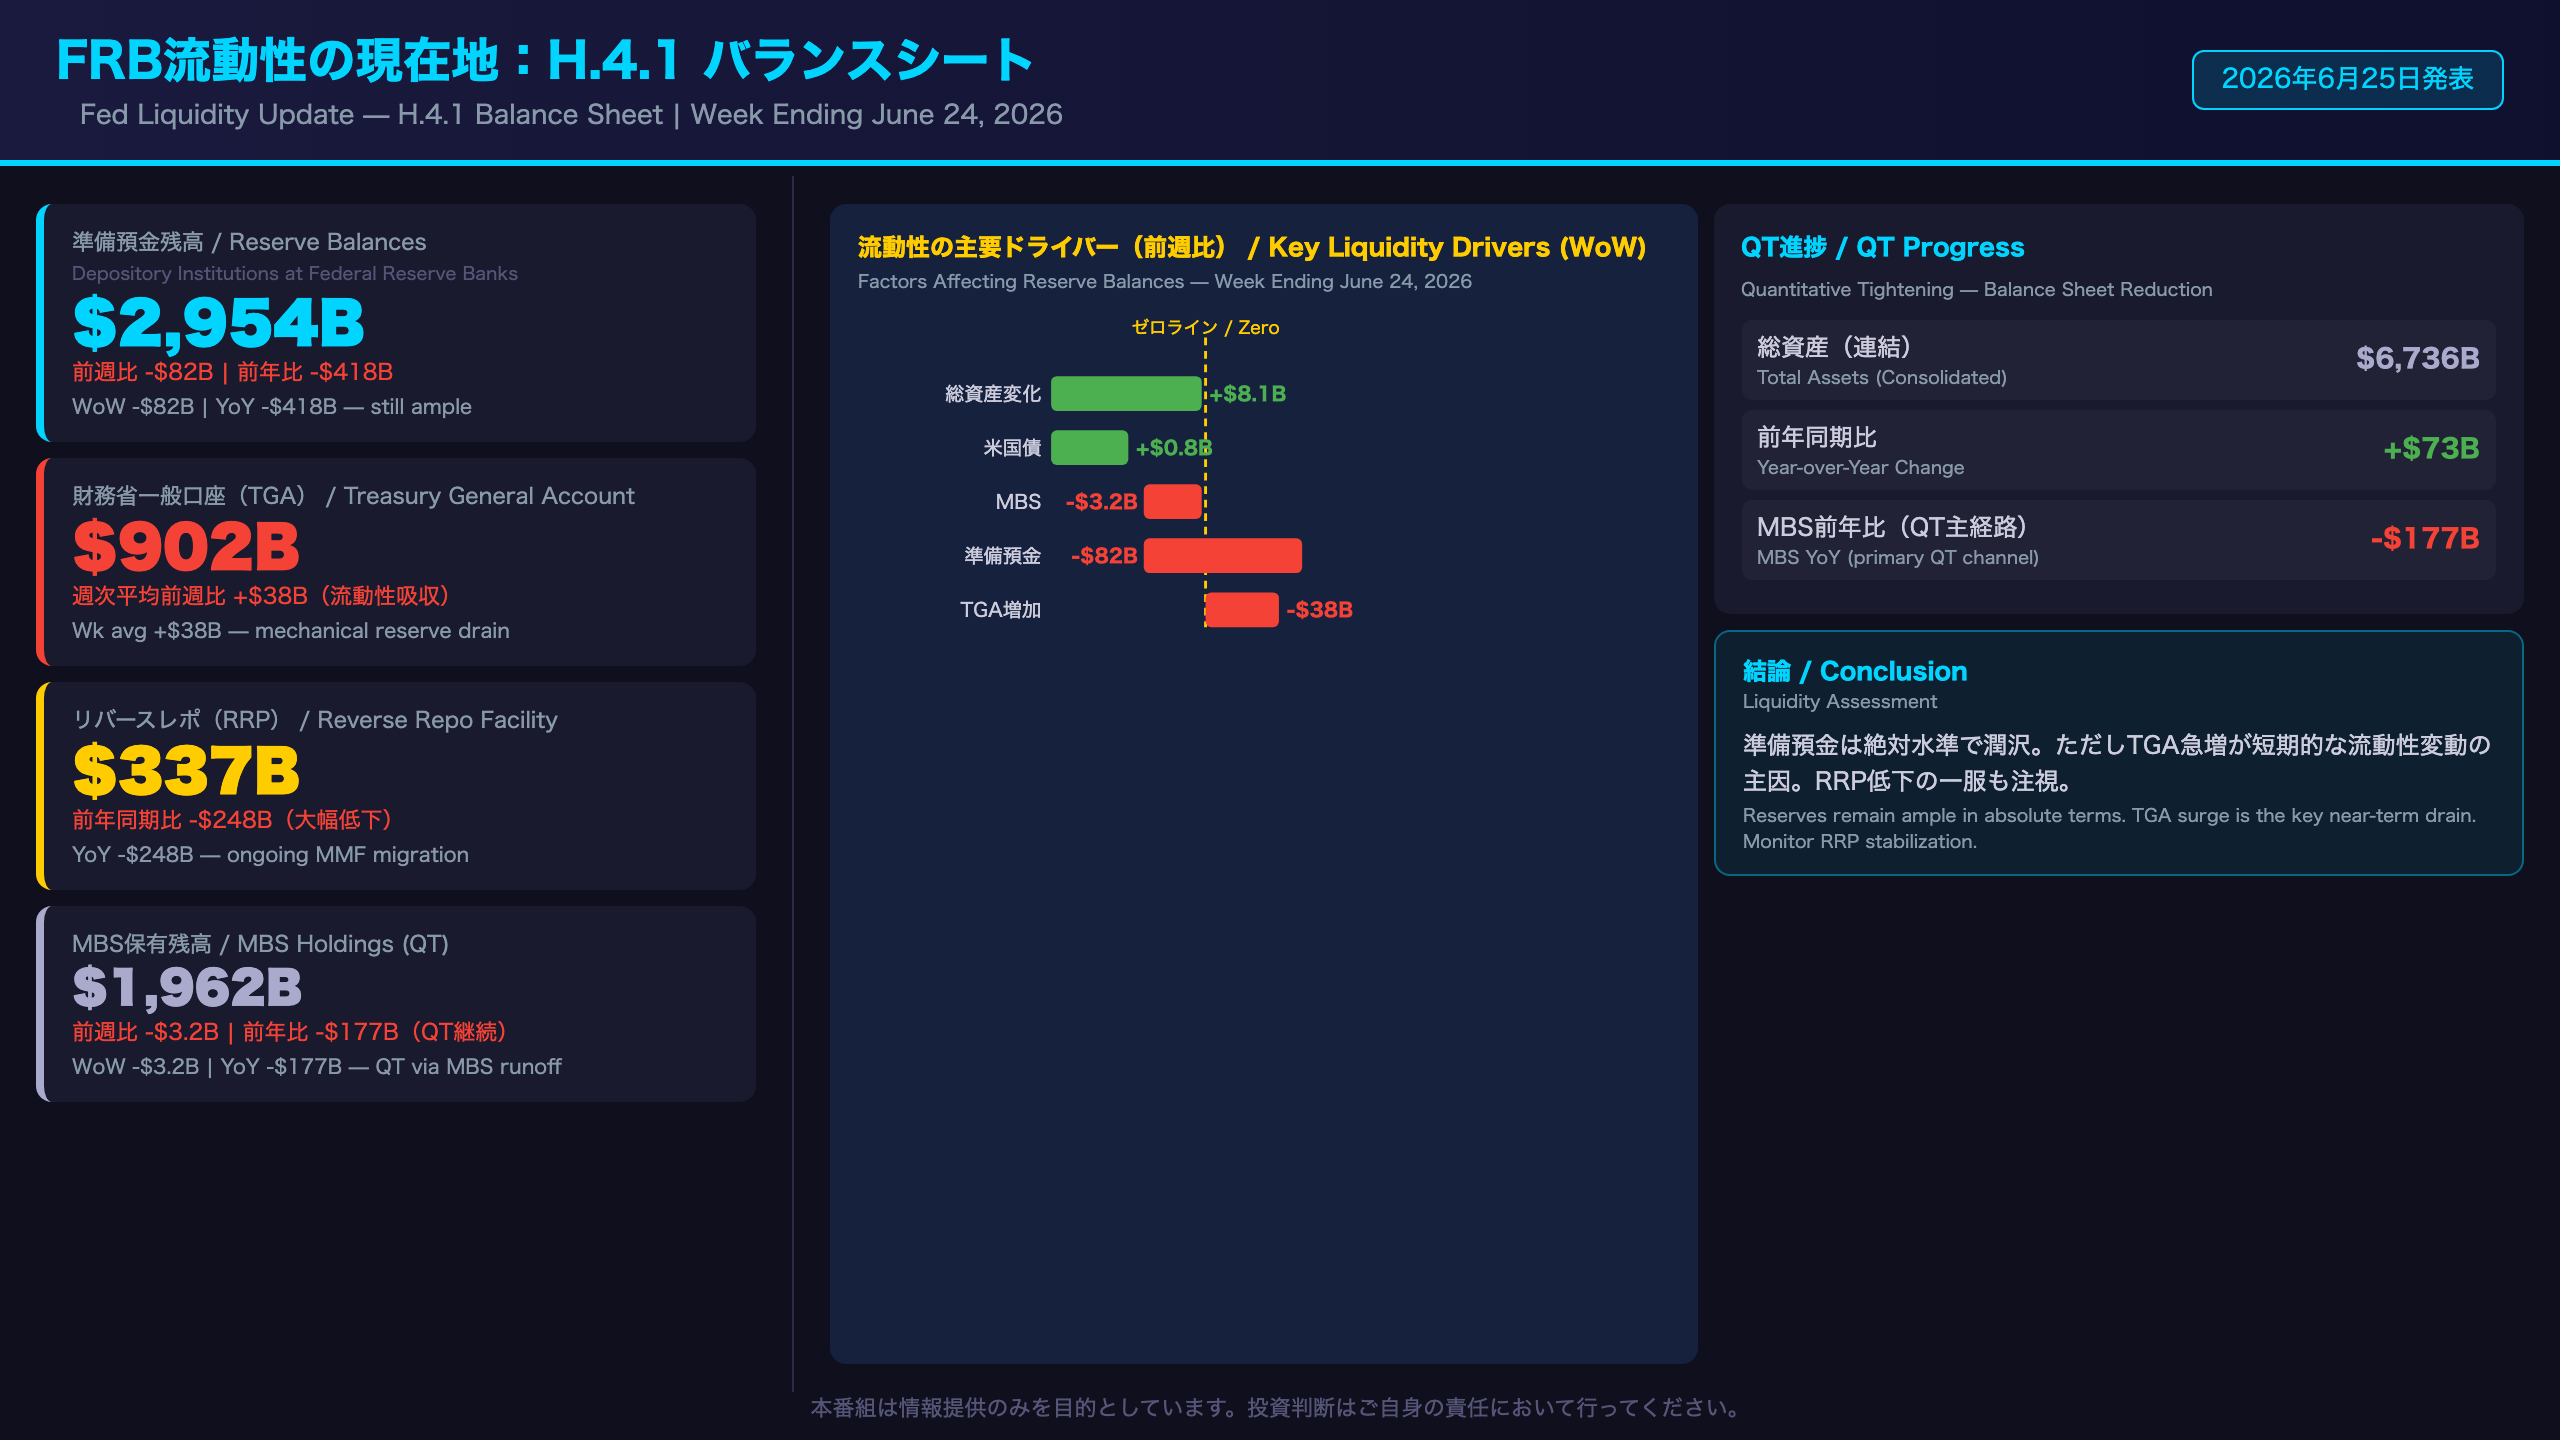
Fed Liquidity Deep Dive: H.4.1 Balance Sheet — Week Ending June 24, 2026
What Is the H.4.1 Report?
The Federal Reserve’s H.4.1 is a weekly statistical release that shows the factors affecting reserve balances of depository institutions. It is the primary source for tracking the Fed’s balance sheet size, the pace of Quantitative Tightening (QT), and the level of reserves in the banking system. For liquidity-focused investors, the H.4.1 is essential reading.
Key Balance Sheet Metrics
| Item | Jun 24, 2026 | WoW Change | YoY Change |
|---|---|---|---|
| Total Assets (Consolidated) | $6,735.6B | -$0.8B | +$73.4B |
| US Treasury Holdings | $4,488.1B | +$0.8B | +$275.5B |
| MBS Holdings | $1,961.6B | -$3.2B | -$176.9B |
| Reserve Balances | $2,954.5B | -$82.0B | -$417.9B |
| Reverse Repo (RRP) | $336.5B | +$0.9B | -$247.5B |
| Treasury General Account (TGA) | $901.8B | +$38.0B (wk avg) | +$567.3B |
QT Mechanics: MBS vs. Treasuries
The Fed’s QT is primarily running through MBS natural runoff (principal payments on mortgage-backed securities). MBS holdings are down $177 billion year-over-year, while Treasury holdings are actually up $276 billion YoY — driven by inflation compensation adjustments on TIPS, not new purchases. This asymmetry means the Fed’s effective QT pace is slower than the headline balance sheet change suggests.
Reserve Adequacy: Still Ample, But Declining
At $2.95 trillion, reserve balances remain well above the Fed’s “ample reserves” threshold. The year-over-year decline of $418 billion reflects the cumulative effect of QT. Academic research and Fed communications generally suggest that reserve stress begins to emerge when reserves fall below approximately 10-12% of nominal GDP. At current GDP levels (~$30 trillion), that threshold would be roughly $3.0-3.6 trillion — meaning reserves are approaching, but have not yet reached, the lower bound of the “ample” range.
The TGA Factor: Mechanical Liquidity Drain
The Treasury General Account (TGA) is the US government’s checking account at the Fed. When the TGA rises (as it did by ~$38B this week), it mechanically drains reserves from the banking system. The TGA’s current level of $902 billion is $567 billion above year-ago levels — a massive structural shift that has been absorbing reserves throughout 2025-2026. Investors should monitor the debt ceiling calendar and Treasury auction schedules, as TGA swings can create short-term volatility in overnight funding markets (SOFR, repo rates).
RRP Trend: The Slow Drain Continues
The Reverse Repo facility balance of $337 billion is $248 billion below year-ago levels. The RRP has been declining as money market funds shift assets into higher-yielding alternatives. This process has been a net positive for bank reserve levels, partially offsetting QT. As the RRP approaches zero, this offset will disappear, potentially accelerating the pace of reserve decline.
ストラテジスト総括:3指標の連関と来週の注目シナリオ
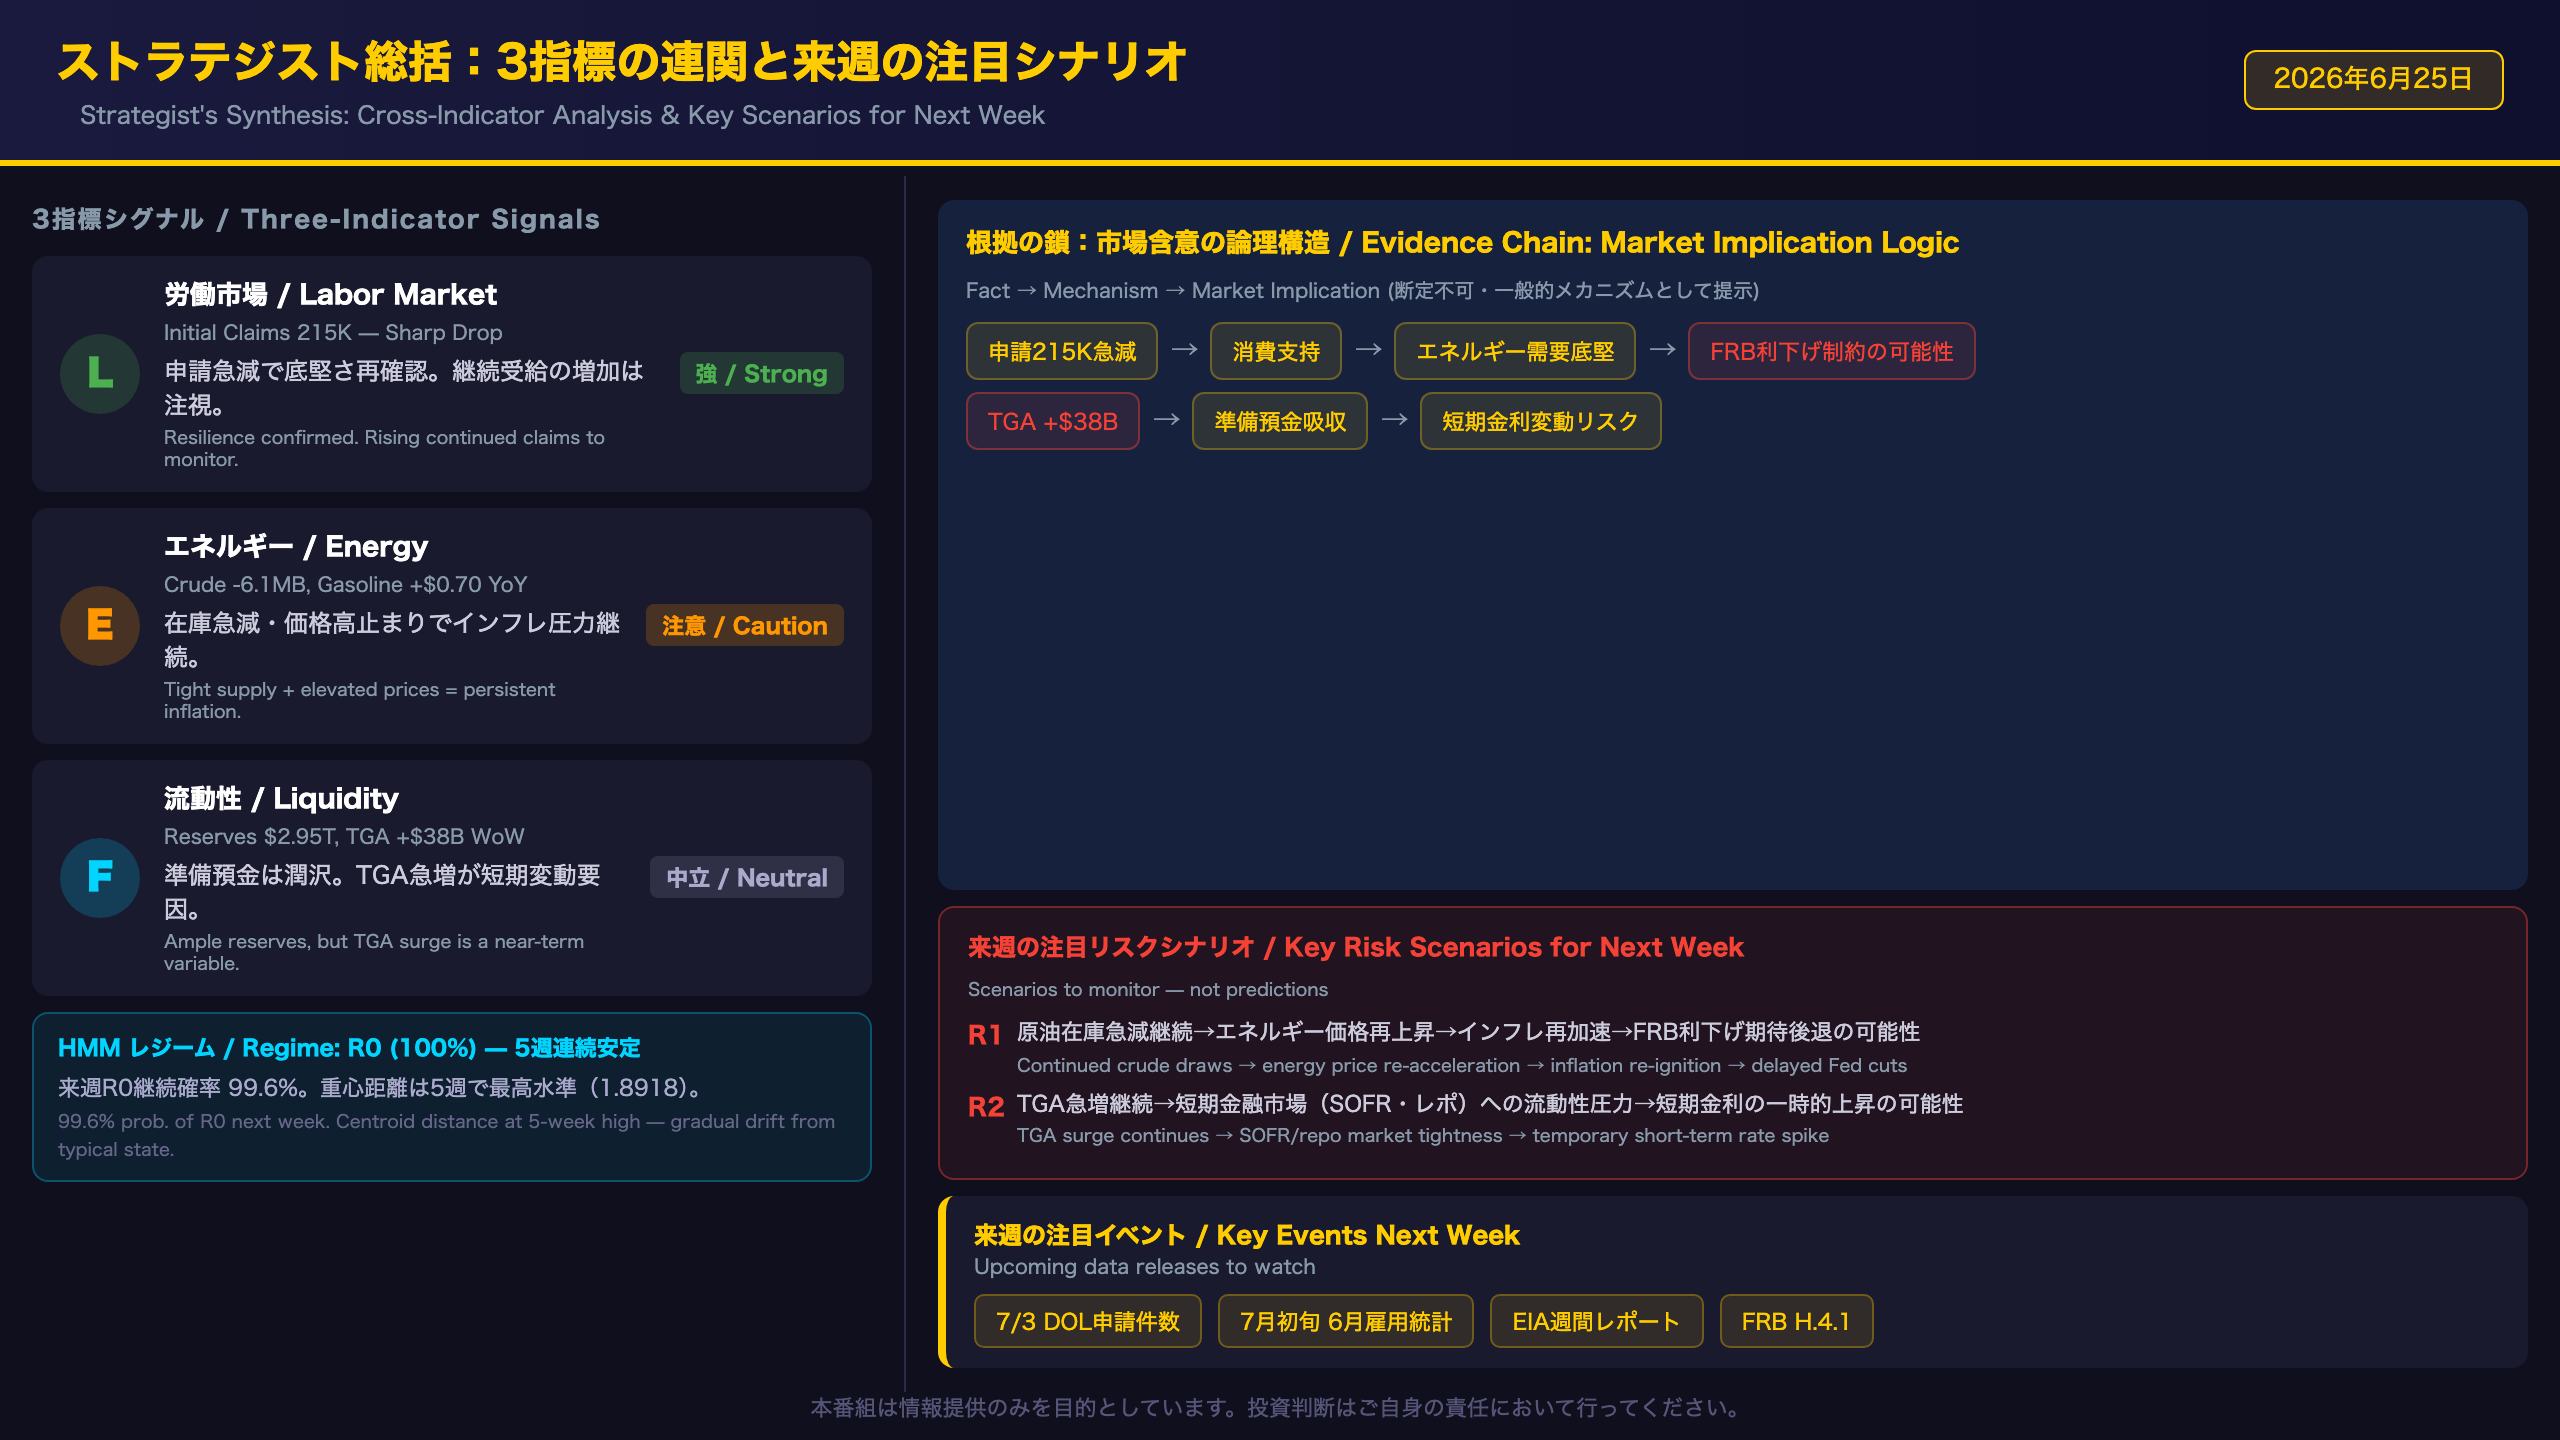
Strategist’s Synthesis: Cross-Indicator Analysis & Key Scenarios for Next Week
The Three-Indicator Dashboard
| Indicator | Direction | Fed Policy Implication | Market Implication |
|---|---|---|---|
| Labor (Claims Drop) | Positive | No urgency to cut | Mildly supportive for risk assets |
| Energy (Inventory Draw + High Prices) | Cautious | Inflation pressure persists | Upward pressure on yields; supportive for energy equities |
| Liquidity (Reserve Decline + TGA Surge) | Neutral-Cautious | Near-term funding variable | Watch short-term rates (SOFR, repo) |
The Evidence Chain: Connecting the Dots
Energy → Inflation → Fed Policy Chain:
Crude inventories 7% below 5-year average (fact) → Tight supply limits downward price pressure (mechanism) → Elevated energy CPI (+17.9% YoY per HMM anomaly data) may delay Fed rate cuts by keeping headline inflation elevated (market implication). Caveat: Energy prices are heavily influenced by geopolitical factors and OPEC+ decisions — this week’s data alone cannot confirm this chain.
TGA → Liquidity → Short-Term Rates Chain:
TGA surged +$38B week-over-week (fact) → Mechanically absorbs reserves from the banking system (mechanism) → Could create temporary tightness in overnight funding markets (SOFR, repo rates) (market implication). Caveat: With reserves at $2.95T, the banking system retains substantial buffer — stress is not imminent based on current data.
Key Events to Watch Next Week
- Thursday, July 3: DOL Initial Jobless Claims (week ending June 27)
- Will the 215K print hold, or was it a one-week anomaly?
- Early July: June Non-Farm Payrolls (BLS Employment Situation)
- The definitive test of labor market resilience
- Wednesday EIA Report: Will crude inventory draws continue?
- Thursday H.4.1: TGA trajectory and reserve balance evolution
HMM Regime Outlook
The HMM model assigns a 99.6% probability to R0 continuation next week. However, the centroid distance of 1.8918 is at its highest point in the past five weeks, indicating gradual drift away from the regime’s typical state. The persistent anomalies in energy CPI (Z=2.86 for gasoline, Z=2.70 for energy) and long-term unemployment (Z=2.28) are worth monitoring as potential early signals of regime evolution — though the probability of an imminent regime shift remains very low based on current model outputs.
Bottom Line for Investors
This week’s data does not provide a clear directional signal for markets. The labor market’s resilience is genuinely positive, but energy inflation and the TGA-driven liquidity drain introduce meaningful uncertainty. In this environment, a data-dependent, scenario-based approach — rather than a strong directional bet — appears most appropriate.
Disclaimer: This article is for informational purposes only. All investment decisions are made solely at your own risk.







