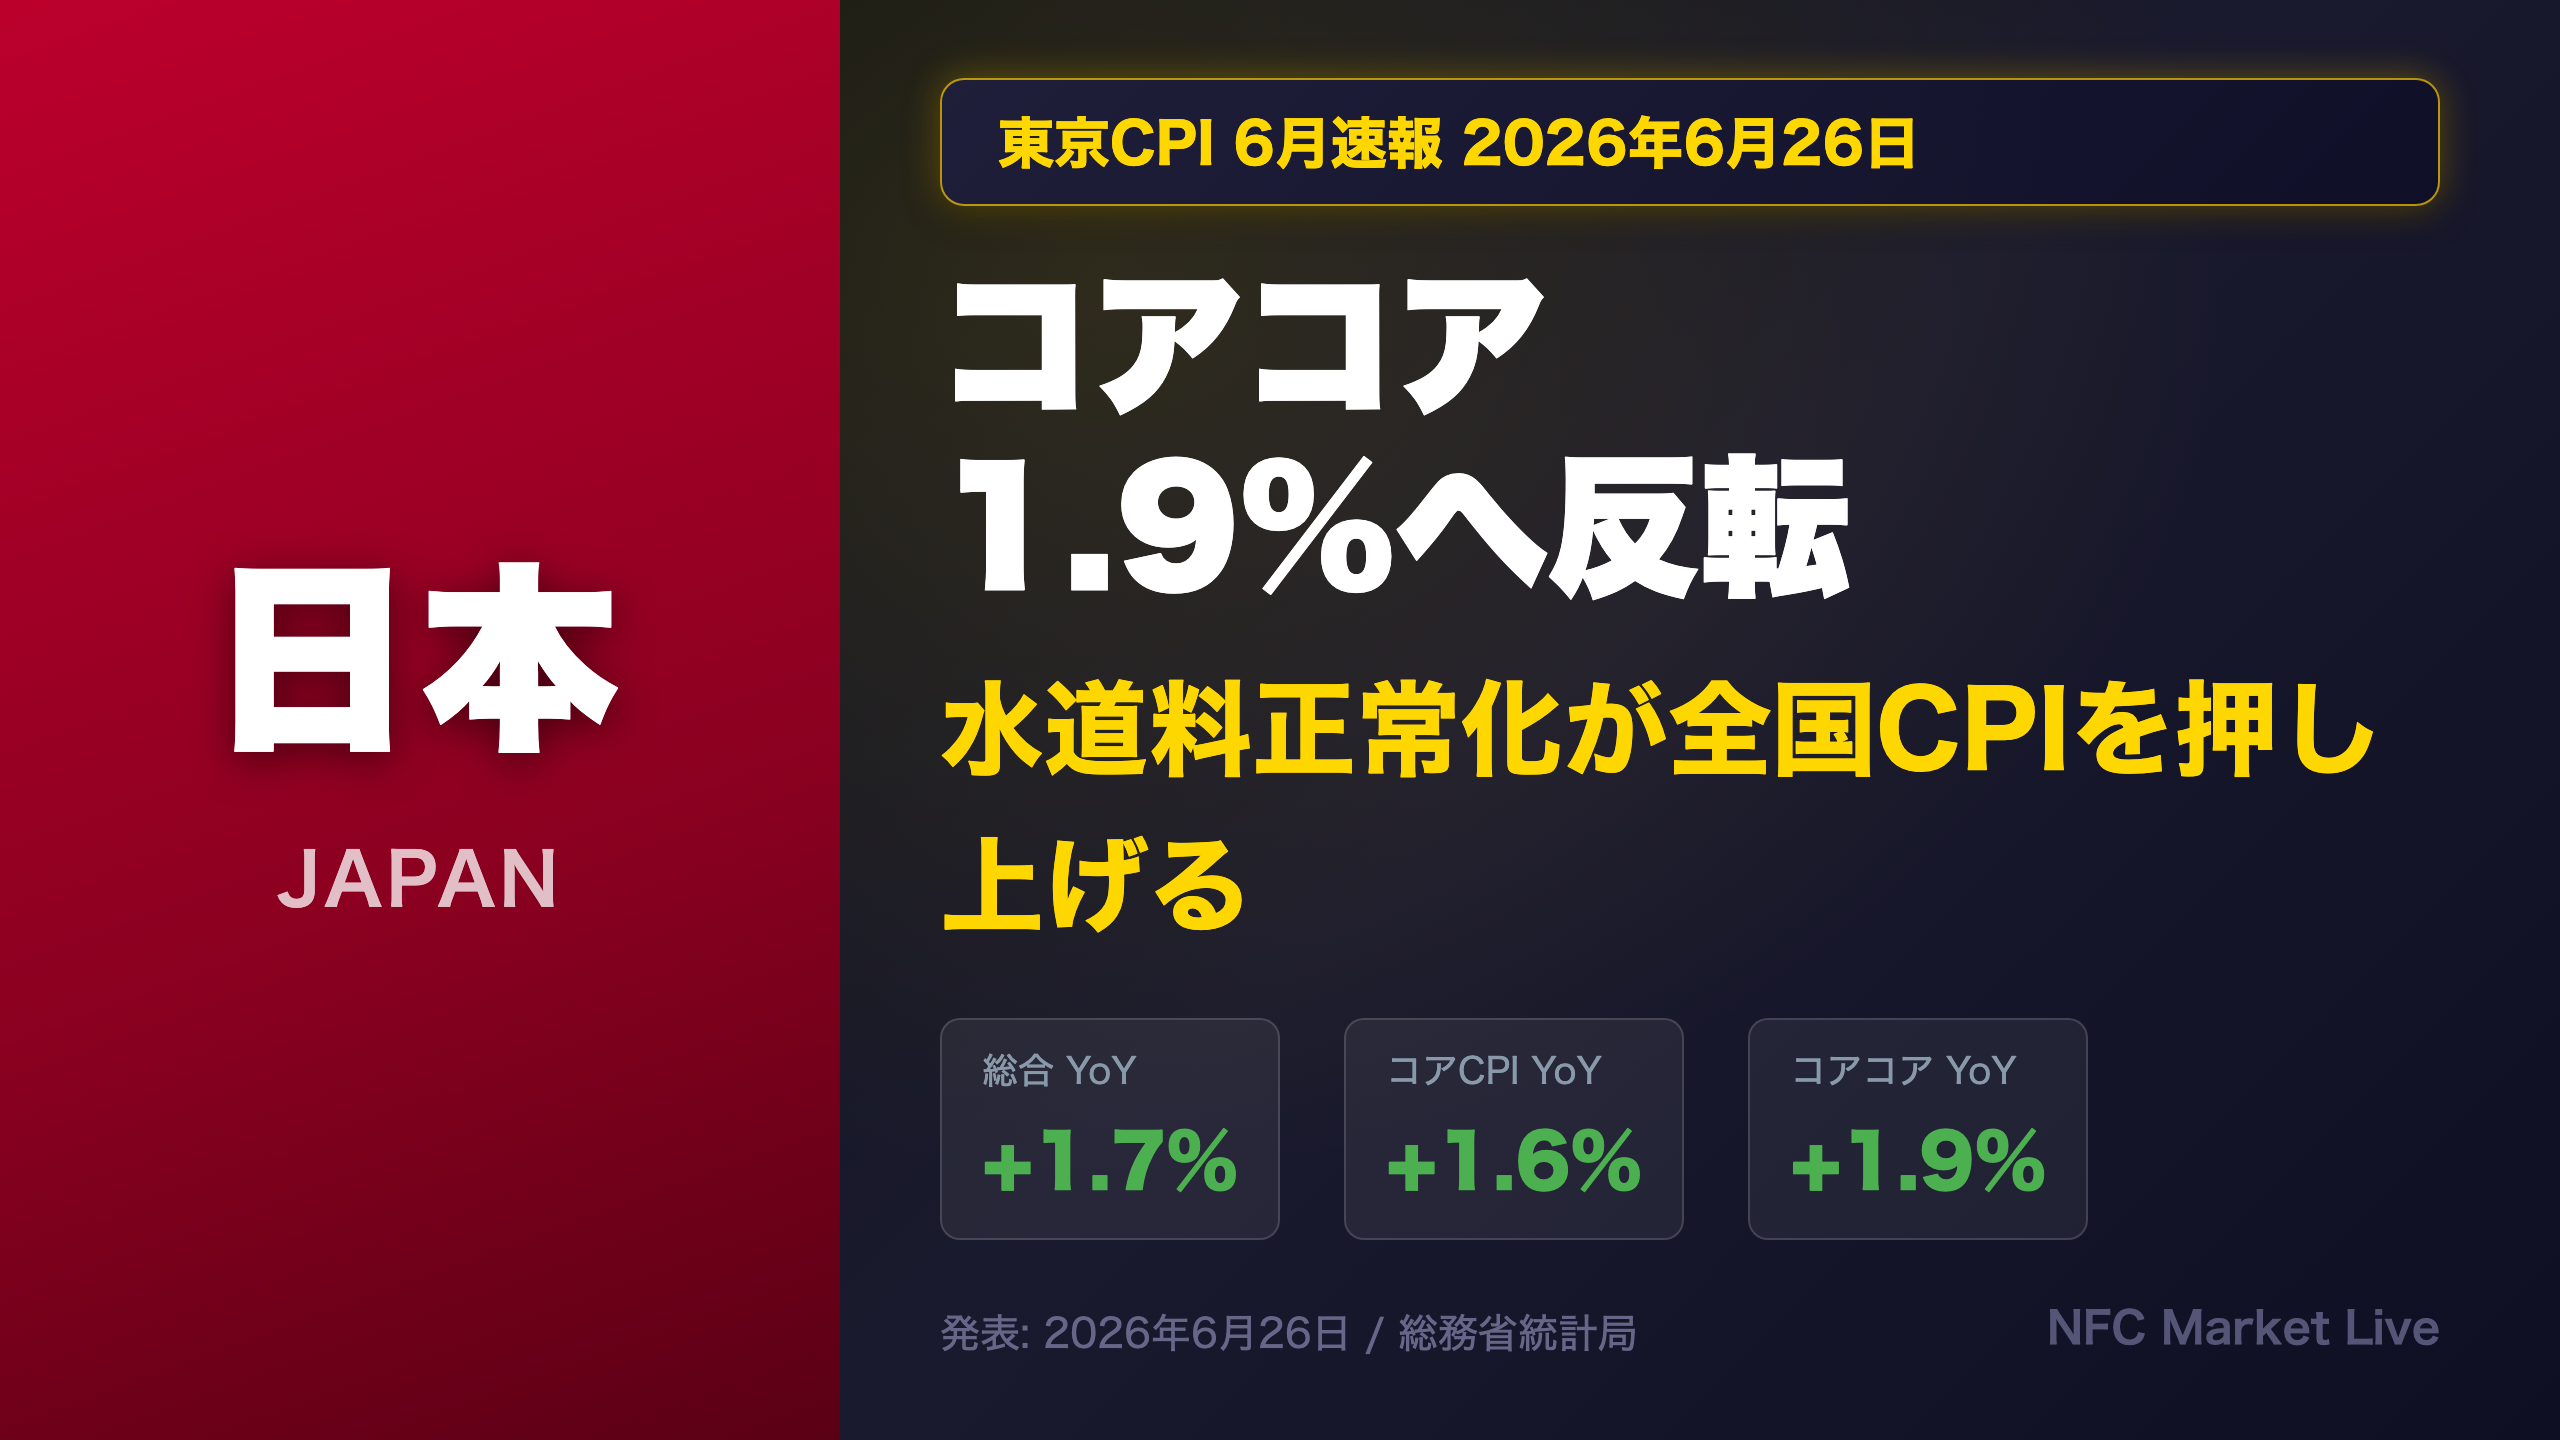
📺 Watch the Full Video Analysis
This article was automatically generated by the NFC Market Live AI analysis system. (Updated: 2026-06-26 08:39 JST)
📄 Primary Source
総務省統計局
https://www.stat.go.jp/data/cpi/sokuhou/tsuki/pdf/kubu.pdf
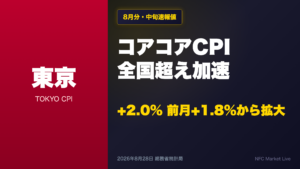
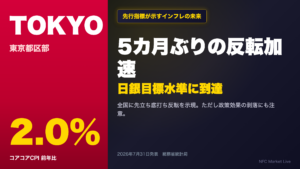
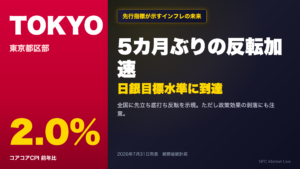
Deep dive into Tokyo CPI flash for June 2026 (released Jun 26). All three headline measures reaccelerated: CPI All +1.7%, Core +1.6%, Core-Core +1.9% YoY. The key driver: Tokyo water rates normalized to 0% YoY from -34.6% in May, adding +0.23pp to the headline. Energy drag narrowed and medical fees rose. We analyze what this means for the upcoming national CPI and BOJ rate-hike path.
The Ultimate Summary:東京CPI6月 ─ 全指標が反転加速、水道料正常化が全国CPIを揺らす
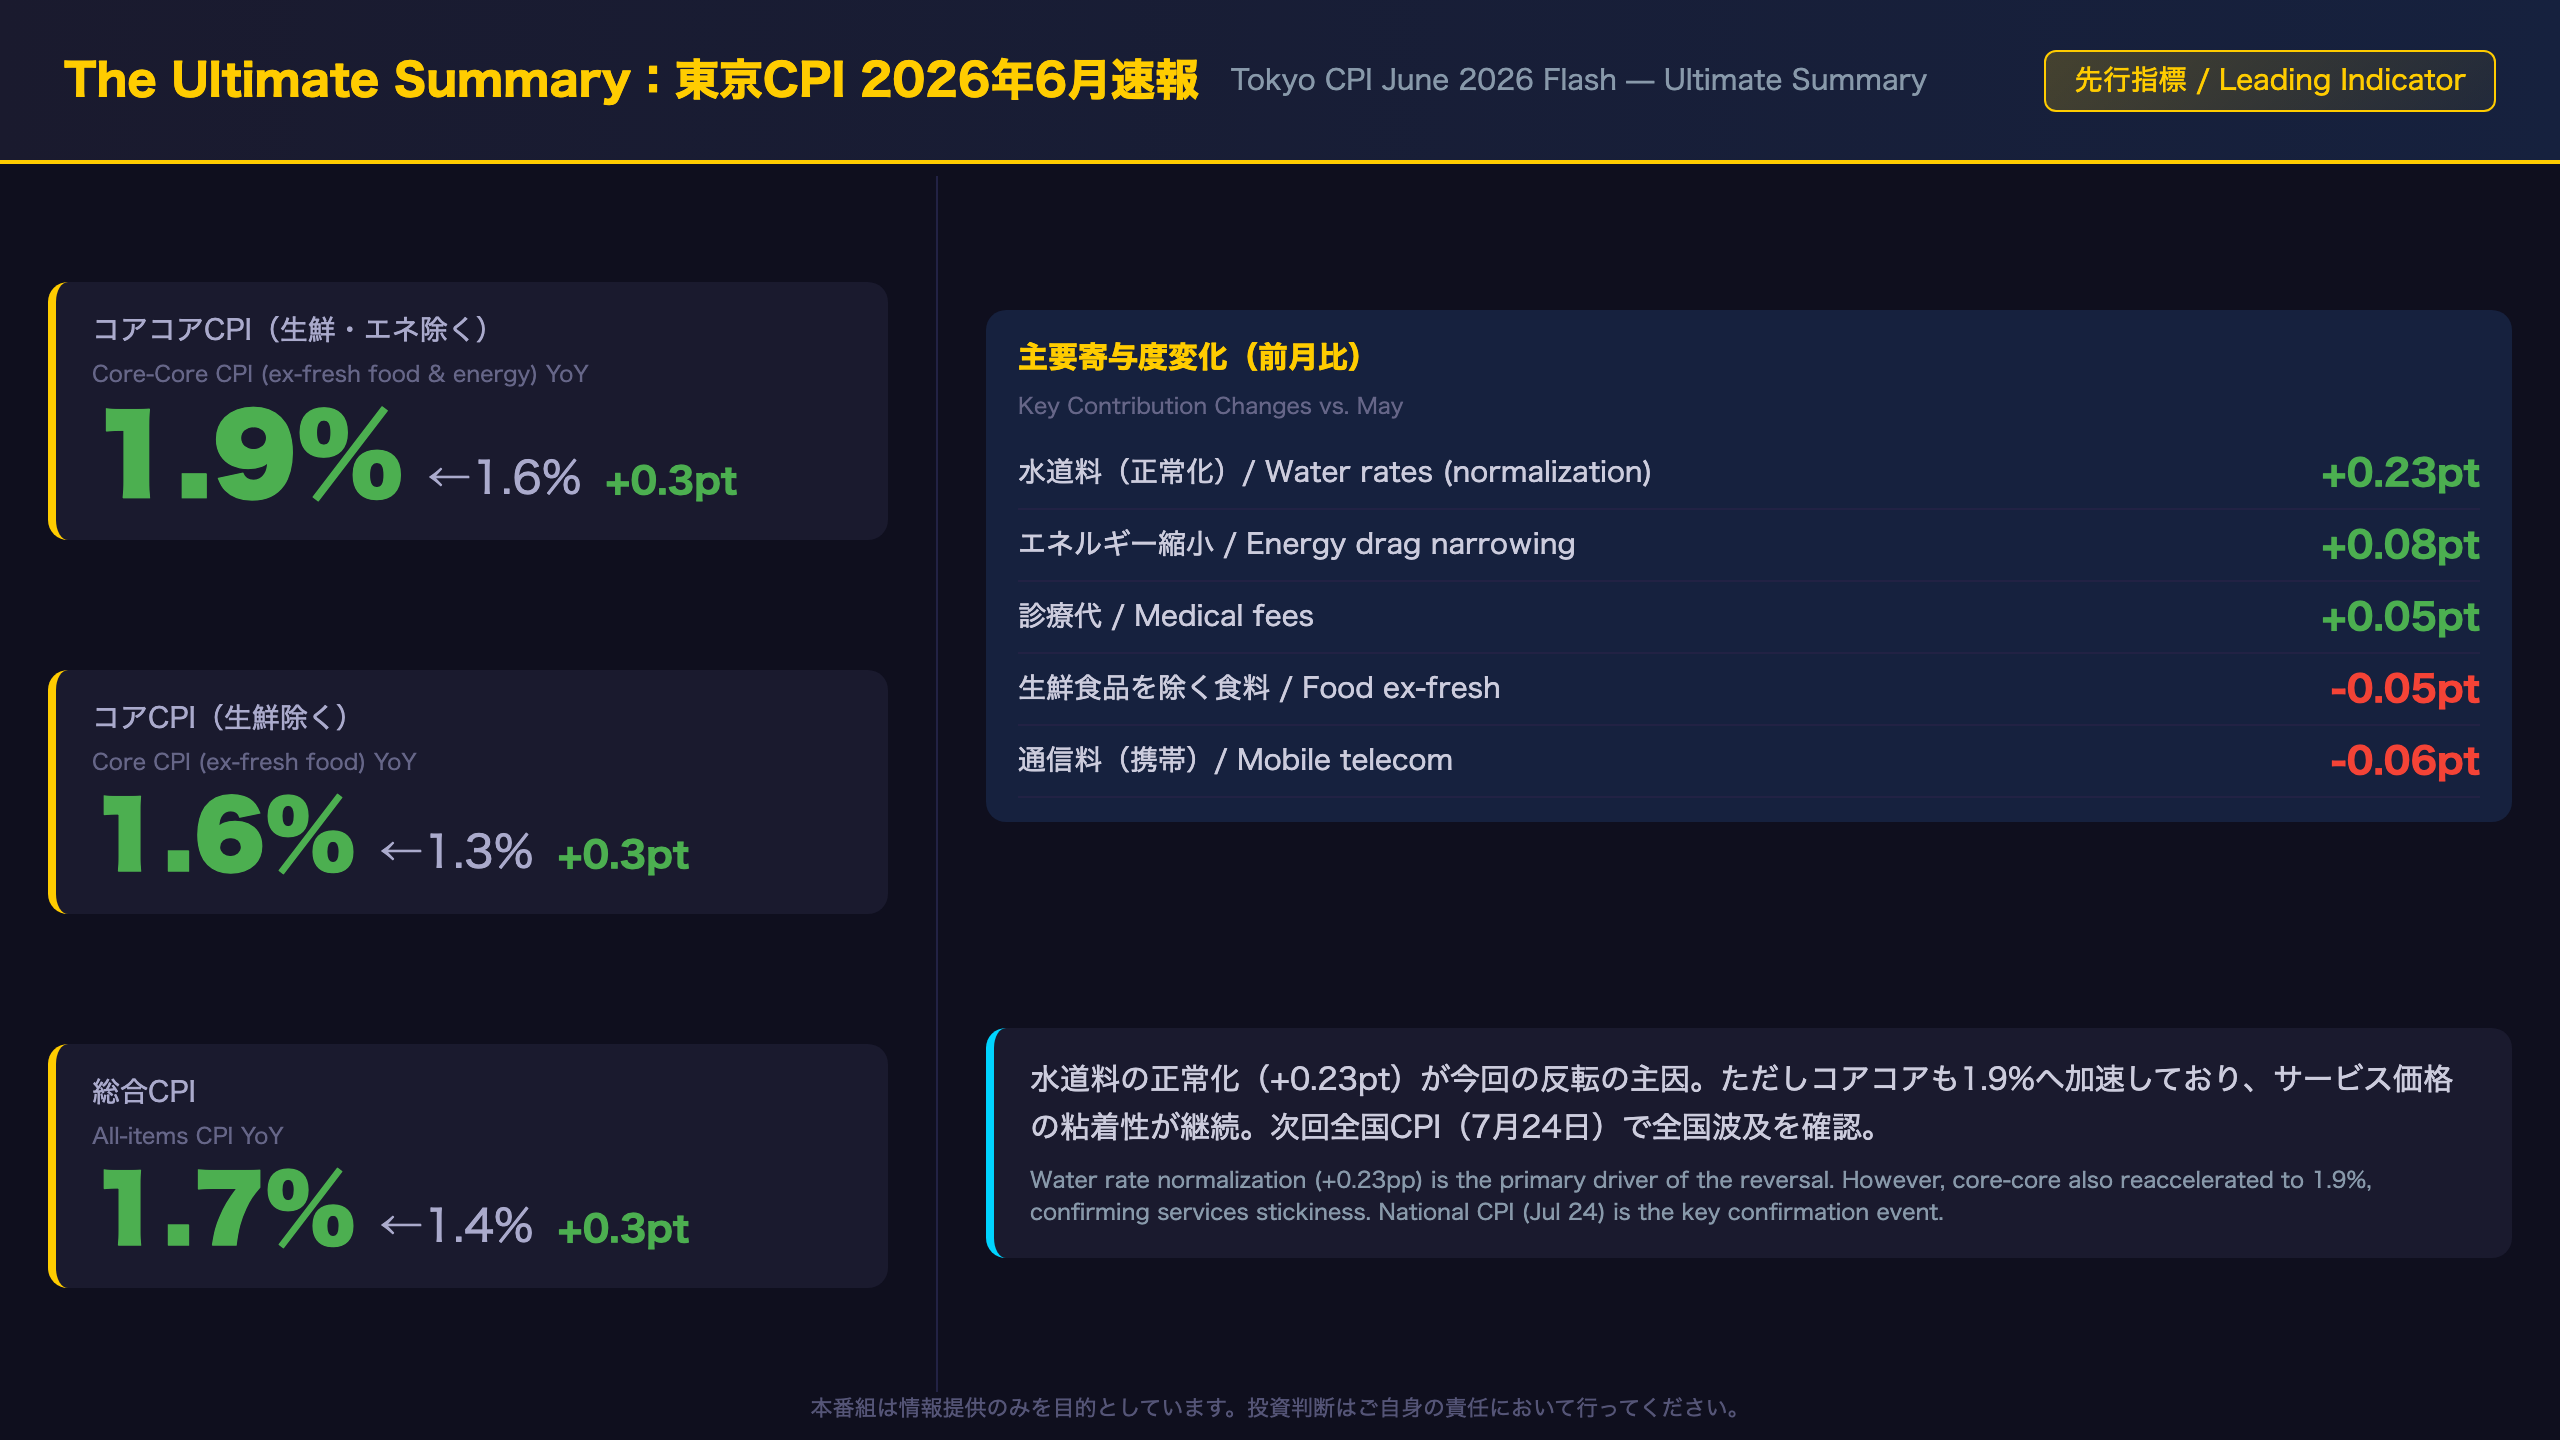
Tokyo CPI June Flash: All Measures Reaccelerate — A Deep Dive
What Is the Tokyo CPI Flash?
The Tokyo CPI flash (“chukan sokuhochi”) is published by Japan’s Ministry of Internal Affairs and Communications (MIC) Statistics Bureau approximately one month ahead of the national CPI. It covers the 23 special wards of Tokyo (“Tokyo-to Kubu”) and is widely regarded as the most reliable leading indicator for Japan’s national inflation trend.
The Numbers at a Glance
| Measure | May 2026 | June 2026 | Change |
|---|---|---|---|
| All-items CPI | +1.4% YoY | +1.7% YoY | +0.3pp |
| Core (ex-fresh food) | +1.3% | +1.6% | +0.3pp |
| Core-core (ex-fresh food & energy) | +1.6% | +1.9% | +0.3pp |
All three measures accelerated by exactly 0.3 percentage points — a clean, broad-based reversal.
The Water Rate Anomaly
The single largest driver of the June rebound was water rates, which swung from -34.6% YoY in May to 0.0% YoY in June, contributing +0.23pp to the headline. This reflects the expiry of a Tokyo municipal water subsidy that had been artificially depressing the year-on-year comparison. This is a statistical base effect, not a genuine acceleration in underlying inflation pressure from water utilities.
However, because Tokyo’s subsidy was implemented ahead of similar national-level measures, a comparable reversal is expected to appear in the national CPI for June (to be released July 24, 2026).
Structural Strength: Services Stickiness
Stripping out the water rate distortion, core-core CPI still reaccelerated to 1.9%. Key contributors:
– Dining out (外食): +4.5% YoY, accelerating from +4.0%
– Rent: +1.3%, continuing a gradual upward drift
– Medical fees: reversed sharply to +1.7% from -0.7%
– Household durable goods: +2.8% from +1.0%
This breadth of acceleration in services and non-energy goods suggests that Japan’s underlying inflation remains sticky — a key consideration for the Bank of Japan (BOJ).
Energy: Still a Headwind
Energy overall remained negative at -2.3% YoY. The government’s gasoline excise tax suspension continues to suppress energy prices, with the policy effect estimated at -0.19pp for the energy component. The timing of this policy’s unwinding will be a critical variable for future CPI prints.
BOJ Implications
The BOJ targets 2% inflation on a sustainable basis. With core-core at 1.9% and services showing stickiness, the data is directionally supportive of further normalization. However, the BOJ will want to see the national CPI confirm this signal before adjusting its rate-hike path. The next national CPI (June data, July 24) is the key event to watch.
Deep Dive①:水道料の急反転 ─ 一時的要因か、構造変化か
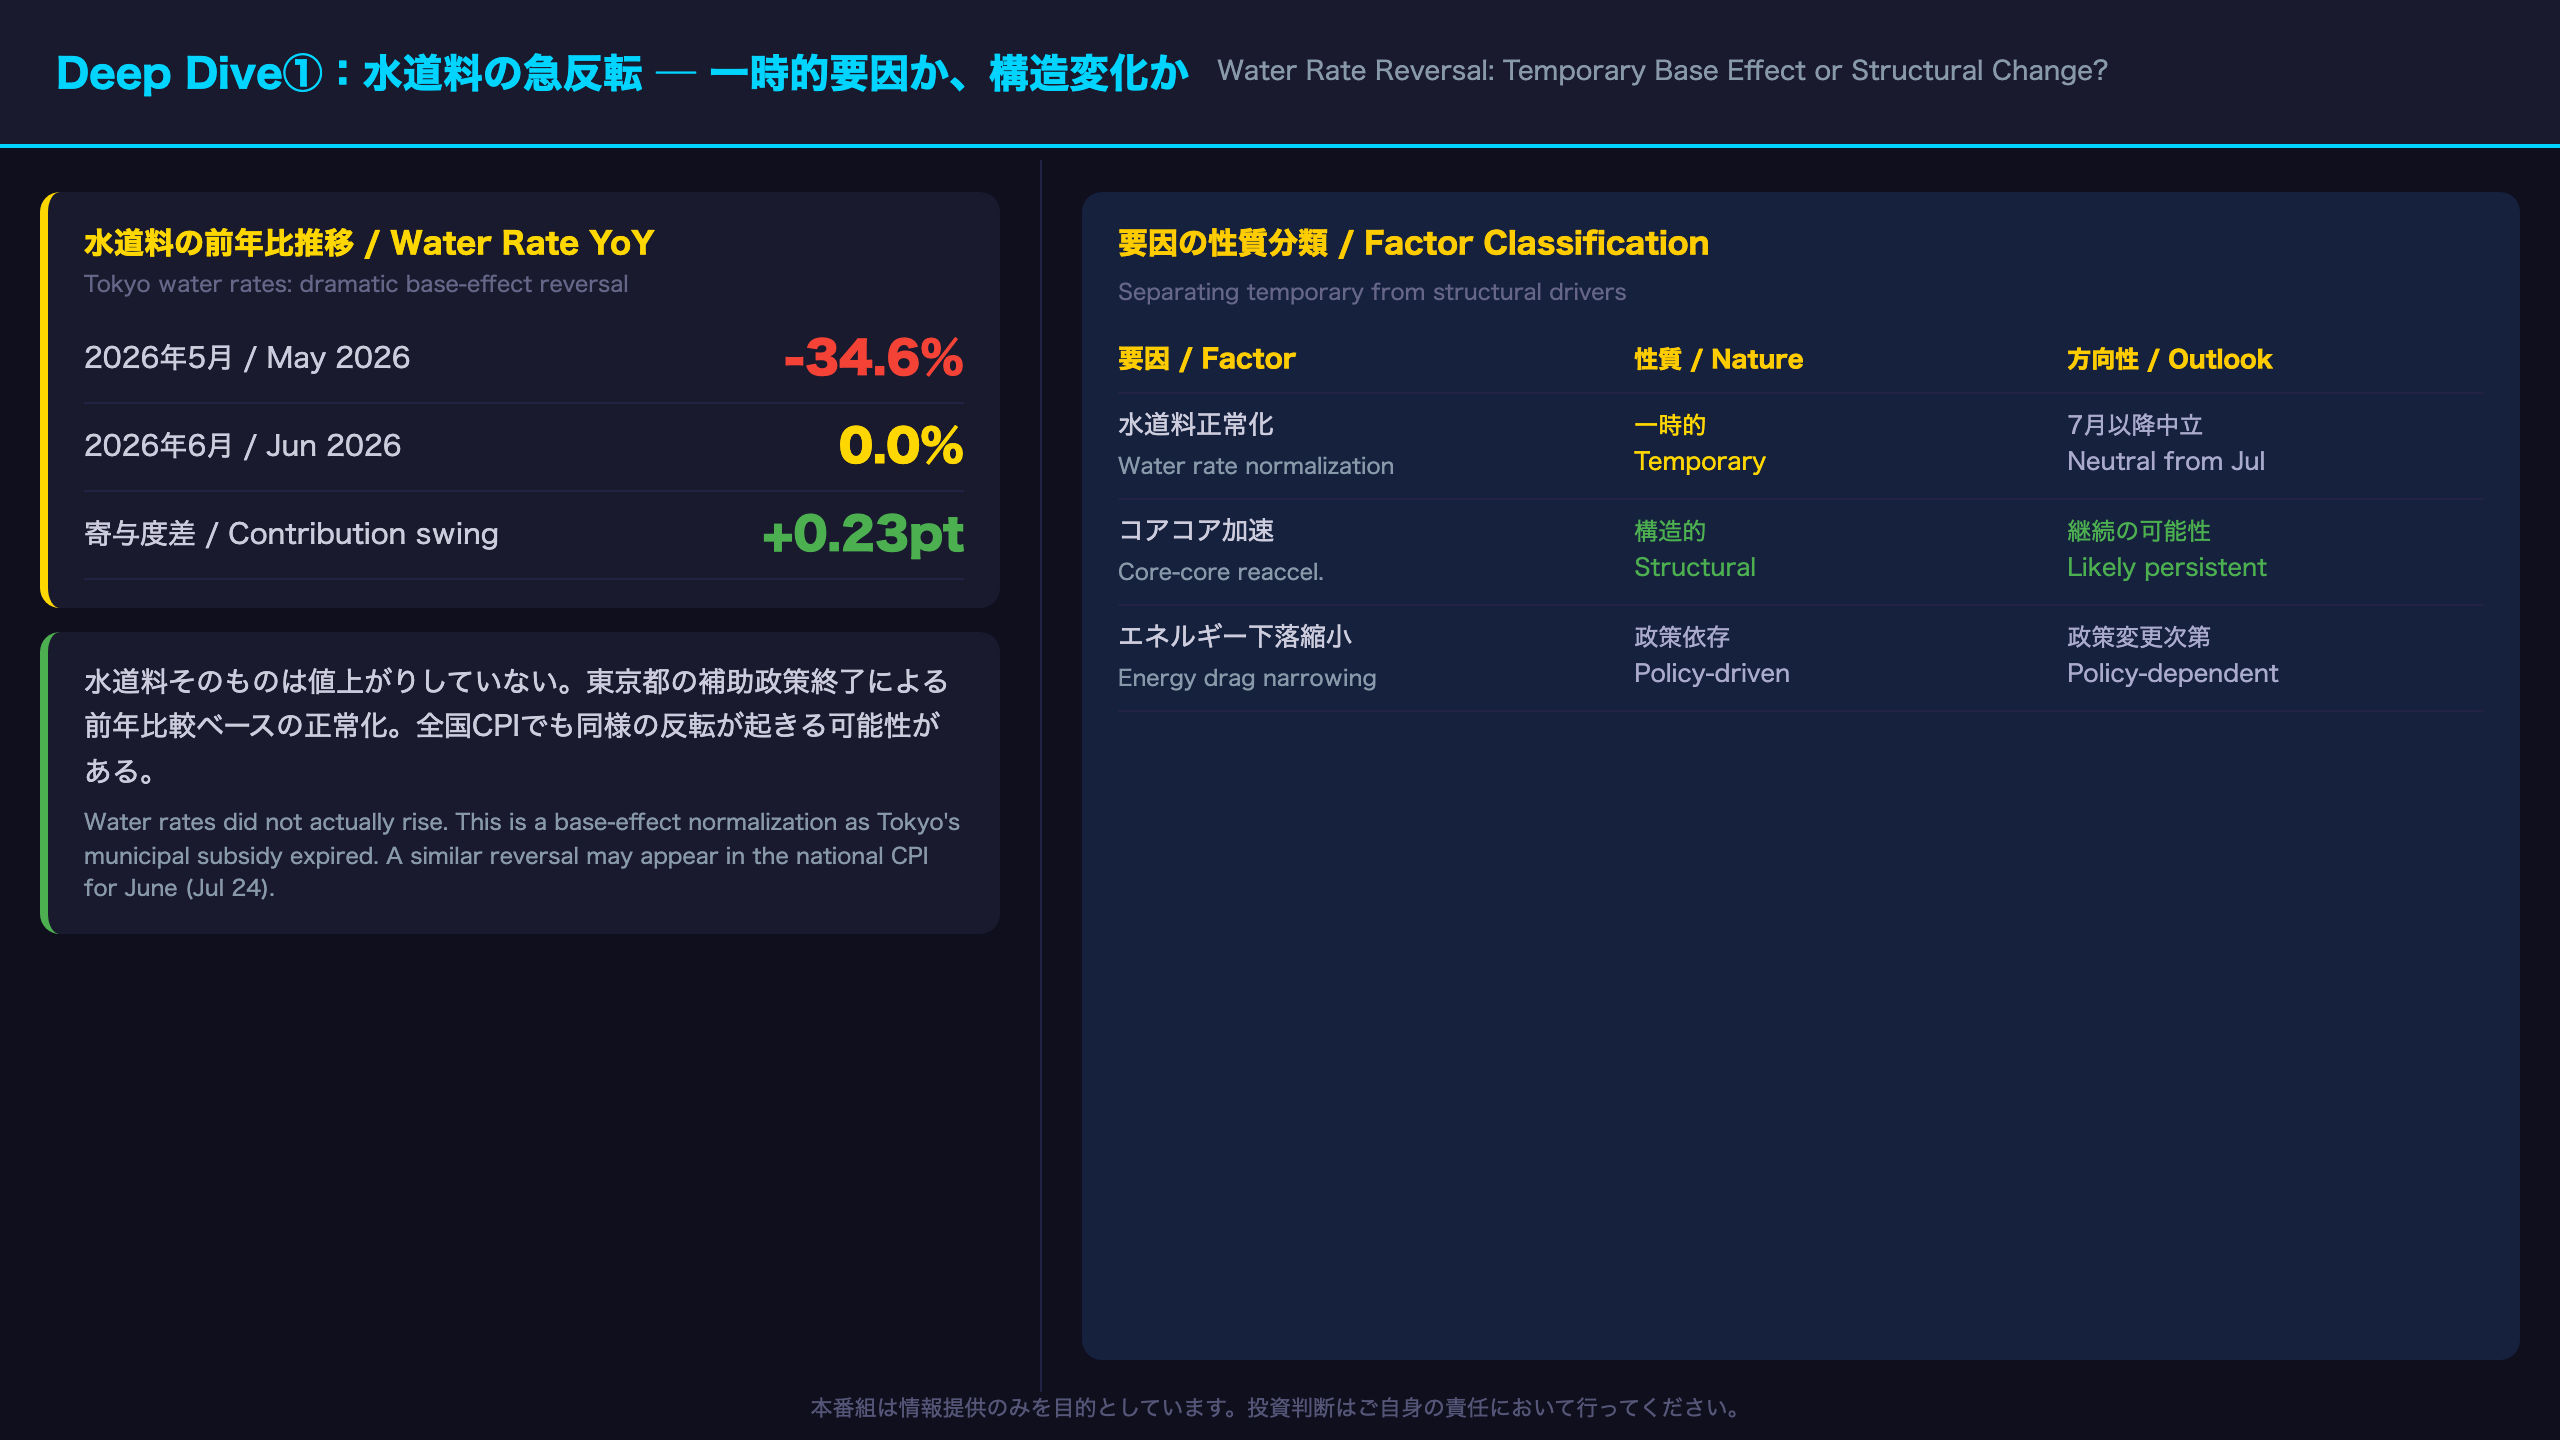
Tokyo Water Rate Reversal: Statistical Trick or Real Signal?
Background: Tokyo’s Water Subsidy
The Tokyo Metropolitan Government implemented a water rate subsidy during fiscal year 2025 (April 2025 – March 2026). This subsidy artificially depressed the year-on-year comparison for water rates, which showed -34.6% YoY in May 2026 with a contribution of -0.23pp to the headline CPI.
In June 2026, the prior-year subsidy period rolled off the comparison base, causing water rates to snap back to 0% YoY. Water rates did not actually increase — the low base from the subsidy period simply disappeared from the year-on-year calculation.
National CPI Implications
Because Tokyo’s subsidy was implemented ahead of similar national-level measures, a comparable base-effect reversal is expected in the national CPI for June (released July 24, 2026). The magnitude of the national effect may differ from Tokyo’s, as the timing and scale of subsidies varied across municipalities.
Separating Temporary from Structural
| Factor | Nature | Forward Outlook |
|---|---|---|
| Water rate normalization | Temporary (base effect) | Neutral from July onward |
| Core-core reacceleration | Structural (services stickiness) | Likely to persist |
| Energy drag narrowing | Policy-dependent (gasoline tax) | Depends on policy timeline |
Historical Context
Tokyo core-core CPI peaked at 2.8% in October–November 2025, then decelerated to 1.9% by April 2026. June’s reading of 1.9% matches April’s level, suggesting a possible floor — but a single month’s data is insufficient to confirm a trend reversal.
Deep Dive②:コアコアCPIの内訳 ─ サービス価格の粘着性と財価格の動向
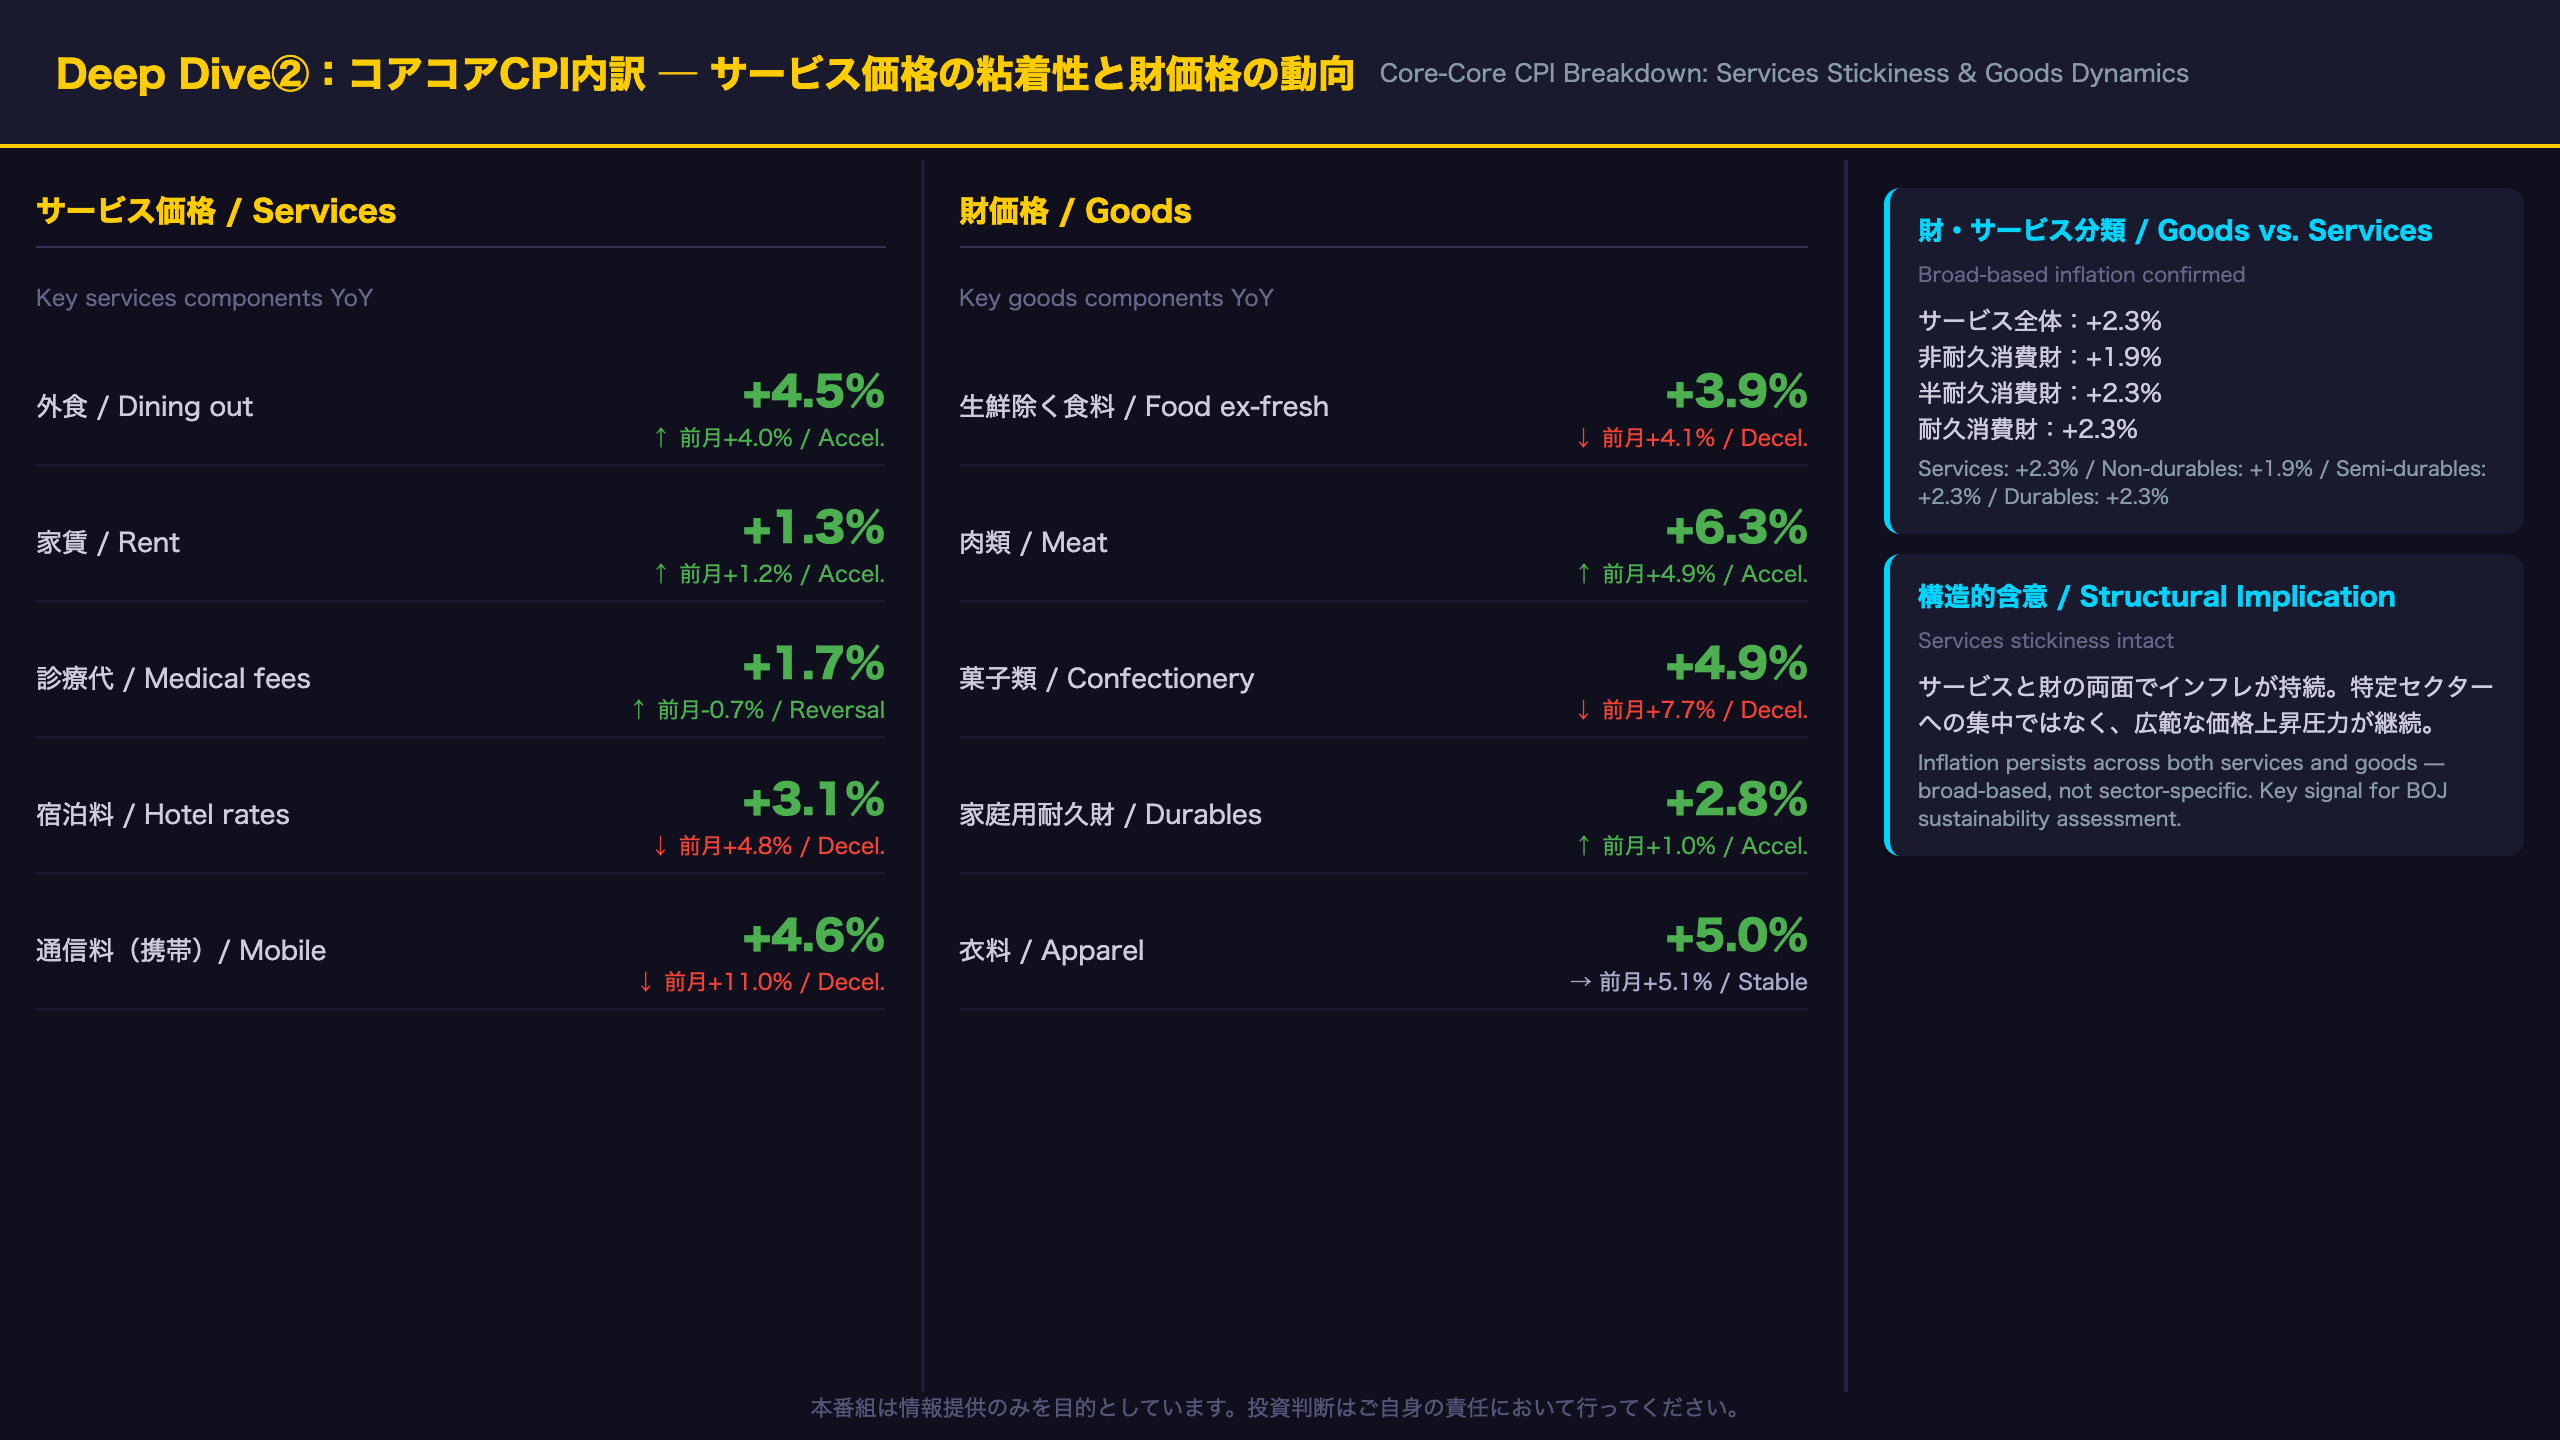
Core-Core CPI Breakdown: Services Stickiness and Goods Acceleration
Services: Stickiness Confirmed
Dining out (weight: 534/10,000): +4.5% YoY, accelerating from +4.0% in May. Sushi restaurants rose 20.0% and boxed lunches 26.7%, reflecting ongoing food cost pass-through. Dining out contributes 0.25pp to the headline.
Rent (weight: 453): +1.3% YoY, continuing a gradual upward drift. Private-sector rents rose 1.6%. Japanese rents are typically revised only at contract renewal, so the pace of increase is slow — but the direction is clearly upward.
Medical fees (weight: 240): Reversed sharply from -0.7% to +1.7% YoY (contribution swing +0.05pp). This may reflect the biennial medical fee revision cycle in Japan.
Goods: Signs of Reacceleration
Household durable goods (weight: 111): Surged from +1.0% to +2.8% YoY. System kitchens rose 15.0%.
Apparel (weight: 170): Remained elevated at +5.0% YoY. Women’s jeans rose 15.8%.
Goods vs. Services Classification
| Category | YoY | vs. Prior Month |
|---|---|---|
| Services overall | +2.3% | Accelerating |
| General services | +2.2% | Stable |
| Non-durable goods | +1.9% | Accelerating |
| Semi-durable goods | +2.3% | Stable |
| Durable goods | +2.3% | Accelerating |
The breadth of price increases across both services and goods confirms that inflation is not concentrated in a single sector. This broad-based nature is precisely what the BOJ monitors when assessing whether inflation is “sustainable” — a key criterion for further rate normalization.
Deep Dive③:エネルギーと食料 ─ 政策効果と食料インフレの現状
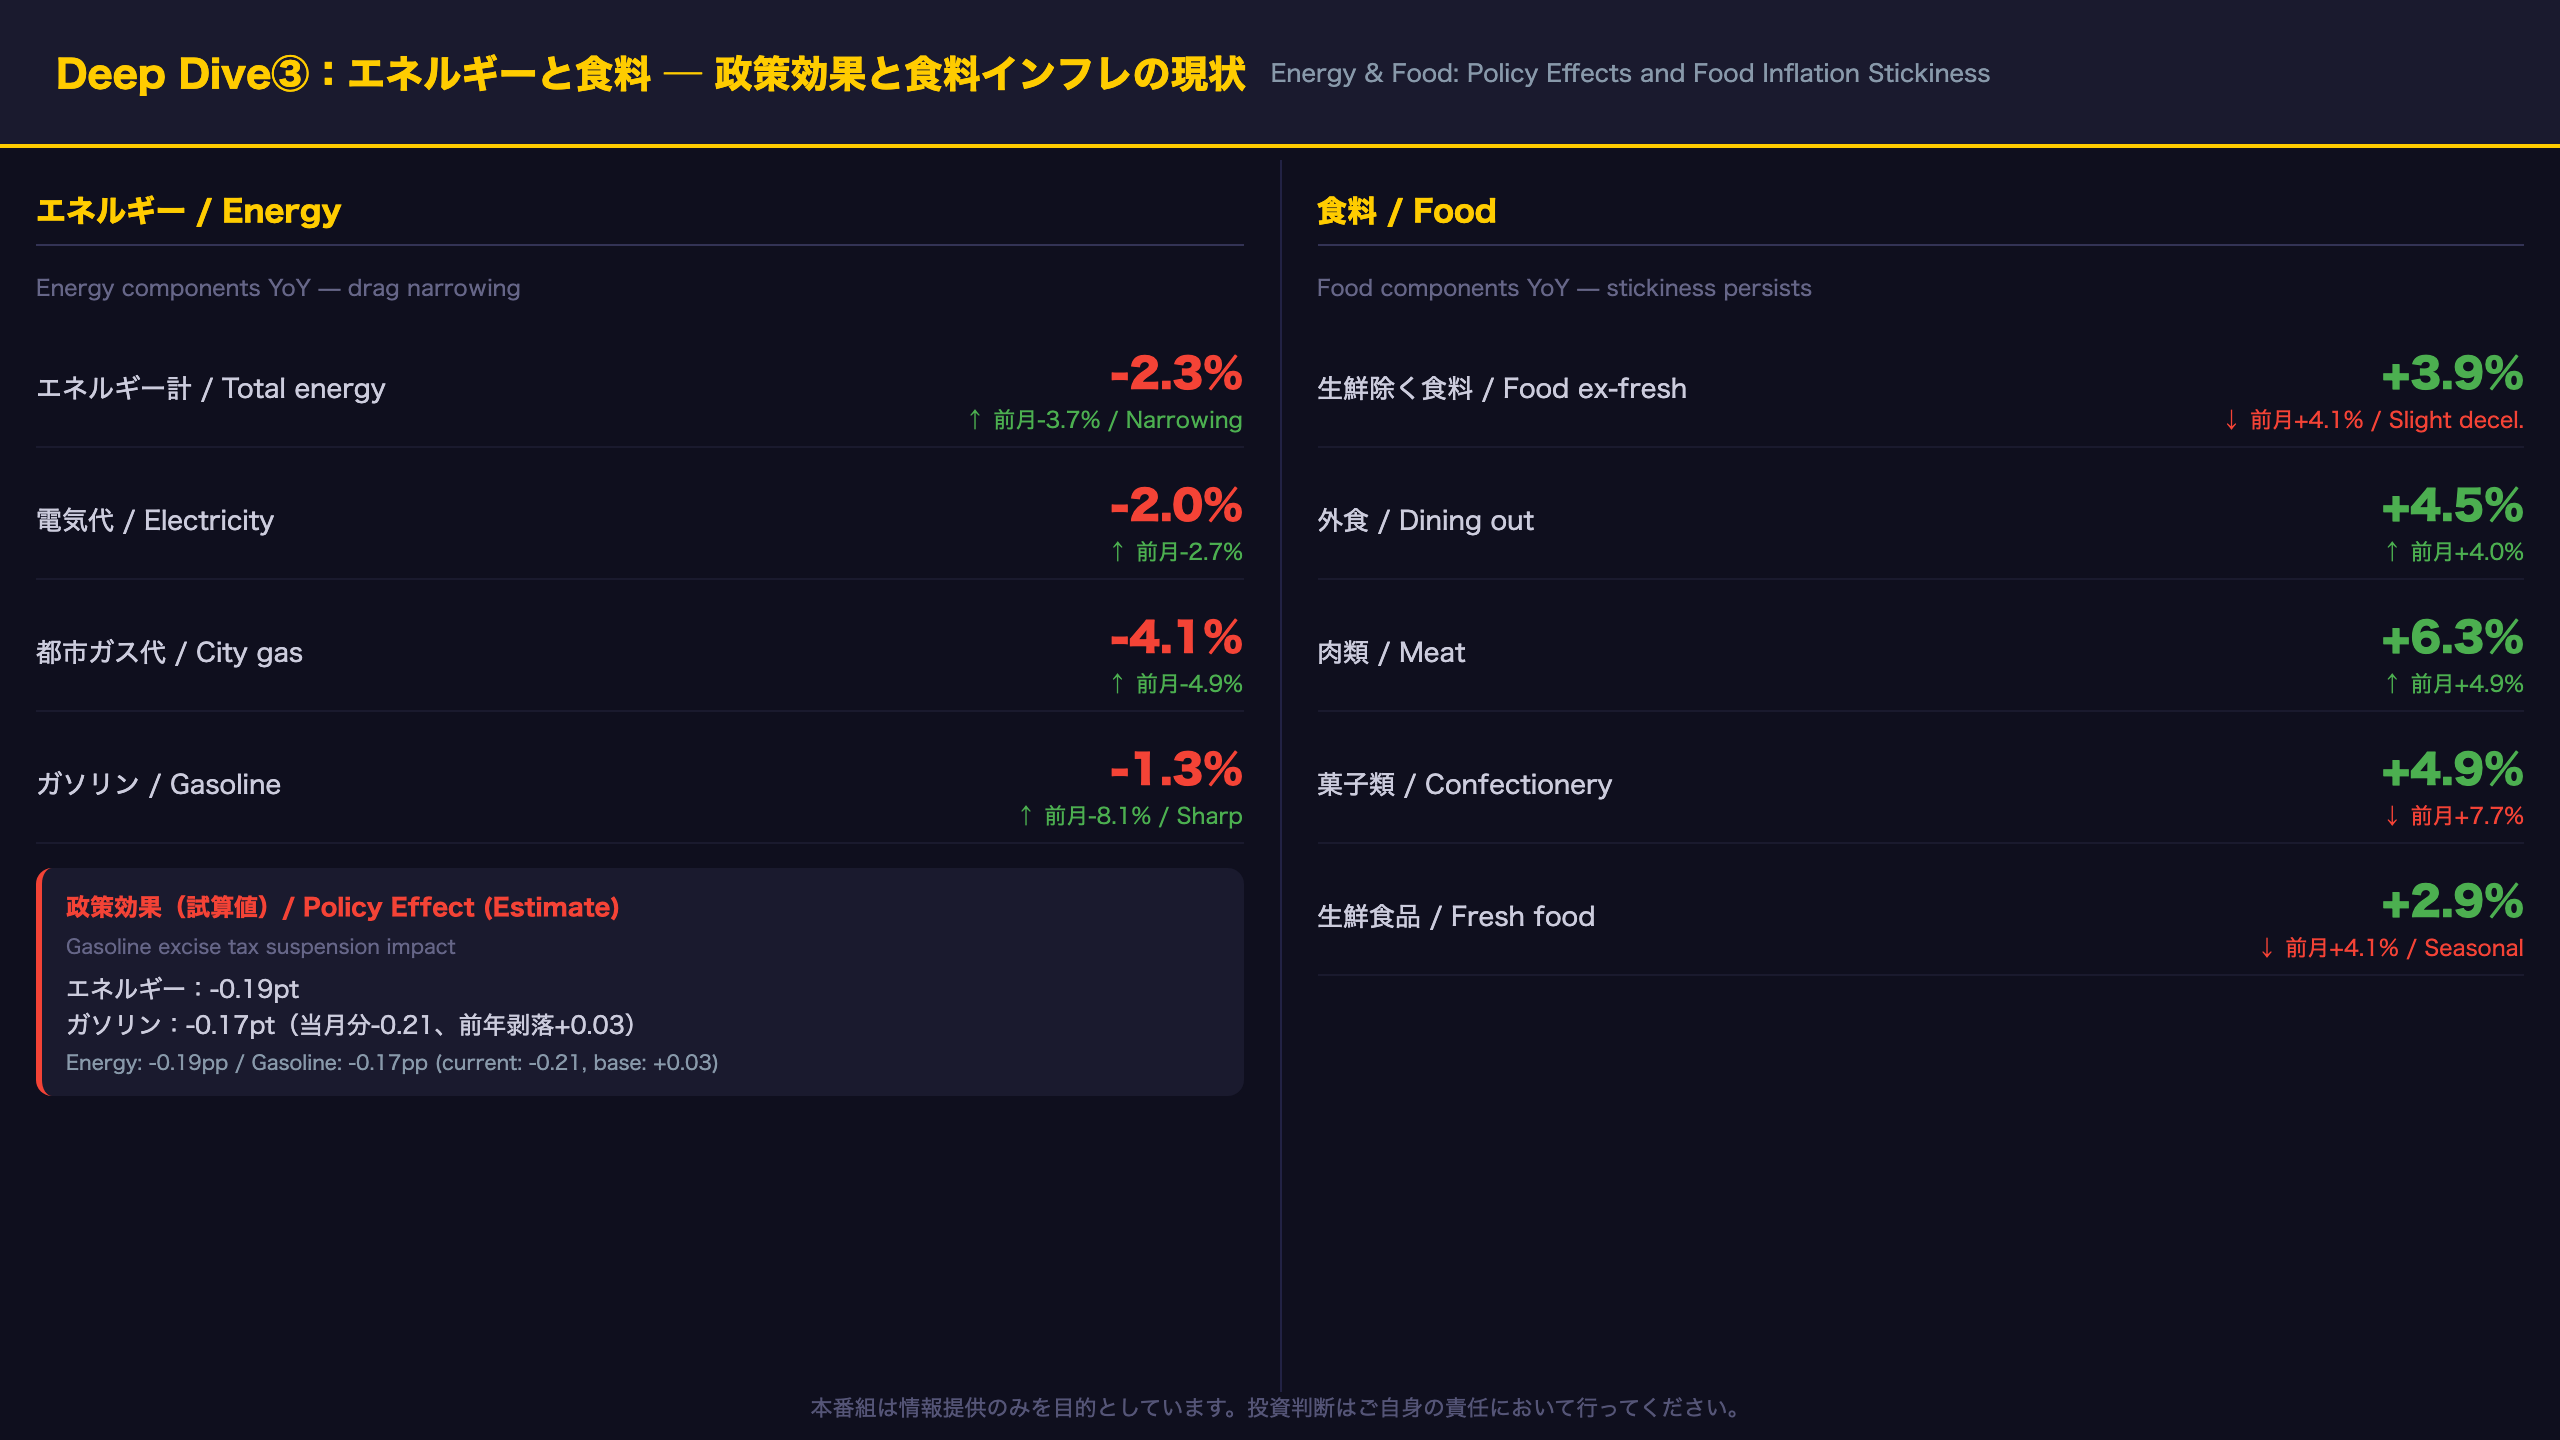
Energy and Food: Policy Effects and Inflation Stickiness
Energy: Policy Drag Persists but Narrowing
| Item | May YoY | June YoY | Change |
|---|---|---|---|
| Energy total | -3.7% | -2.3% | Narrowing |
| Electricity | -2.7% | -2.0% | Narrowing |
| City gas | -4.9% | -4.1% | Narrowing |
| Gasoline | -8.1% | -1.3% | Sharp narrowing |
The most notable shift is gasoline, which narrowed dramatically from -8.1% to -1.3% YoY. The estimated policy effect from Japan’s gasoline excise tax suspension is -0.17pp (current month: -0.21pp, prior-year base effect: +0.03pp). When this policy effect eventually unwinds, the energy contribution to CPI could improve substantially.
Food: Sticky Inflation Continues
Food excluding fresh items remained elevated at 3.9% YoY. Key items:
– Dining out: +4.5% (sushi restaurants +20.0%, boxed lunches +26.7%)
– Meat: +6.3% (domestic pork +10.3%)
– Confectionery: +4.9% (potato chips +16.4%)
– Prepared foods: +4.4%
Food inflation has remained elevated since the second half of 2025, continuing to erode household real purchasing power. However, the slight deceleration from 4.1% in May suggests a possible peak — though multiple months of data are needed to confirm.
Fresh Food: Seasonal Deceleration
Fresh food decelerated to +2.9% YoY from +4.1% in May. Fresh vegetables narrowed their decline to -2.1% from -6.4%, while fresh fish remained elevated at +8.0%. Fresh food volatility is largely seasonal, and trend identification requires multiple months of data.
インプリケーション:市場・日銀政策への含意
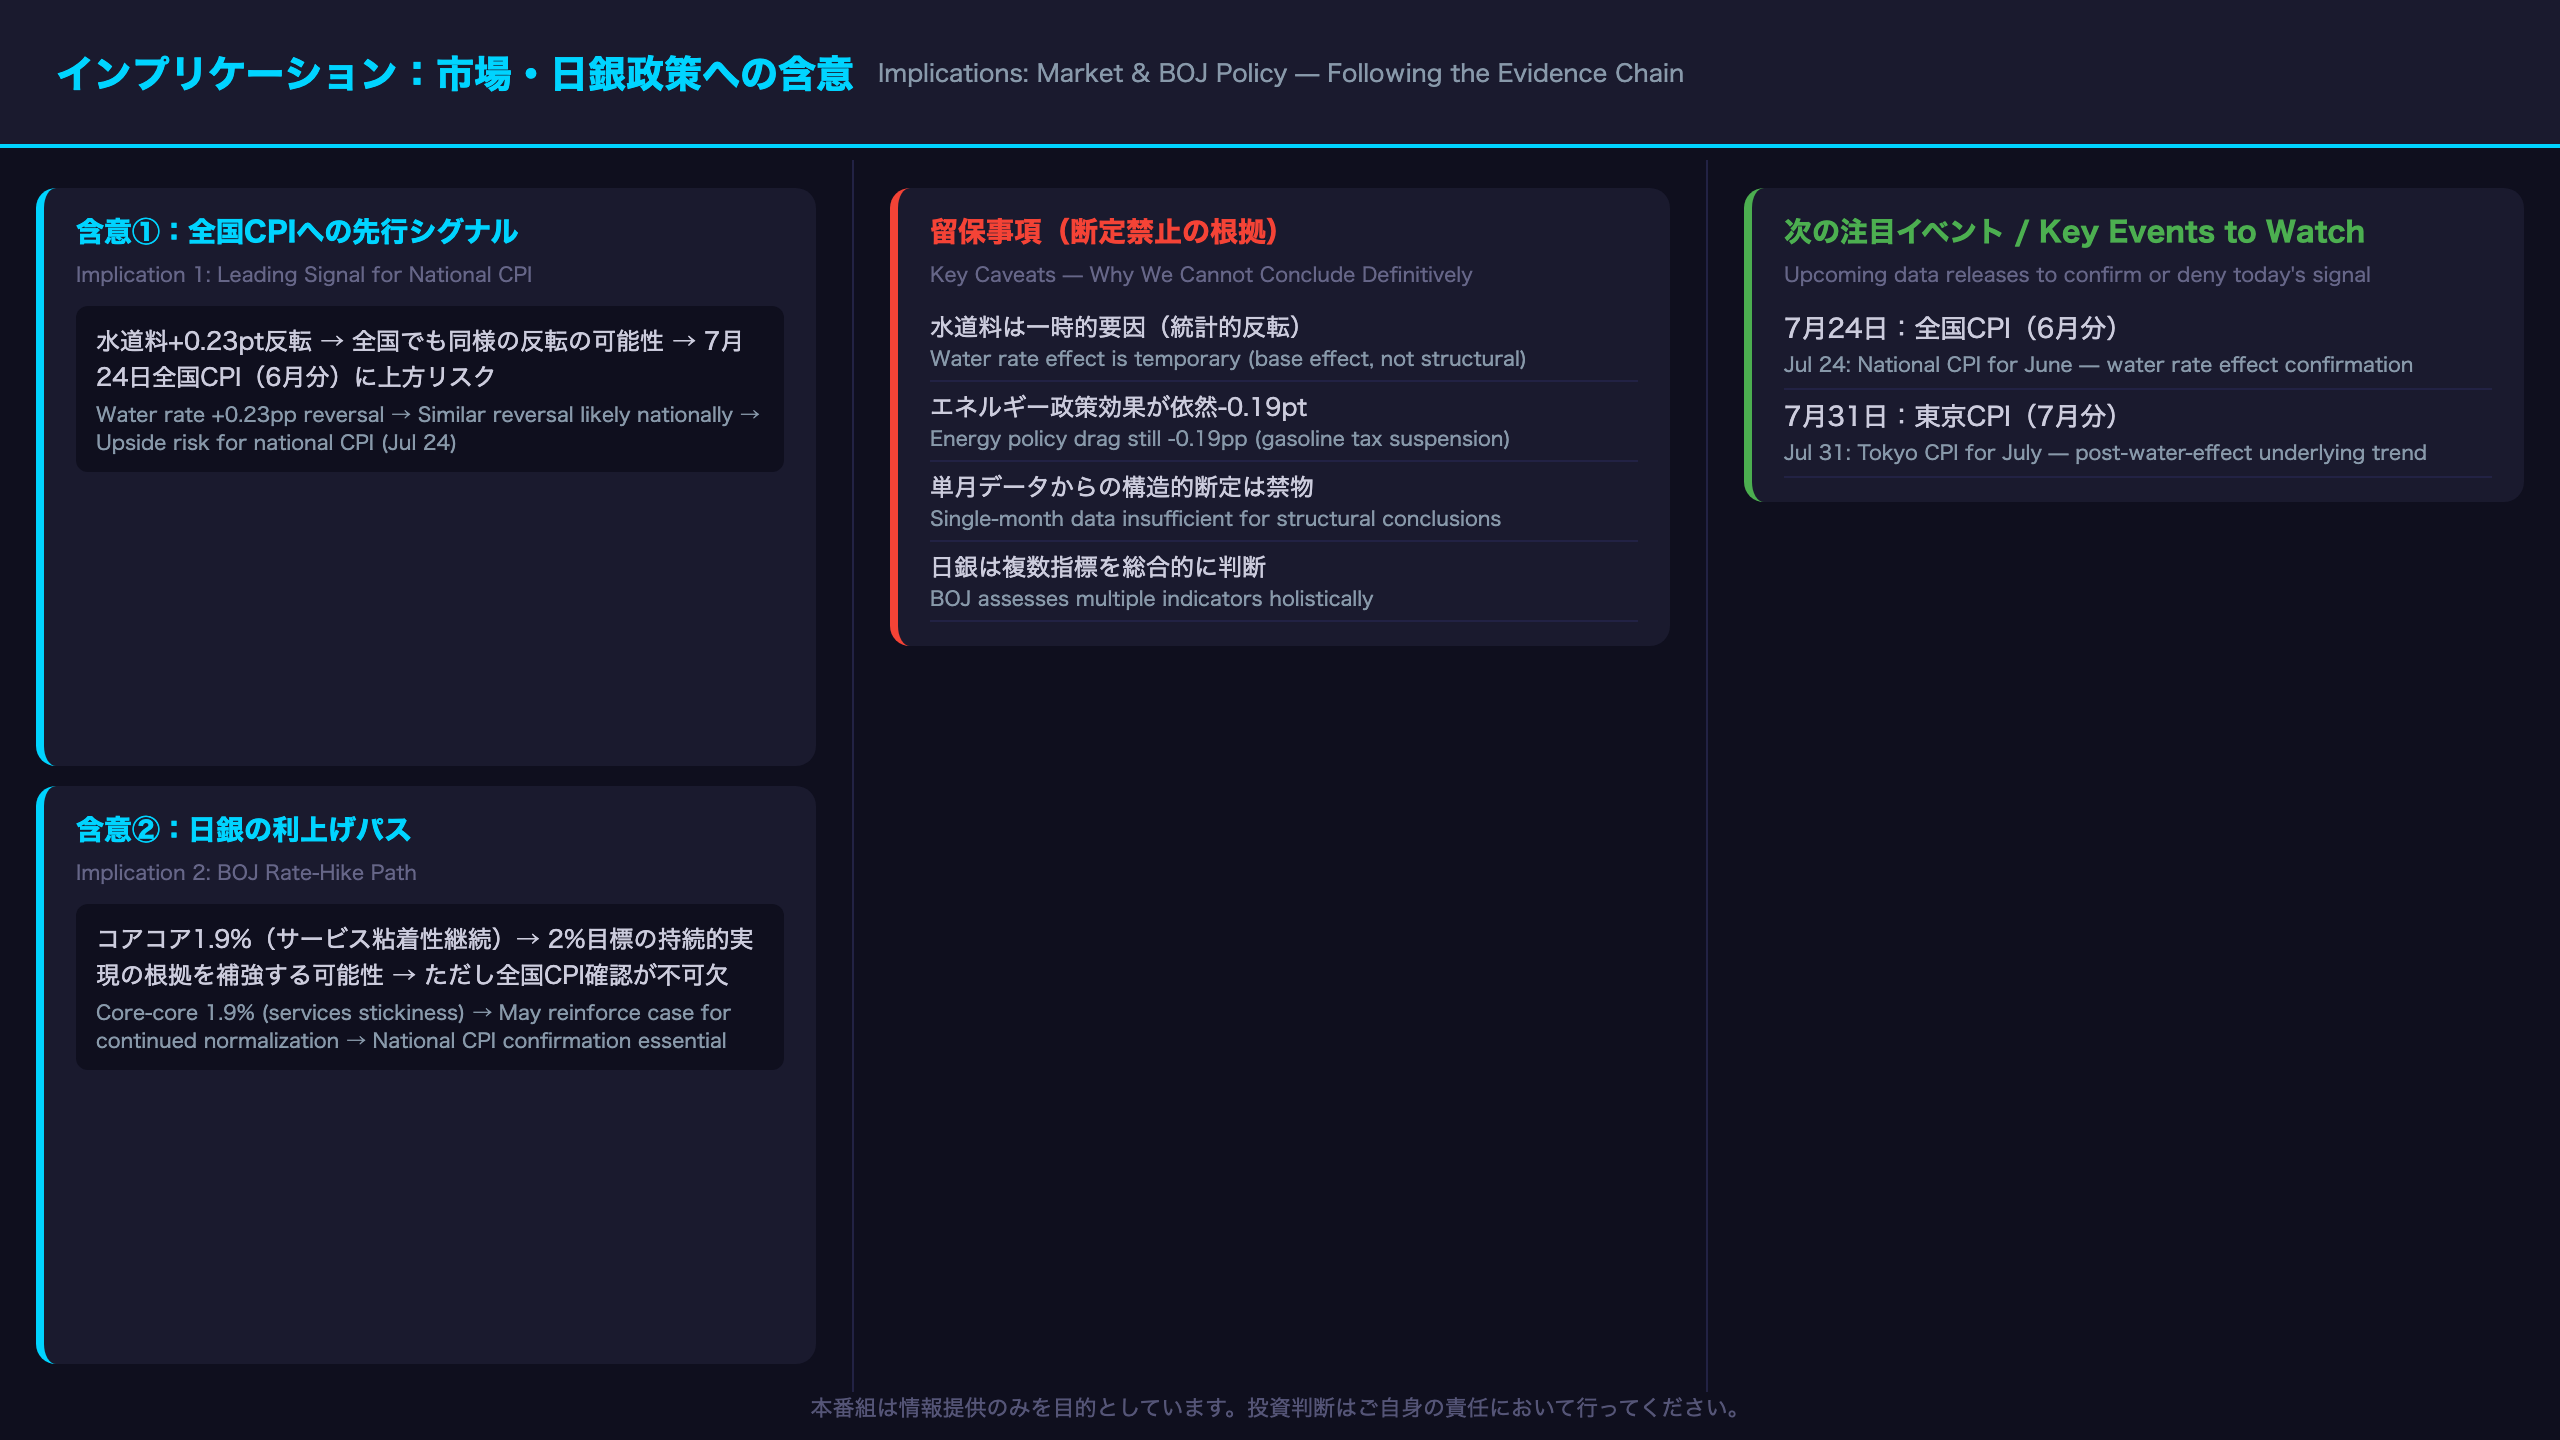
Market and BOJ Policy Implications: Following the Evidence Chain
Implication 1: Leading Signal for National CPI
Evidence chain: Tokyo water rates reversed from -34.6% to 0% YoY (+0.23pp contribution) → Tokyo’s water subsidy was implemented ahead of national measures → A similar reversal is plausible at the national level → Upside risk for national CPI for June (released July 24, 2026)
Caveat: The national subsidy timing and scale may differ from Tokyo’s, so the magnitude of the national effect requires confirmation. While Tokyo CPI generally leads the national figure, the policy-driven nature of this reversal adds unusual uncertainty.
Implication 2: BOJ Rate-Hike Path
Evidence chain: Core-core CPI at 1.9% (services stickiness confirmed) → Supports BOJ’s assessment of “sustainable and stable achievement of 2% price stability” → May reinforce the case for continued gradual normalization
Key caveats:
– The water rate effect is temporary and will not recur
– The energy policy drag (-0.19pp) remains substantial
– Single-month data is insufficient for firm conclusions
– The BOJ assesses multiple indicators holistically
Implication 3: FX and Rates
A reacceleration in Tokyo core CPI is generally interpreted as a yen-supportive, JGB-yield-upward signal. However, if markets recognize that the primary driver is the temporary water rate reversal, the reaction may be muted. This data point alone is insufficient for definitive market calls — the combination with the upcoming national CPI will be the more meaningful signal.
Key Events to Watch
- July 24, 2026: National CPI for June → Confirms whether Tokyo’s water rate signal propagates nationally
- July 31, 2026: Tokyo CPI for July → Reveals underlying trend after water rate effect fades
Disclaimer: This article is for informational purposes only. All investment decisions are made solely at your own risk.