📺 Watch the Full Video Analysis
This article was automatically generated by the NFC Market Live AI analysis system. (Updated: 2026-06-25 21:41 JST)
📄 Primary Source
U.S. Bureau of Economic Analysis
https://www.bea.gov/sites/default/files/2026-06/gdp1q26-3rd.pdf
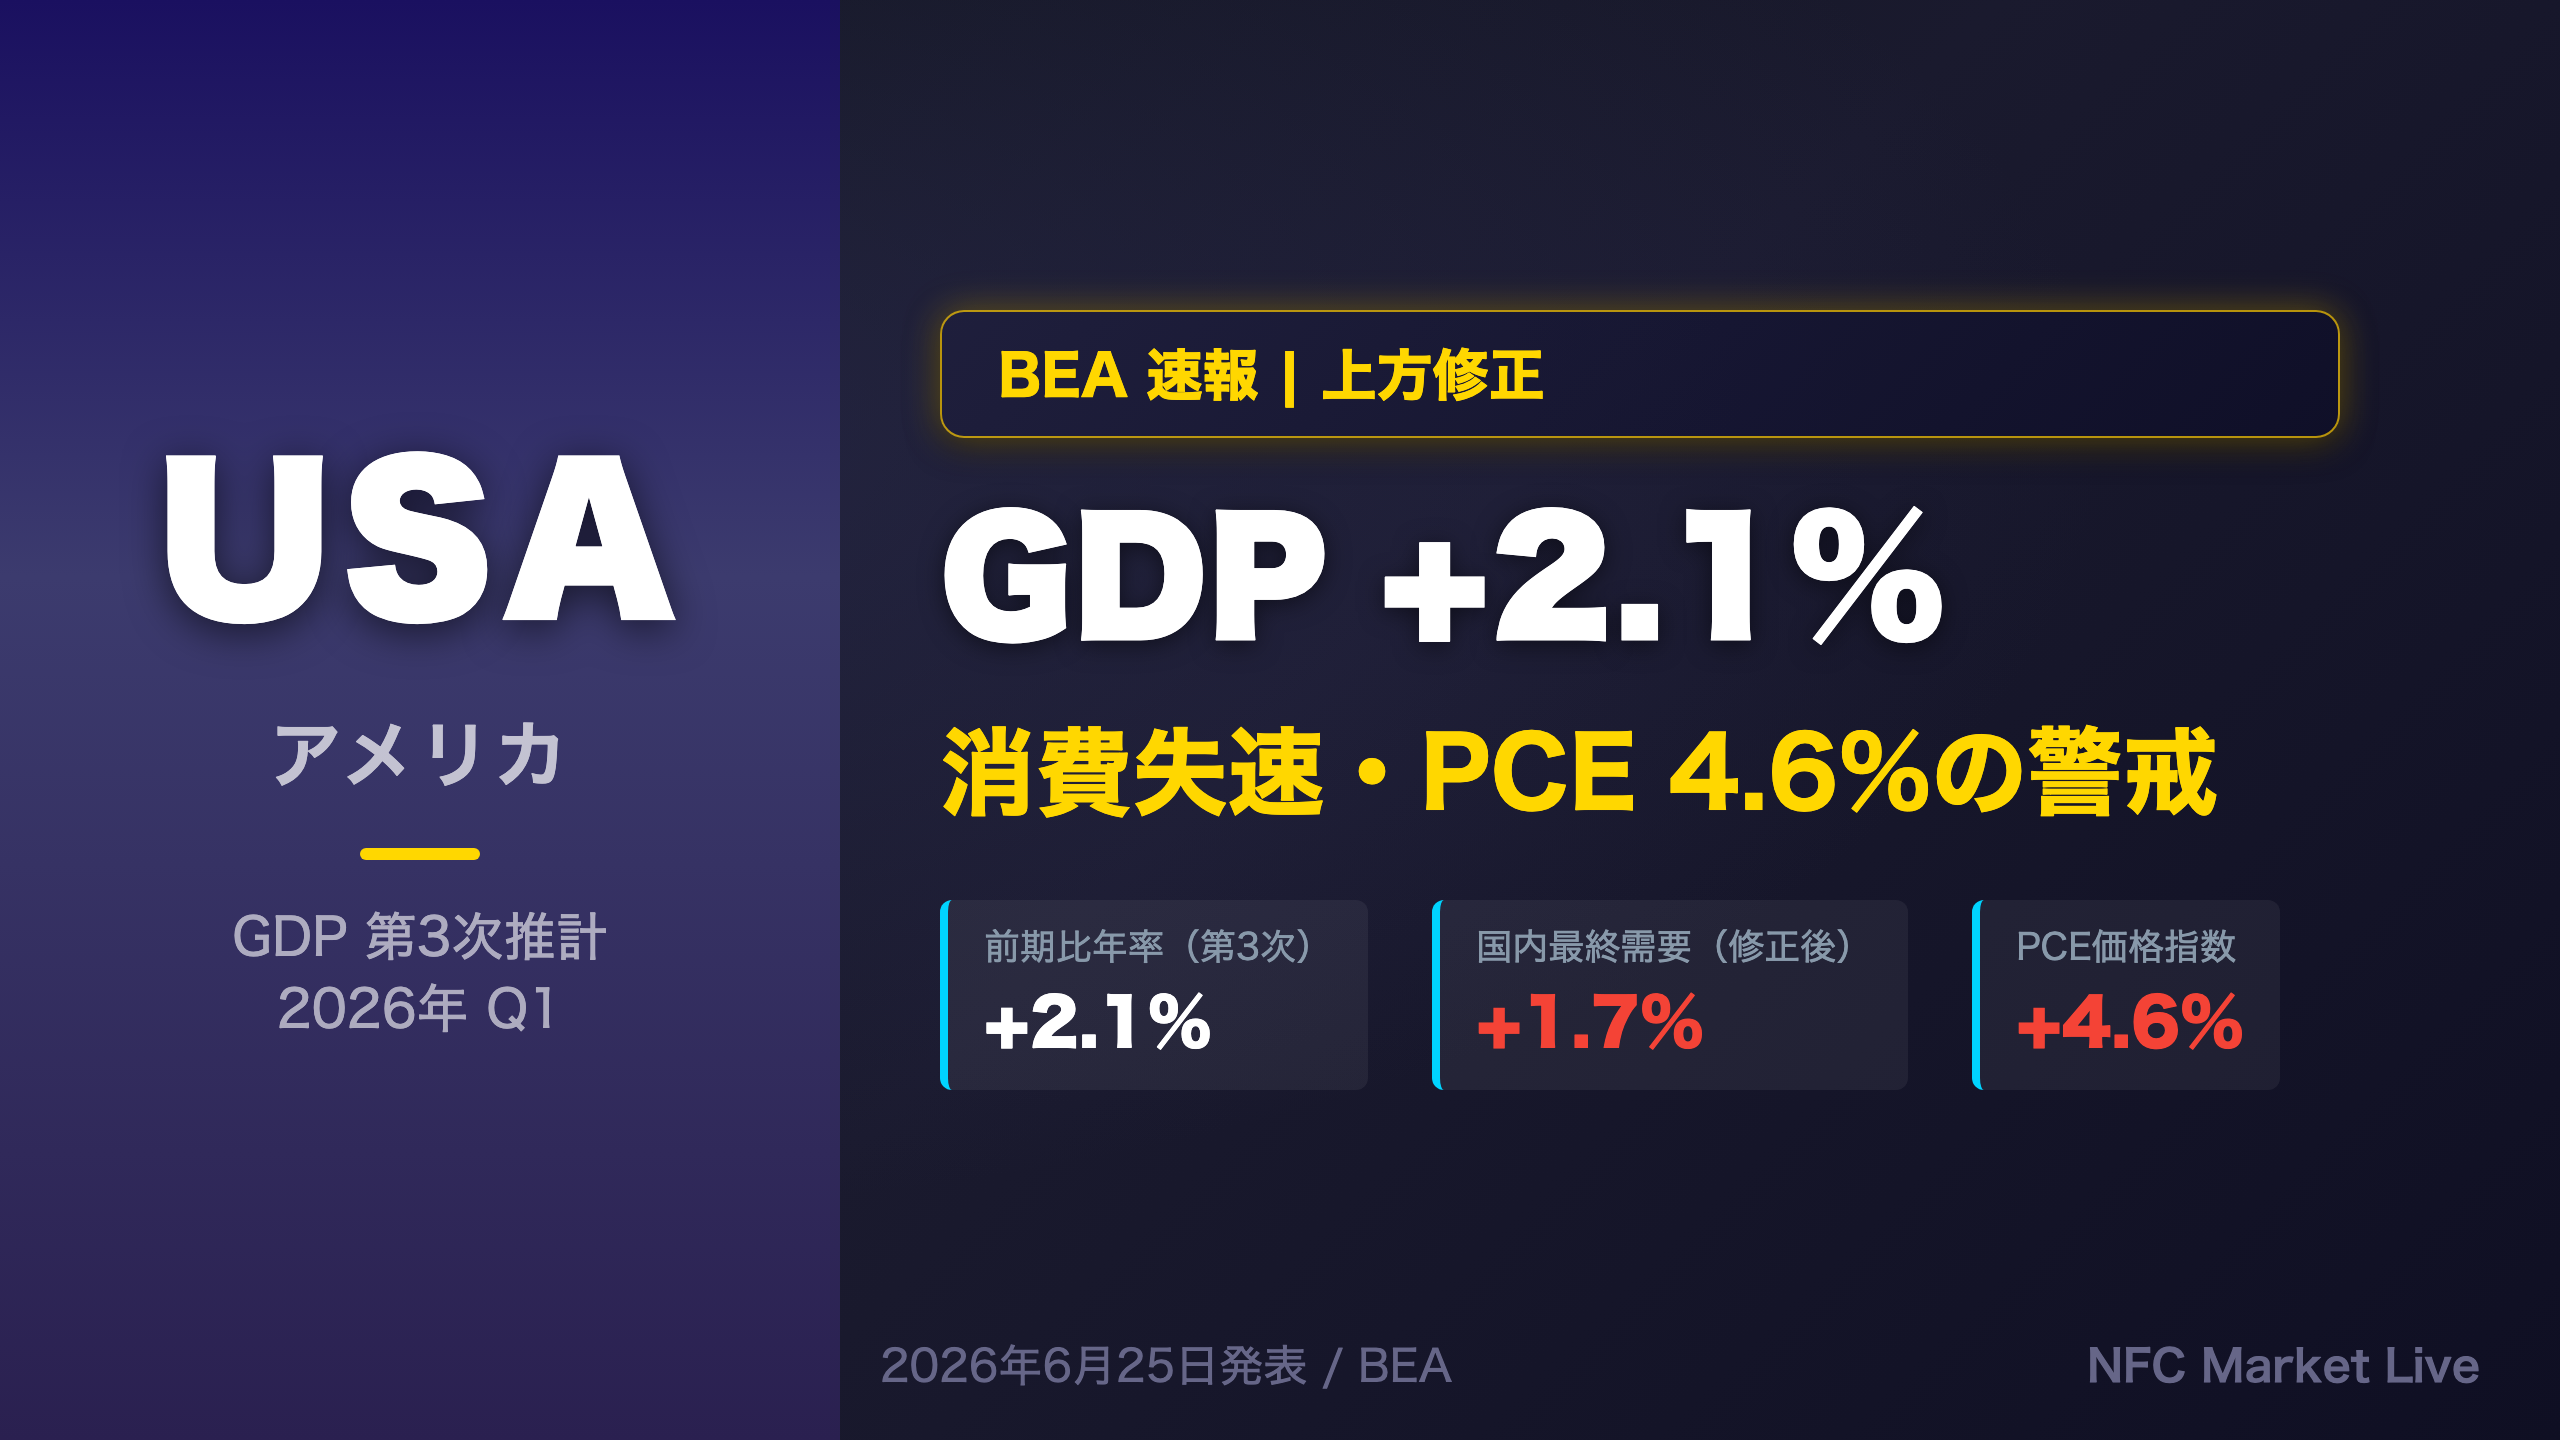
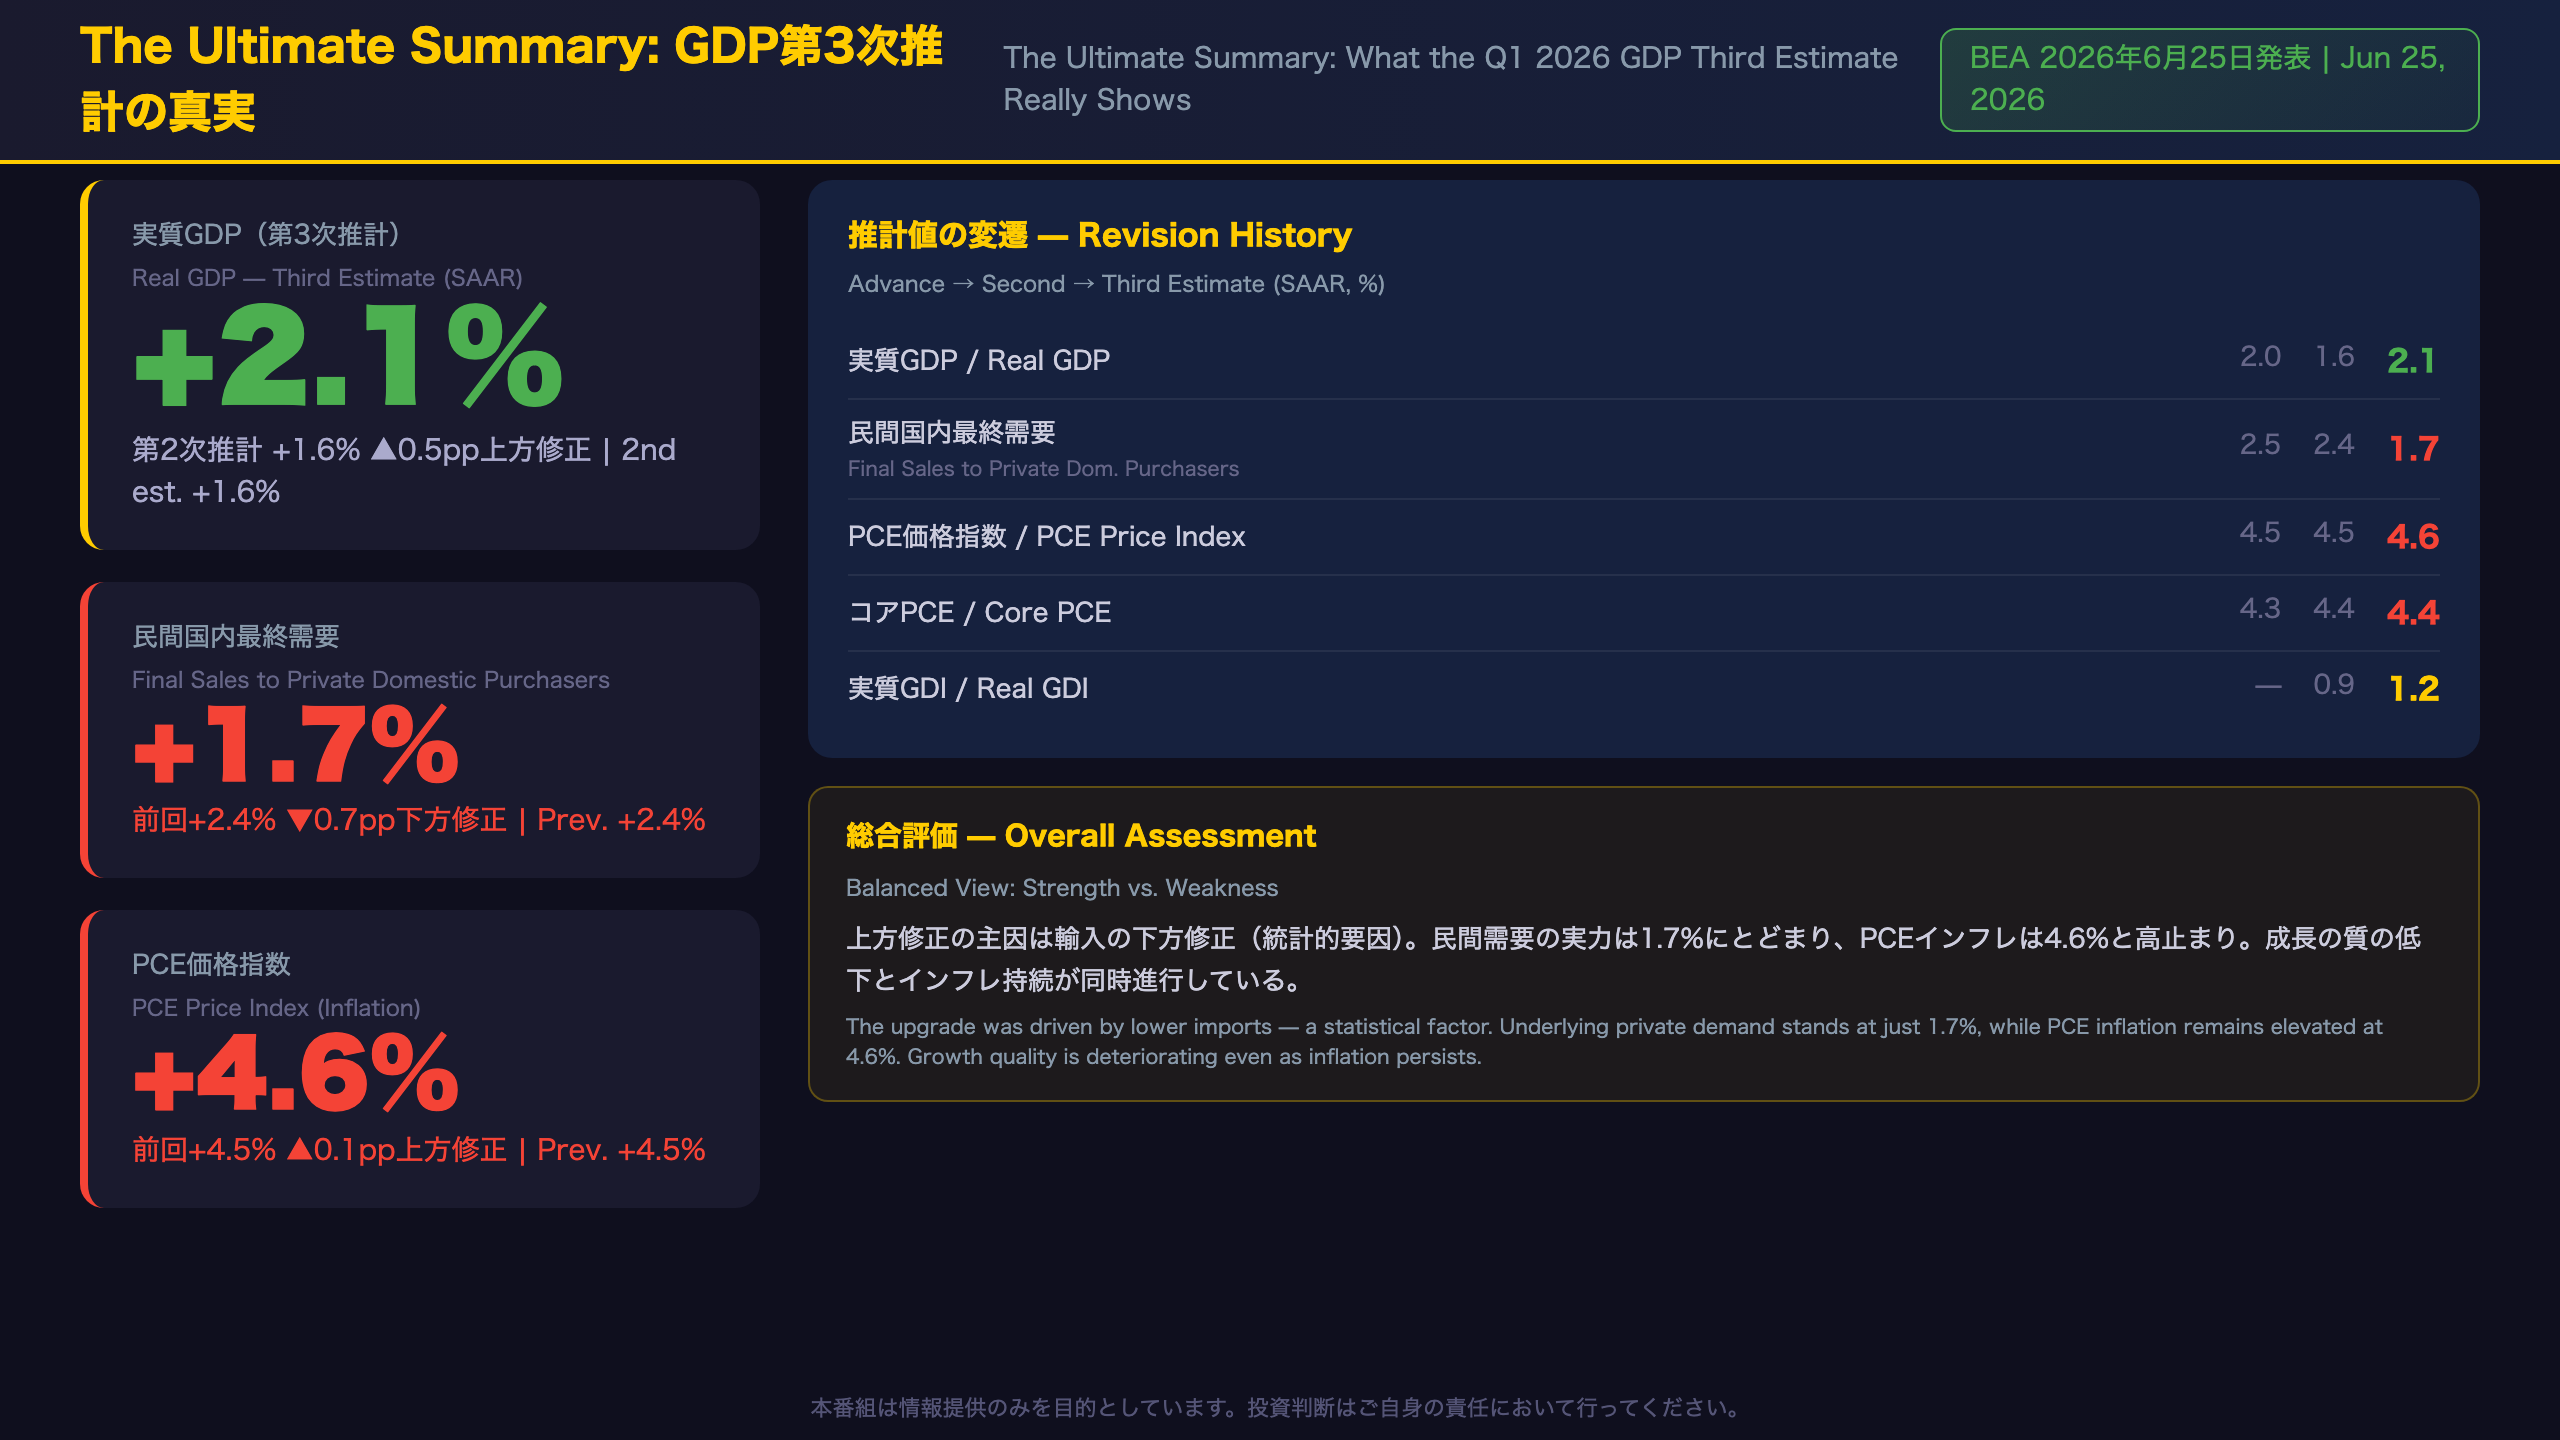
BEA’s third estimate for Q1 2026 GDP came in at +2.1% annualized, up 0.5pp from the second estimate of +1.6%. But the upgrade was driven primarily by a downward revision to imports—a statistical artifact—while real final sales to private domestic purchasers were revised sharply down to +1.7% from +2.4%. Meanwhile, the PCE price index rose to 4.6%. We break down what this means for the Fed and US growth outlook.
The Ultimate Summary: GDP +2.1%の真実
US GDP Q1 2026 Third Estimate: The Headline Upgrade Masks Deeper Concerns
What the BEA Released
The Bureau of Economic Analysis (BEA) is the US government agency responsible for producing national economic accounts, including GDP. The “third estimate” is the final of three sequential releases for each quarter, incorporating the most complete source data available. Today’s release revised Q1 2026 real GDP up to +2.1% annualized from the second estimate of +1.6%.
The Revision Table Tells a Different Story
| Measure | Advance | 2nd Est. | 3rd Est. |
|---|---|---|---|
| Real GDP | +2.0% | +1.6% | +2.1% |
| Final Sales to Private Domestic Purchasers | +2.5% | +2.4% | +1.7% |
| PCE Price Index | +4.5% | +4.5% | +4.6% |
| Core PCE (ex. food & energy) | +4.3% | +4.4% | +4.4% |
| Real GDI | — | +0.9% | +1.2% |
Why the Upgrade Is Largely Statistical
According to BEA’s technical notes, the upward revision “primarily reflected a downward revision to imports.” Since imports are subtracted in GDP calculations, lower imports mechanically boost the headline number. This revision stemmed from BEA’s annual update of its International Transactions Accounts (ITAs) — a data methodology update, not evidence of stronger economic activity.
The More Concerning Signal: Private Demand Revised Down Sharply
Real final sales to private domestic purchasers — the sum of consumer spending and gross private fixed investment, and arguably the cleanest measure of underlying demand — was revised down to +1.7% from +2.4% in the second estimate. This 0.7 percentage point cut strips away the noise from inventory swings and trade flows, revealing that the domestic economy’s fundamental momentum is softer than previously thought.
International Context
For comparison, the Fed’s 2% inflation target is measured against PCE. At 4.6%, the PCE price index is running more than double the target. This is broadly analogous to the ECB’s challenge in 2022-23, where headline growth remained positive while inflation forced continued tightening. The US faces a similar policy dilemma heading into Q2 2026.
Next Release
The Q2 2026 advance estimate is scheduled for July 30, 2026. This will be the first quarter to fully capture the economic impact of tariff policy changes, making it a critical data point for assessing whether the US economy is decelerating further.
成長の牽引役:何がGDPを動かしたか
Growth Drivers: An Uneven Expansion Beneath the Surface
Demand-Side Contributions
The ordering of GDP contributors shifted between the second and third estimates. In the second estimate, the order was: exports, investment, consumer spending, government spending. In the third estimate, it became: investment, exports, government spending, consumer spending. Consumer spending dropped to last place, consistent with its downward revision.
Industry-Level Breakdown
BEA’s GDP-by-industry data provides a more granular view of where growth originated:
Top contributors:
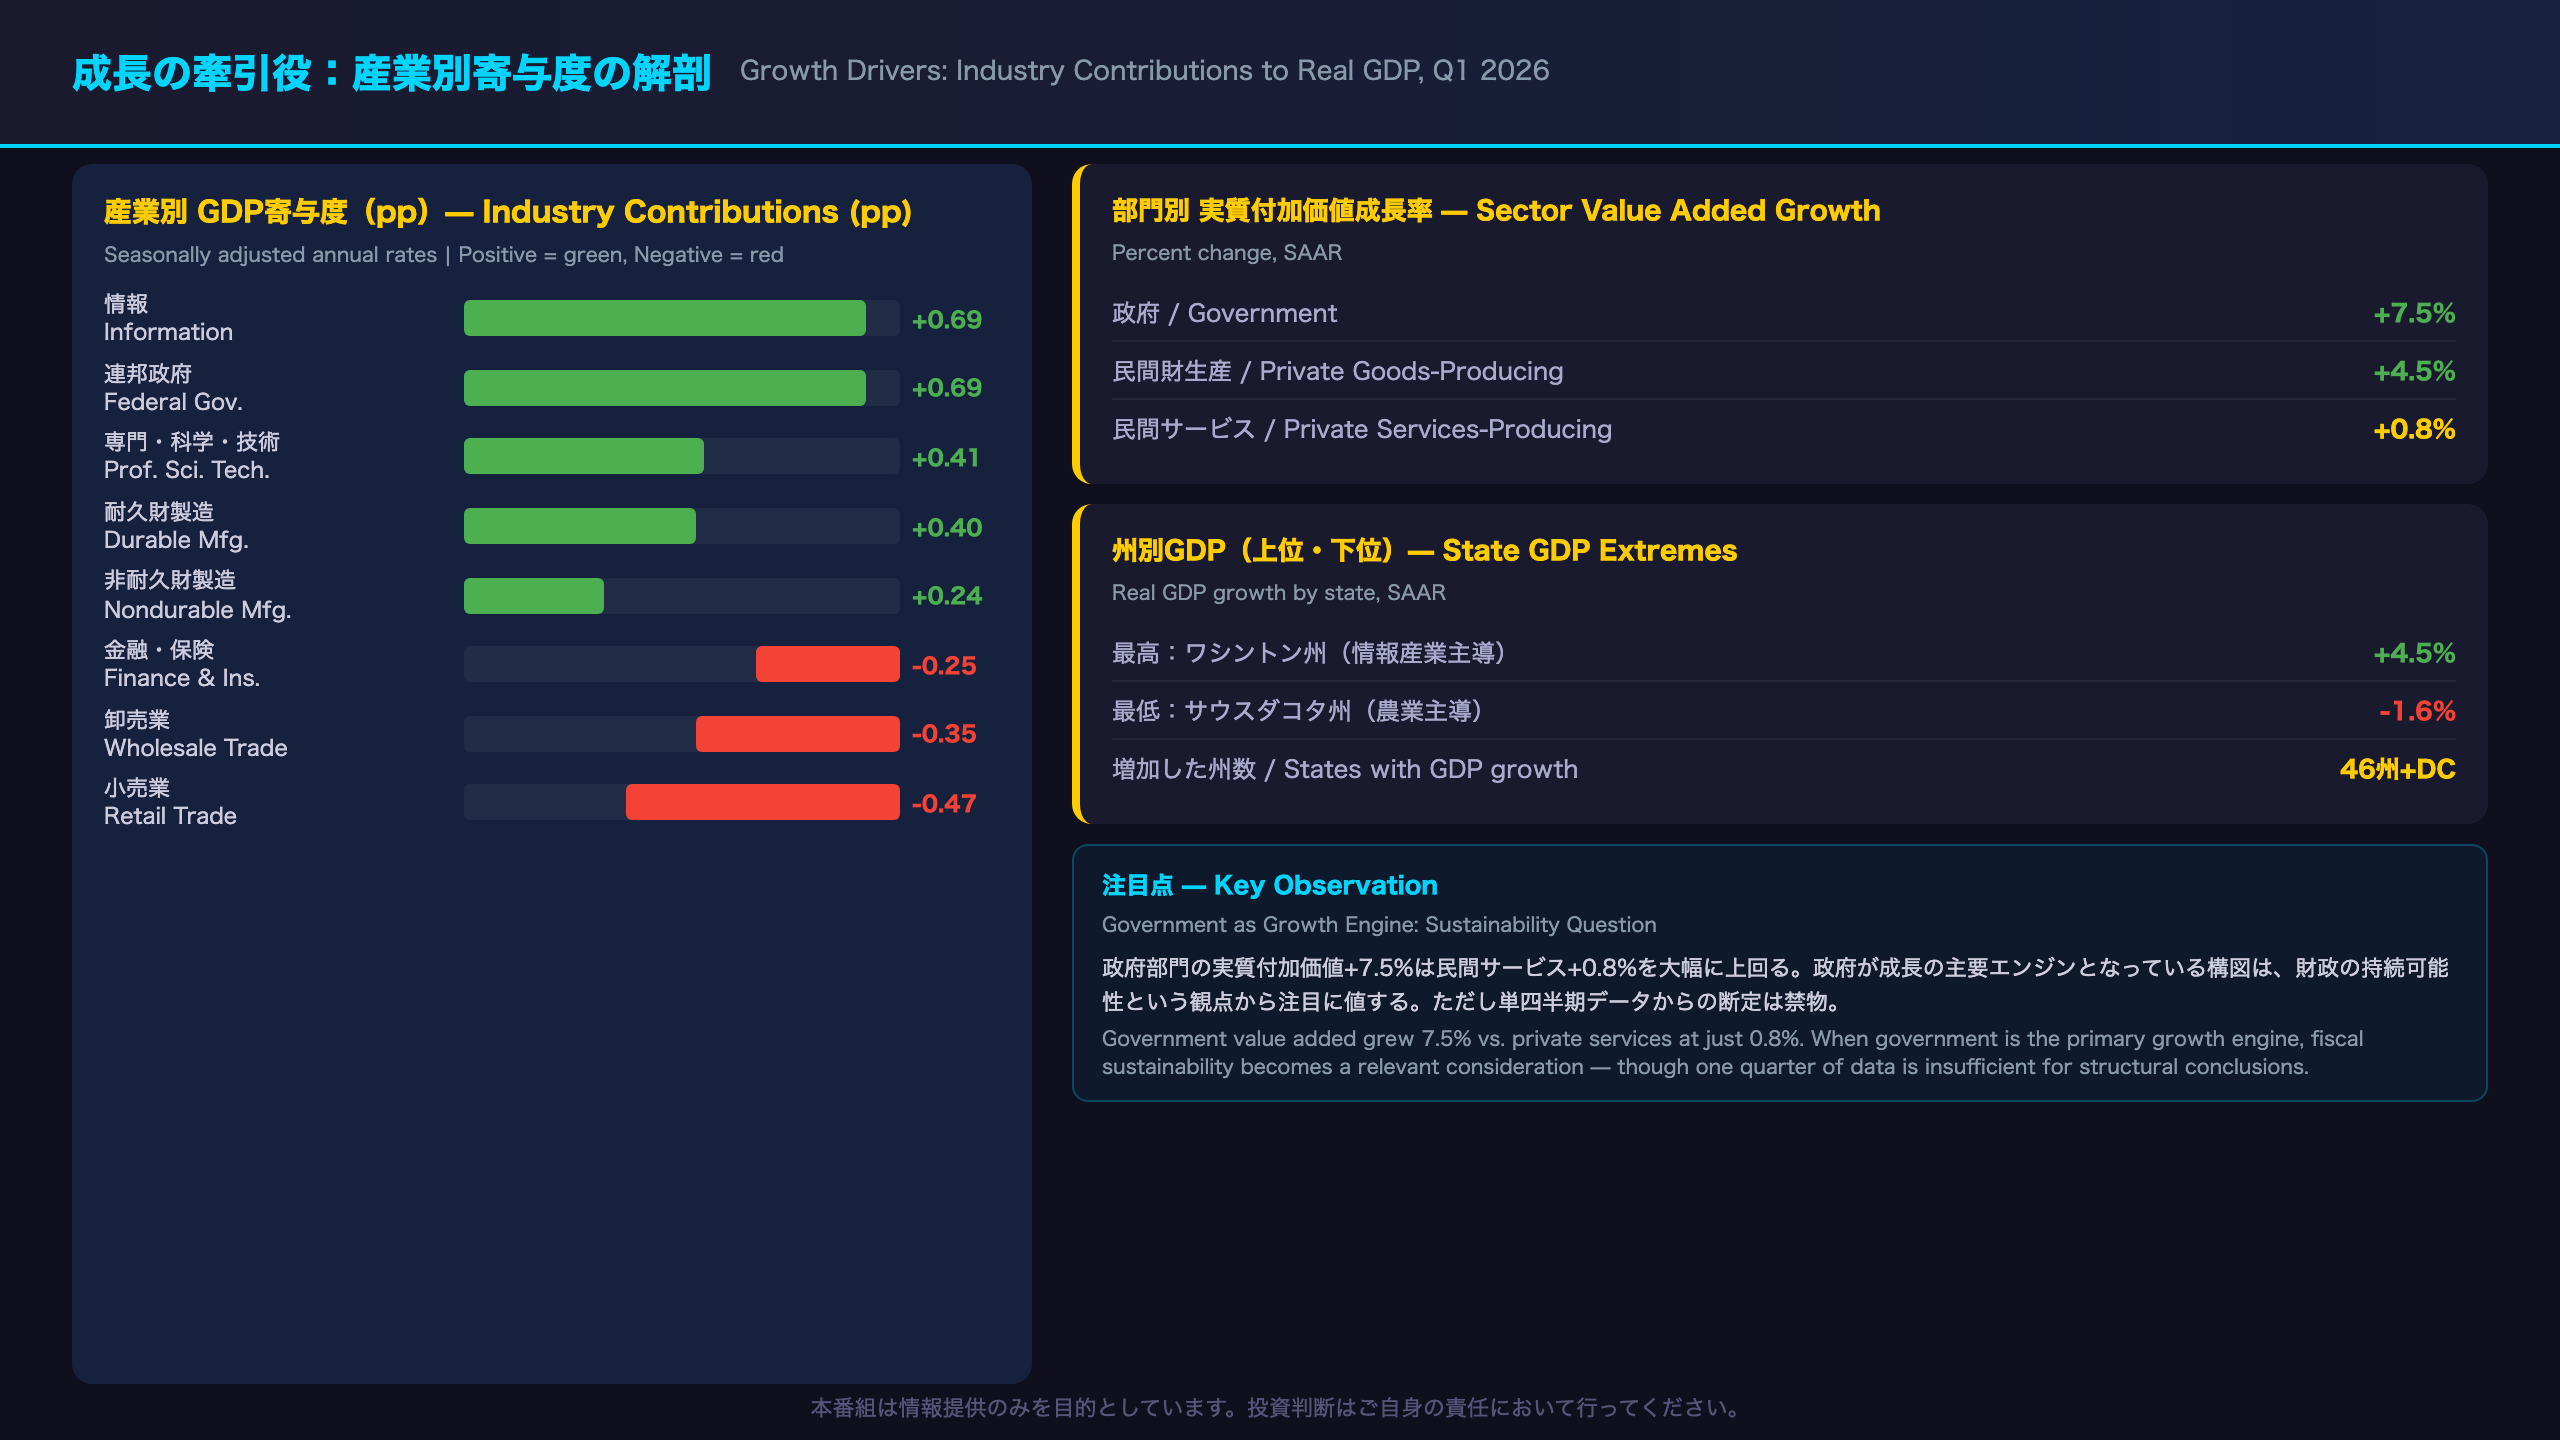
– Information: +0.69pp — driven by tech and digital services, consistent with Washington state’s 4.5% growth rate (the highest in the nation)
– Federal government: +0.69pp — government value added grew 7.5% overall
– Professional, scientific & technical services: +0.41pp
– Durable goods manufacturing: +0.40pp
Largest drags:
– Retail trade: -0.47pp
– Wholesale trade: -0.35pp
– Finance & insurance: -0.25pp
The Government Growth Question
Government real value added grew 7.5% — far outpacing private goods-producing industries (+4.5%) and private services (+0.8%). When government is a primary growth engine, it raises questions about the sustainability of expansion, since government spending is ultimately funded by taxation or borrowing. That said, one quarter of data is insufficient to draw structural conclusions.
Retail and Wholesale Simultaneous Decline
The simultaneous negative contributions from both retail (-0.47pp) and wholesale trade (-0.35pp) may suggest pressure on domestic distribution channels. Whether this reflects temporary inventory adjustments or a more durable demand shift requires monitoring across multiple quarters.
Regional Divergence
Real GDP increased in 46 states and DC. Washington state led at +4.5% (driven by information), while South Dakota contracted at -1.6% (led by agriculture). This regional divergence underscores that the aggregate GDP figure masks significant variation in economic conditions across the country.
国内最終需要の実力:ノイズを除いた経済の体温
Underlying Demand: Three Consecutive Downward Revisions Signal Consumer Softening
The “Clean” Demand Measure
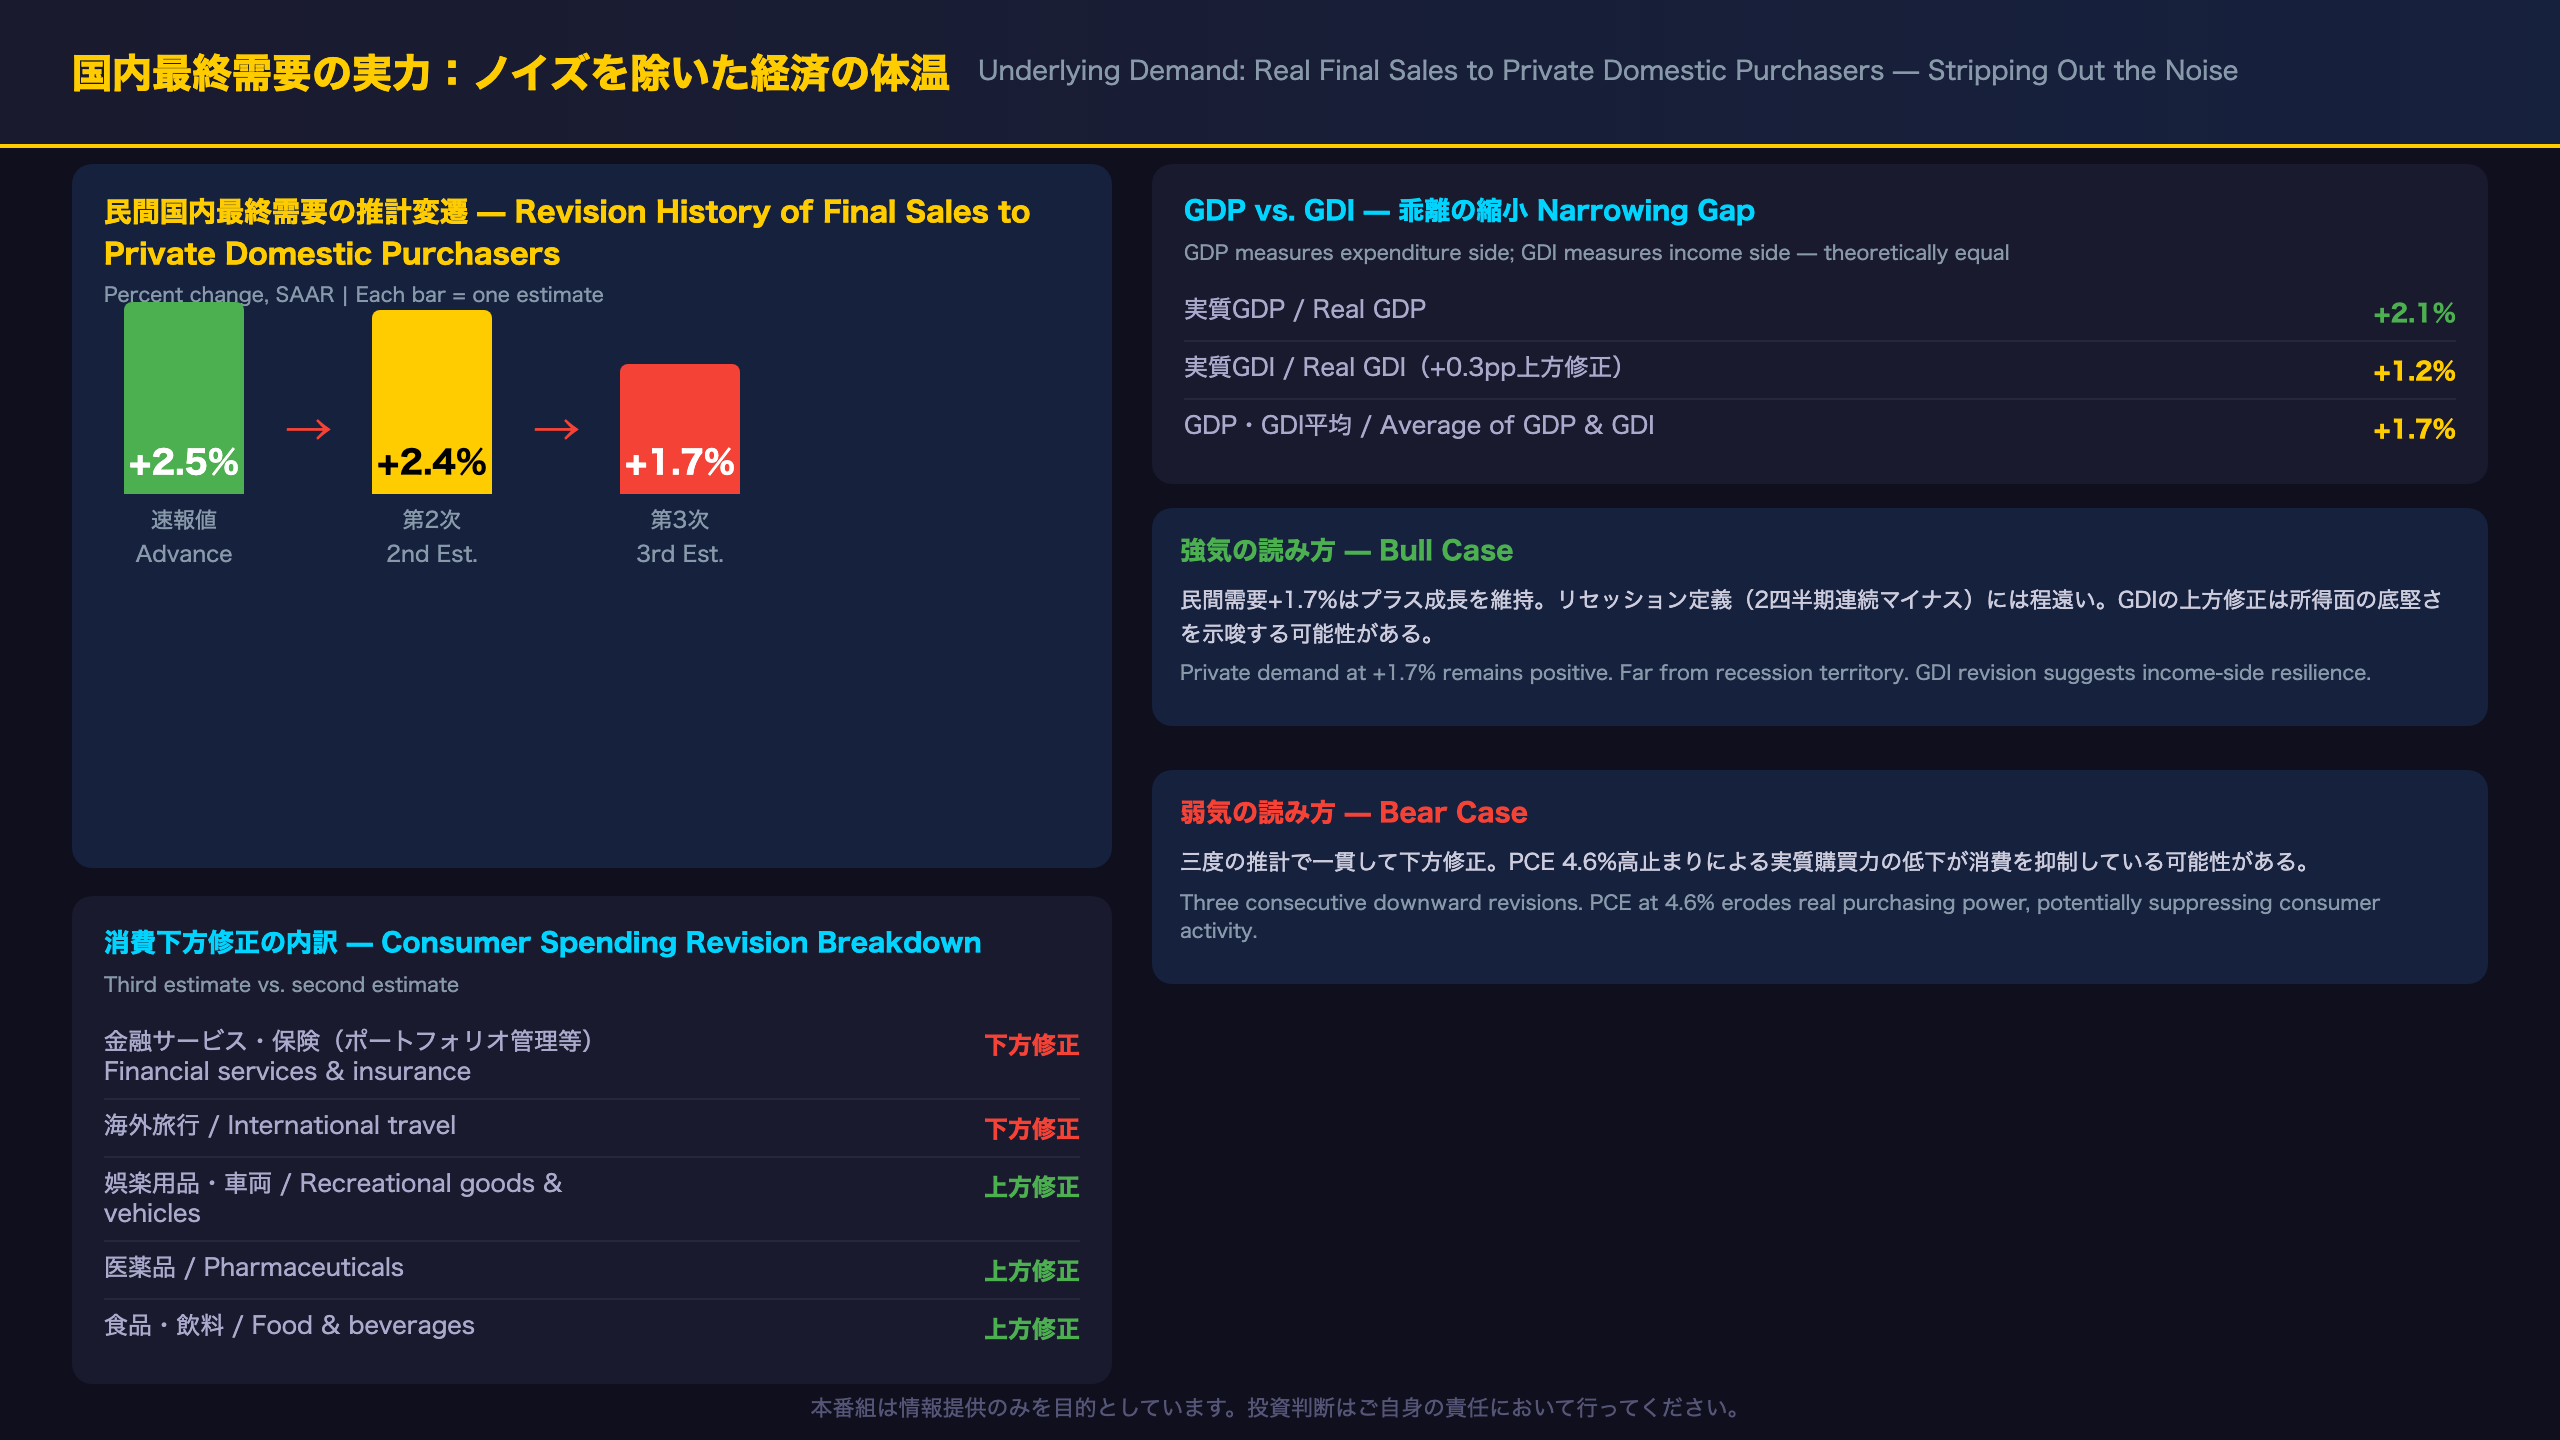
Real final sales to private domestic purchasers — the sum of consumer spending and gross private fixed investment — is widely regarded as the cleanest measure of domestic economic momentum because it excludes the volatile effects of inventory changes and net exports. Here’s how it evolved across the three estimates:
| Estimate | Final Sales to Private Dom. Purchasers |
|---|---|
| Advance | +2.5% |
| Second | +2.4% |
| Third | +1.7% |
The cumulative downward revision of 0.8 percentage points across three estimates is notable. Each successive estimate incorporated more complete source data, and each time the picture of underlying demand became softer.
What Drove the Consumer Spending Revision Down
According to BEA’s technical notes, the downward revision to consumer spending in the third estimate primarily reflected:
- Financial services and insurance: Specifically portfolio management and investment advice, revised down based on newly available Census Bureau Quarterly Services Survey data
- International travel: Revised down based on updated International Transactions Accounts (ITA) data
Partially offsetting these were upward revisions to goods spending, including recreational goods and vehicles, pharmaceuticals, and food and beverages.
GDP vs. GDI: A Narrowing Gap
Real GDI (Gross Domestic Income) — which measures the economy from the income side rather than the expenditure side — was revised up to +1.2% from +0.9%. The GDP-GDI average improved to +1.7% from +1.3%. In theory, GDP and GDI should be equal; in practice they diverge due to measurement differences. The narrowing gap is a modestly positive signal for statistical consistency.
Bull vs. Bear Interpretation
Bull case: Private demand at +1.7% remains positive. The US economy is far from the technical definition of recession (two consecutive quarters of negative GDP growth). GDI’s upward revision suggests income-side resilience.
Bear case: Three consecutive downward revisions to the cleanest demand measure suggest the economy’s underlying momentum is weaker than initially reported. With PCE inflation at 4.6%, real purchasing power is being eroded, which could be suppressing consumer activity. The question is whether this is a temporary soft patch or the beginning of a more sustained deceleration.
インフレ指標:PCE 4.6%が示す高温継続
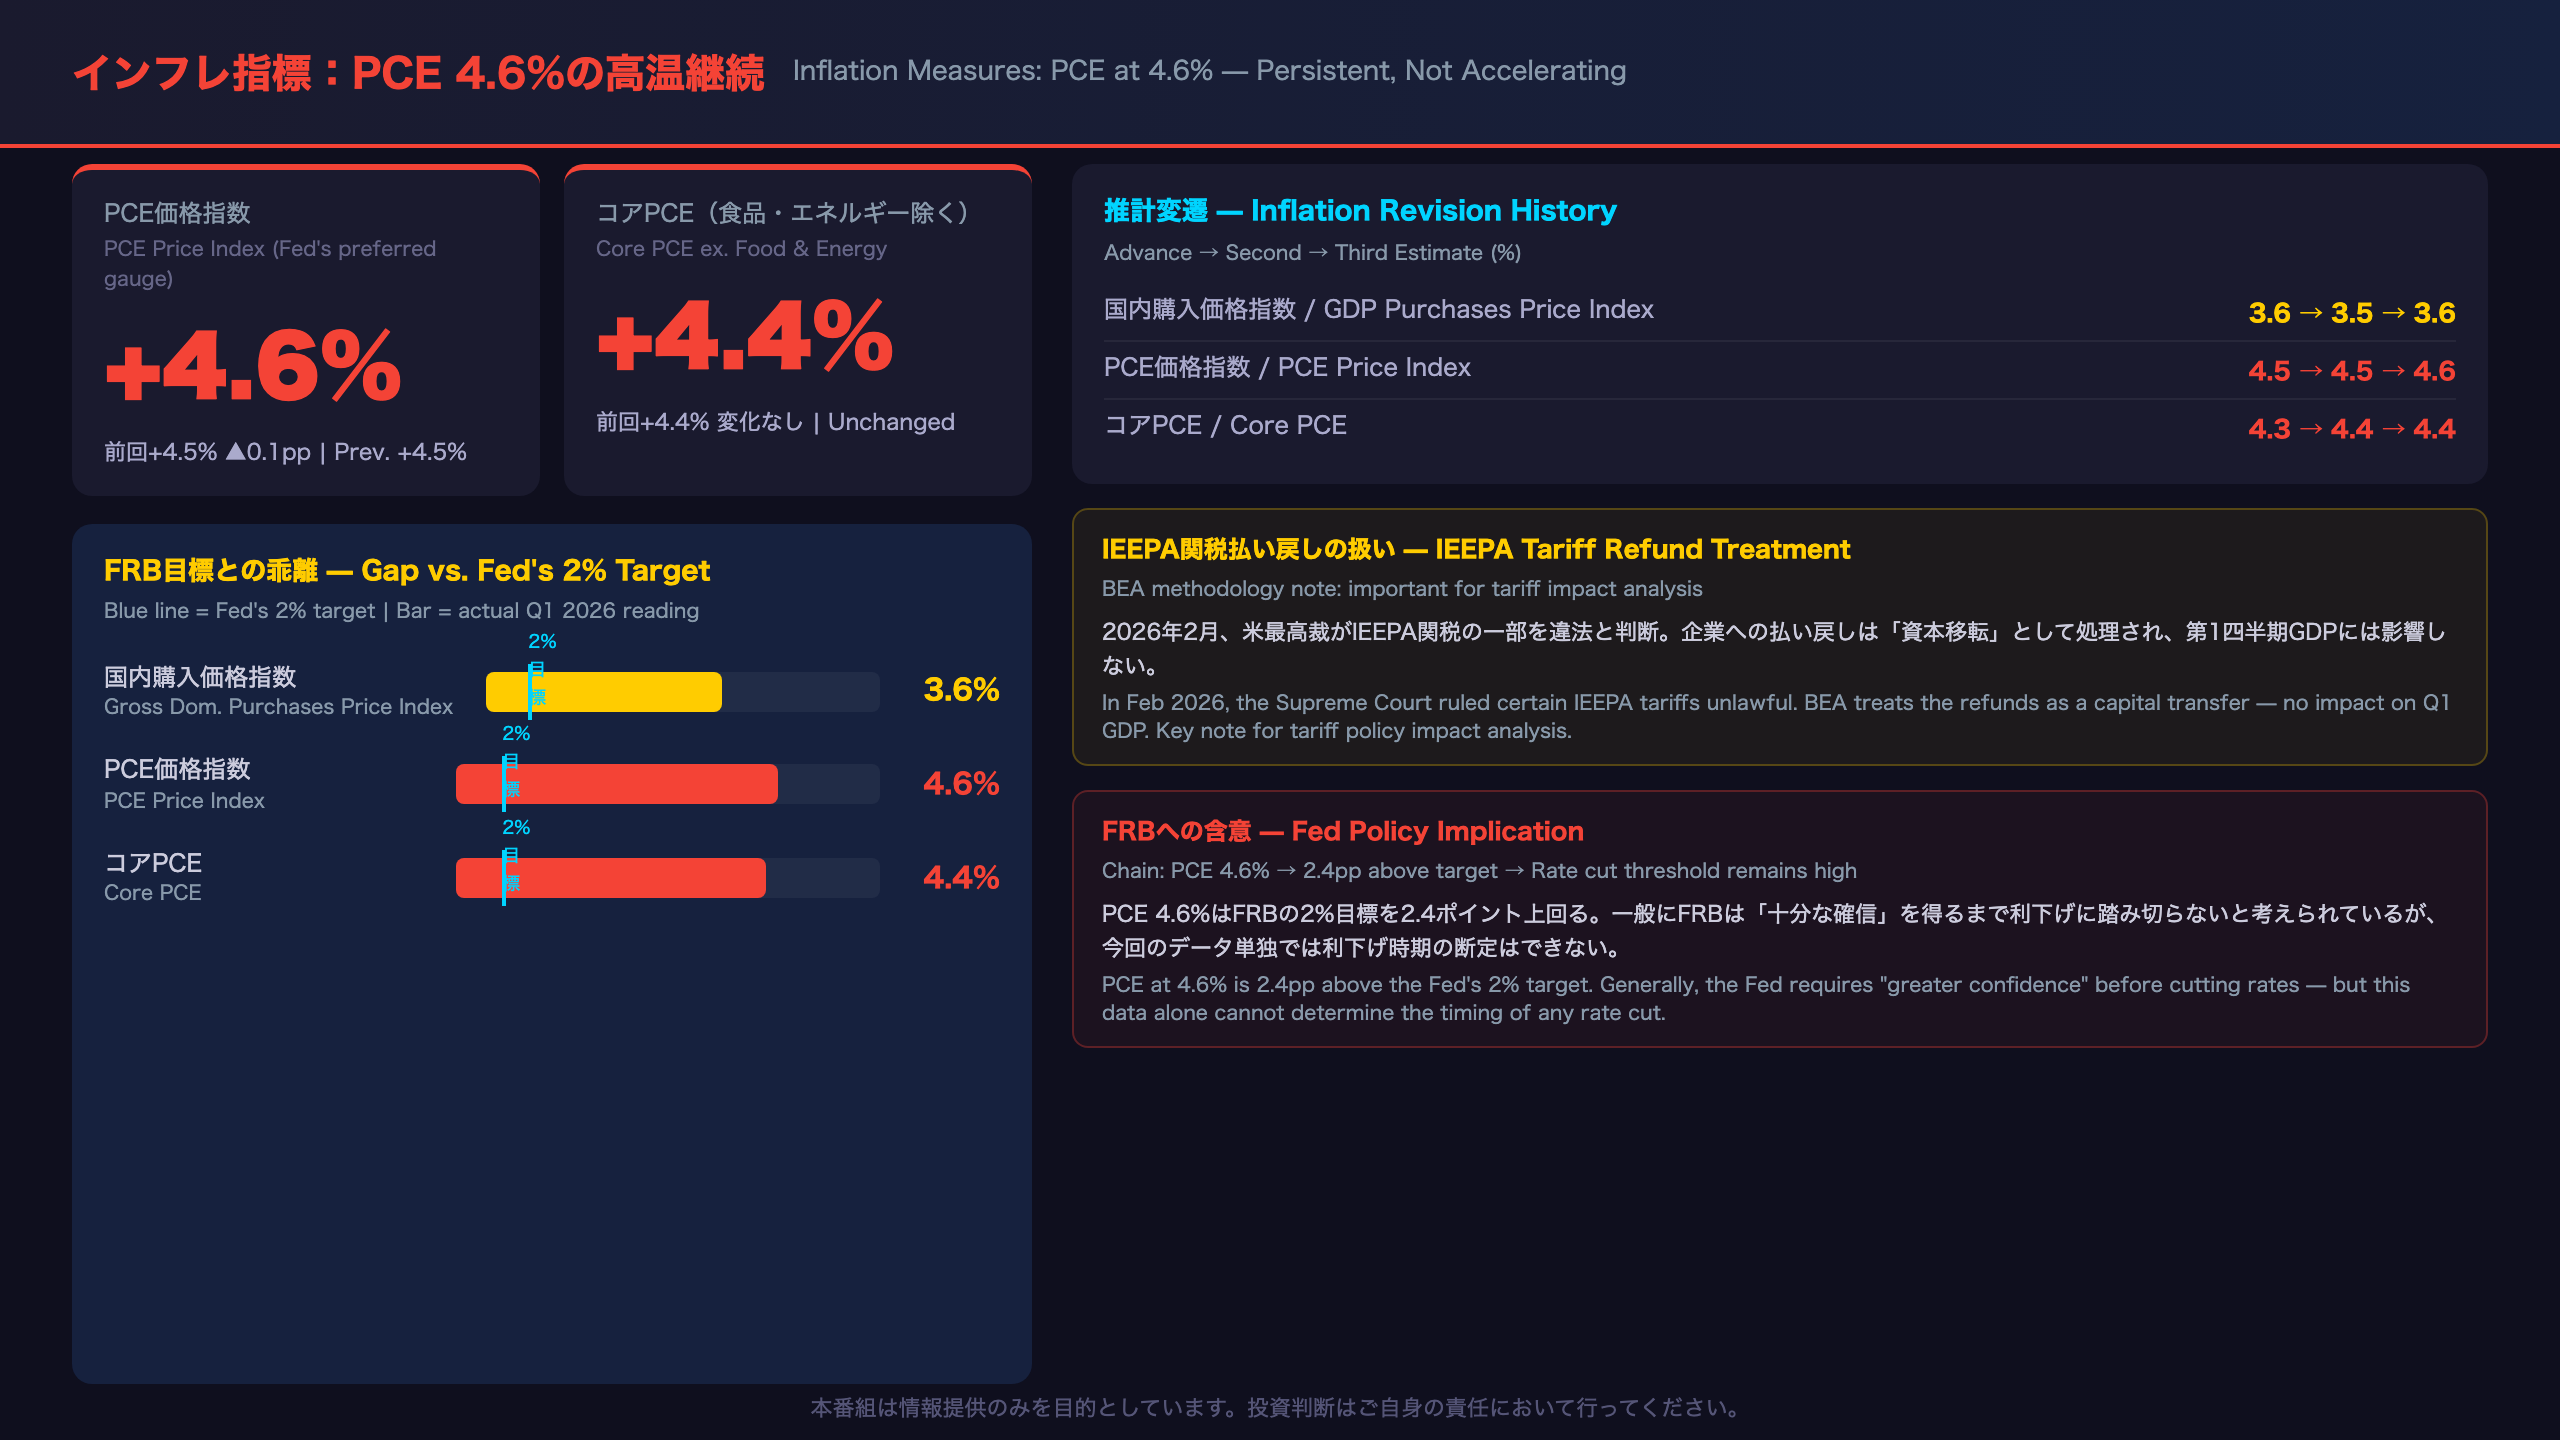
Inflation Deep Dive: PCE at 4.6% — Persistent, Not Accelerating
The Fed’s Preferred Inflation Gauge
The PCE (Personal Consumption Expenditures) price index is the Federal Reserve’s primary inflation benchmark, preferred over CPI because it better captures substitution effects in consumer spending. The Q1 2026 GDP report contains quarterly PCE data, which differs from the monthly PCE releases but provides important context.
Inflation Measures — Revision History
| Measure | Advance | 2nd Est. | 3rd Est. |
|---|---|---|---|
| Gross Domestic Purchases Price Index | +3.6% | +3.5% | +3.6% |
| PCE Price Index | +4.5% | +4.5% | +4.6% |
| Core PCE (ex. food & energy) | +4.3% | +4.4% | +4.4% |
Context: How Does 4.6% PCE Compare?
At 4.6%, the PCE price index is running more than double the Fed’s 2% target. For context, the Fed began its rate-hiking cycle in 2022 precisely to combat elevated PCE inflation. The persistence of PCE above 4% in Q1 2026 suggests that the disinflationary process has stalled or reversed.
The IEEPA Tariff Refund: A Notable Footnote
BEA’s technical notes include an important clarification: in February 2026, the US Supreme Court ruled that certain tariffs imposed under the International Emergency Economic Powers Act (IEEPA) were unlawful, requiring the federal government to refund affected businesses. BEA treats these refunds as a capital transfer, meaning they do not affect Q1 GDP. This is a significant methodological note for investors tracking the economic impact of tariff policy changes.
Bull vs. Bear on Inflation
Bull case: Core PCE held steady at 4.4% — no acceleration. The gross domestic purchases price index (3.6%) is notably lower than PCE (4.6%), suggesting import price effects may be amplifying the PCE reading. If import prices normalize, PCE could moderate.
Bear case: PCE was revised up to 4.6% in the third estimate. With a 2.4 percentage point gap between core PCE and the Fed’s 2% target, achieving the “greater confidence” threshold the Fed requires before cutting rates remains a high bar. The combination of slowing growth and sticky inflation is the definition of a stagflationary environment.
企業収益と所得:経済の所得面からの検証
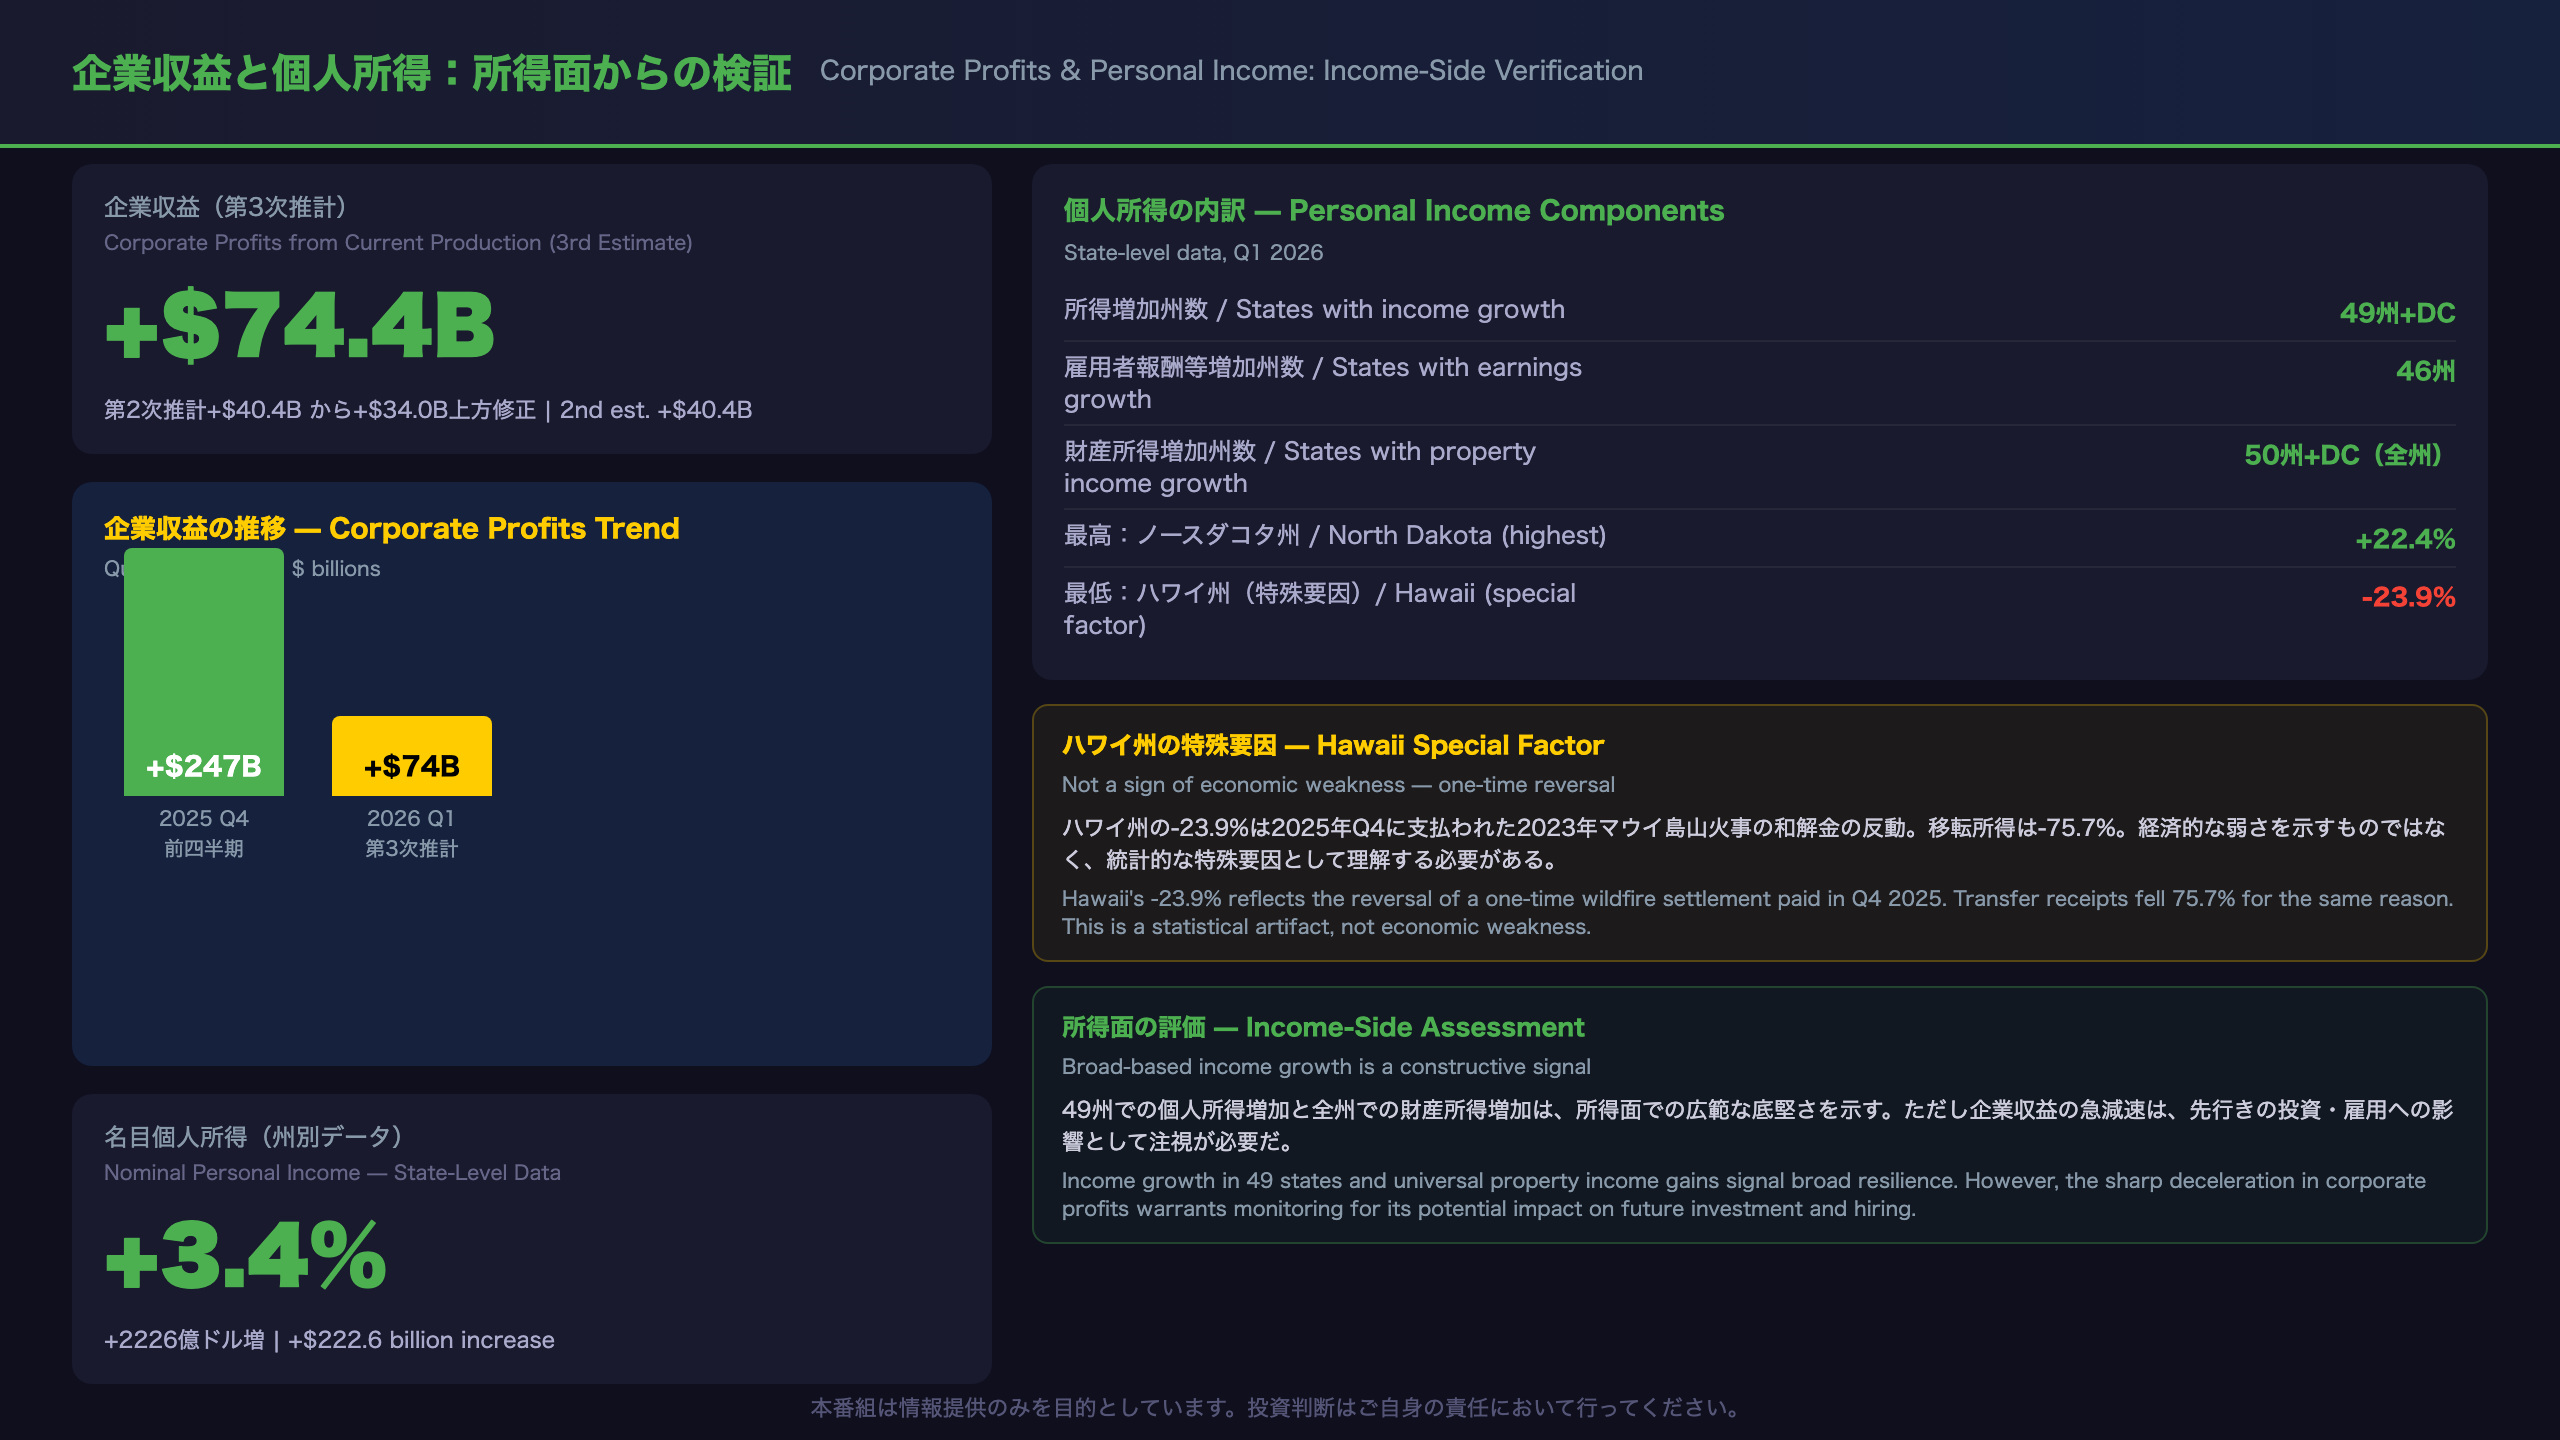
Corporate Profits and Personal Income: Income-Side Verification of Economic Health
Corporate Profits: Sharp Deceleration Despite Upward Revision
Corporate profits from current production (with inventory valuation and capital consumption adjustments) tell an important story about business-sector health:
| Period | Change |
|---|---|
| Q4 2025 | +$246.9 billion |
| Q1 2026 (2nd estimate) | +$40.4 billion |
| Q1 2026 (3rd estimate) | +$74.4 billion (+$34.0B revision) |
While the third estimate revised profits up by $34 billion, the Q1 figure still represents a dramatic deceleration from Q4 2025’s $246.9 billion gain. Corporate profit growth slowing from $247B to $74B quarter-over-quarter is a notable development that could influence business investment and hiring decisions going forward — though one quarter of data is insufficient to declare a structural trend.
Personal Income: Broad-Based Resilience Across States
State-level personal income data provides a granular view of household financial health. In Q1 2026:
– Total nominal personal income: +3.4% annualized (+$222.6 billion)
– States with income growth: 49 states + DC
– Earnings (compensation + proprietors’ income): Rose in 46 states
– Property income (dividends, interest, rent): Rose in all 50 states + DC
The near-universal increase in property income across all states reflects the elevated interest rate environment, which has boosted interest income for savers and fixed-income investors.
The Hawaii Anomaly: A Statistical Special Factor
Hawaii’s personal income fell 23.9% annualized — the largest decline of any state. This is entirely explained by a special factor: a wildfire settlement payment related to the 2023 Maui wildfire was made in Q4 2025, creating a high base that reversed sharply in Q1 2026. Transfer receipts in Hawaii fell 75.7% for the same reason. This should not be interpreted as economic weakness in Hawaii.
North Dakota’s Surge
North Dakota led all states with 22.4% personal income growth and 34.7% earnings growth. BEA does not provide a detailed explanation in this release, but the state’s energy sector (oil and gas) is a likely contributor given commodity price dynamics in Q1 2026.
インプリケーション:FRBの政策判断と次の焦点
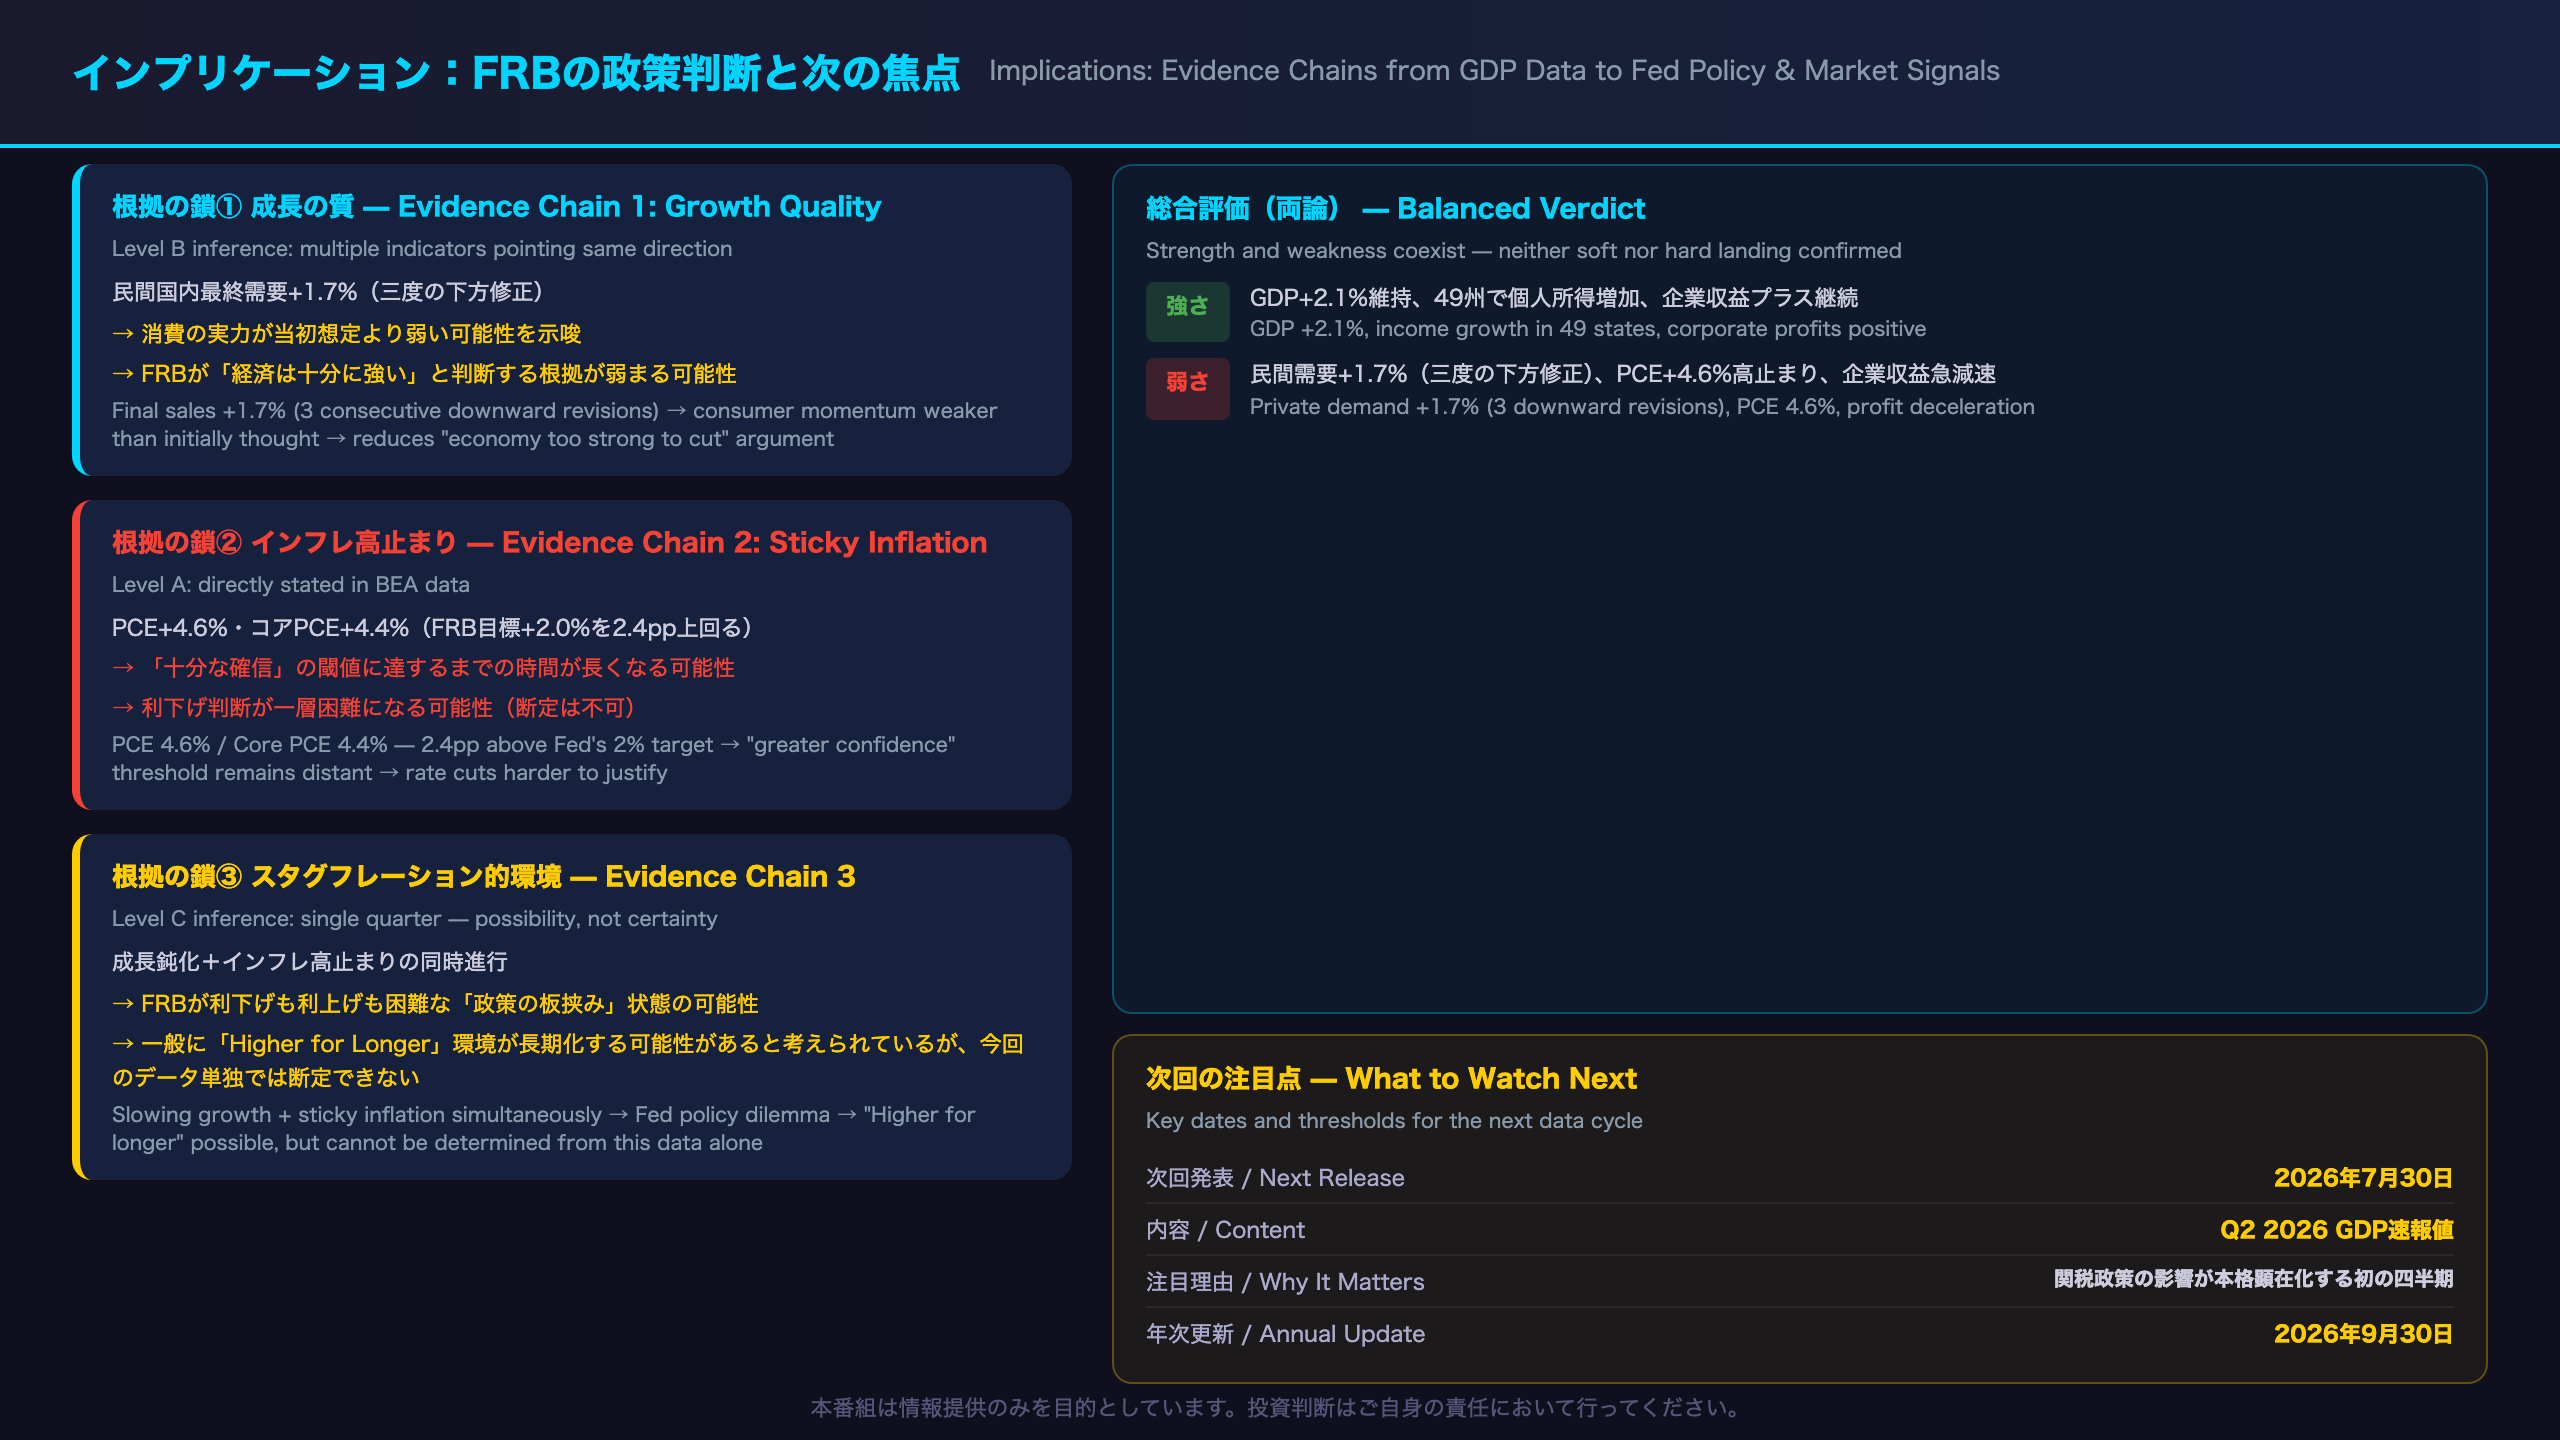
Implications: The Evidence Chain from GDP Data to Market Signals
Evidence Chain 1: Growth Quality → Fed Policy
[Real final sales to private domestic purchasers at +1.7%, revised down three times] → [Underlying consumer momentum weaker than initially reported] → [Reduces the argument that the economy is “too strong” to cut rates]
However, +1.7% remains positive growth — far from recessionary territory. This chain suggests potential pressure toward rate cuts, but the simultaneous inflation persistence creates an opposing force. A simple rate-cut narrative is not supported by this data alone.
Evidence Chain 2: Inflation Persistence → Fed Policy
[PCE at 4.6%, core PCE at 4.4%] → [2.4 percentage point gap vs. Fed’s 2% target persists] → [The “greater confidence” threshold for rate cuts remains distant]
Generally, the Fed is understood to require sustained progress toward 2% inflation before cutting rates. However, the timing of any rate action cannot be determined from this data alone.
Evidence Chain 3: Stagflationary Backdrop → Market Implications
[Slowing growth (private demand +1.7%) + sticky inflation (PCE +4.6%) simultaneously] → [Fed faces a policy dilemma: cutting risks re-igniting inflation; holding risks deeper slowdown] → [“Higher for longer” rate environment may persist]
This is a Level C inference (single quarter of data) — it represents a possibility, not a certainty. It is generally considered that stagflationary environments are challenging for both equities (margin pressure from costs) and bonds (inflation keeps yields elevated), but this data alone cannot determine market direction.
Key Dates and Thresholds to Watch
- Next release: July 30, 2026 — Q2 2026 advance GDP estimate
- Why it matters: Q2 2026 will be the first quarter to fully capture the economic impact of tariff policy changes
- Scenario threshold: If real final sales to private domestic purchasers falls below +1.0%, recession risk discussions may intensify — though this is a general heuristic, not a direct inference from today’s data
- Annual update: September 30, 2026 — BEA’s annual update of national, industry, and regional accounts will revise historical GDP data
The Balanced Verdict
The US economy in Q1 2026 shows genuine resilience (positive GDP growth, broad-based income gains, corporate profits remaining positive) alongside genuine concerns (deteriorating growth quality, PCE inflation well above target, corporate profit deceleration). Neither a “soft landing” nor a “hard landing” narrative is definitively supported by this single quarter’s data.
Disclaimer: This article is for informational purposes only. All investment decisions are made solely at your own risk.







