📺 Watch the Full Video Analysis
This article was automatically generated by the NFC Market Live AI analysis system. (Updated: 2026-10-05 07:10 JST)
📊 Weekly global bond market review (data as of Oct 5, 2026)
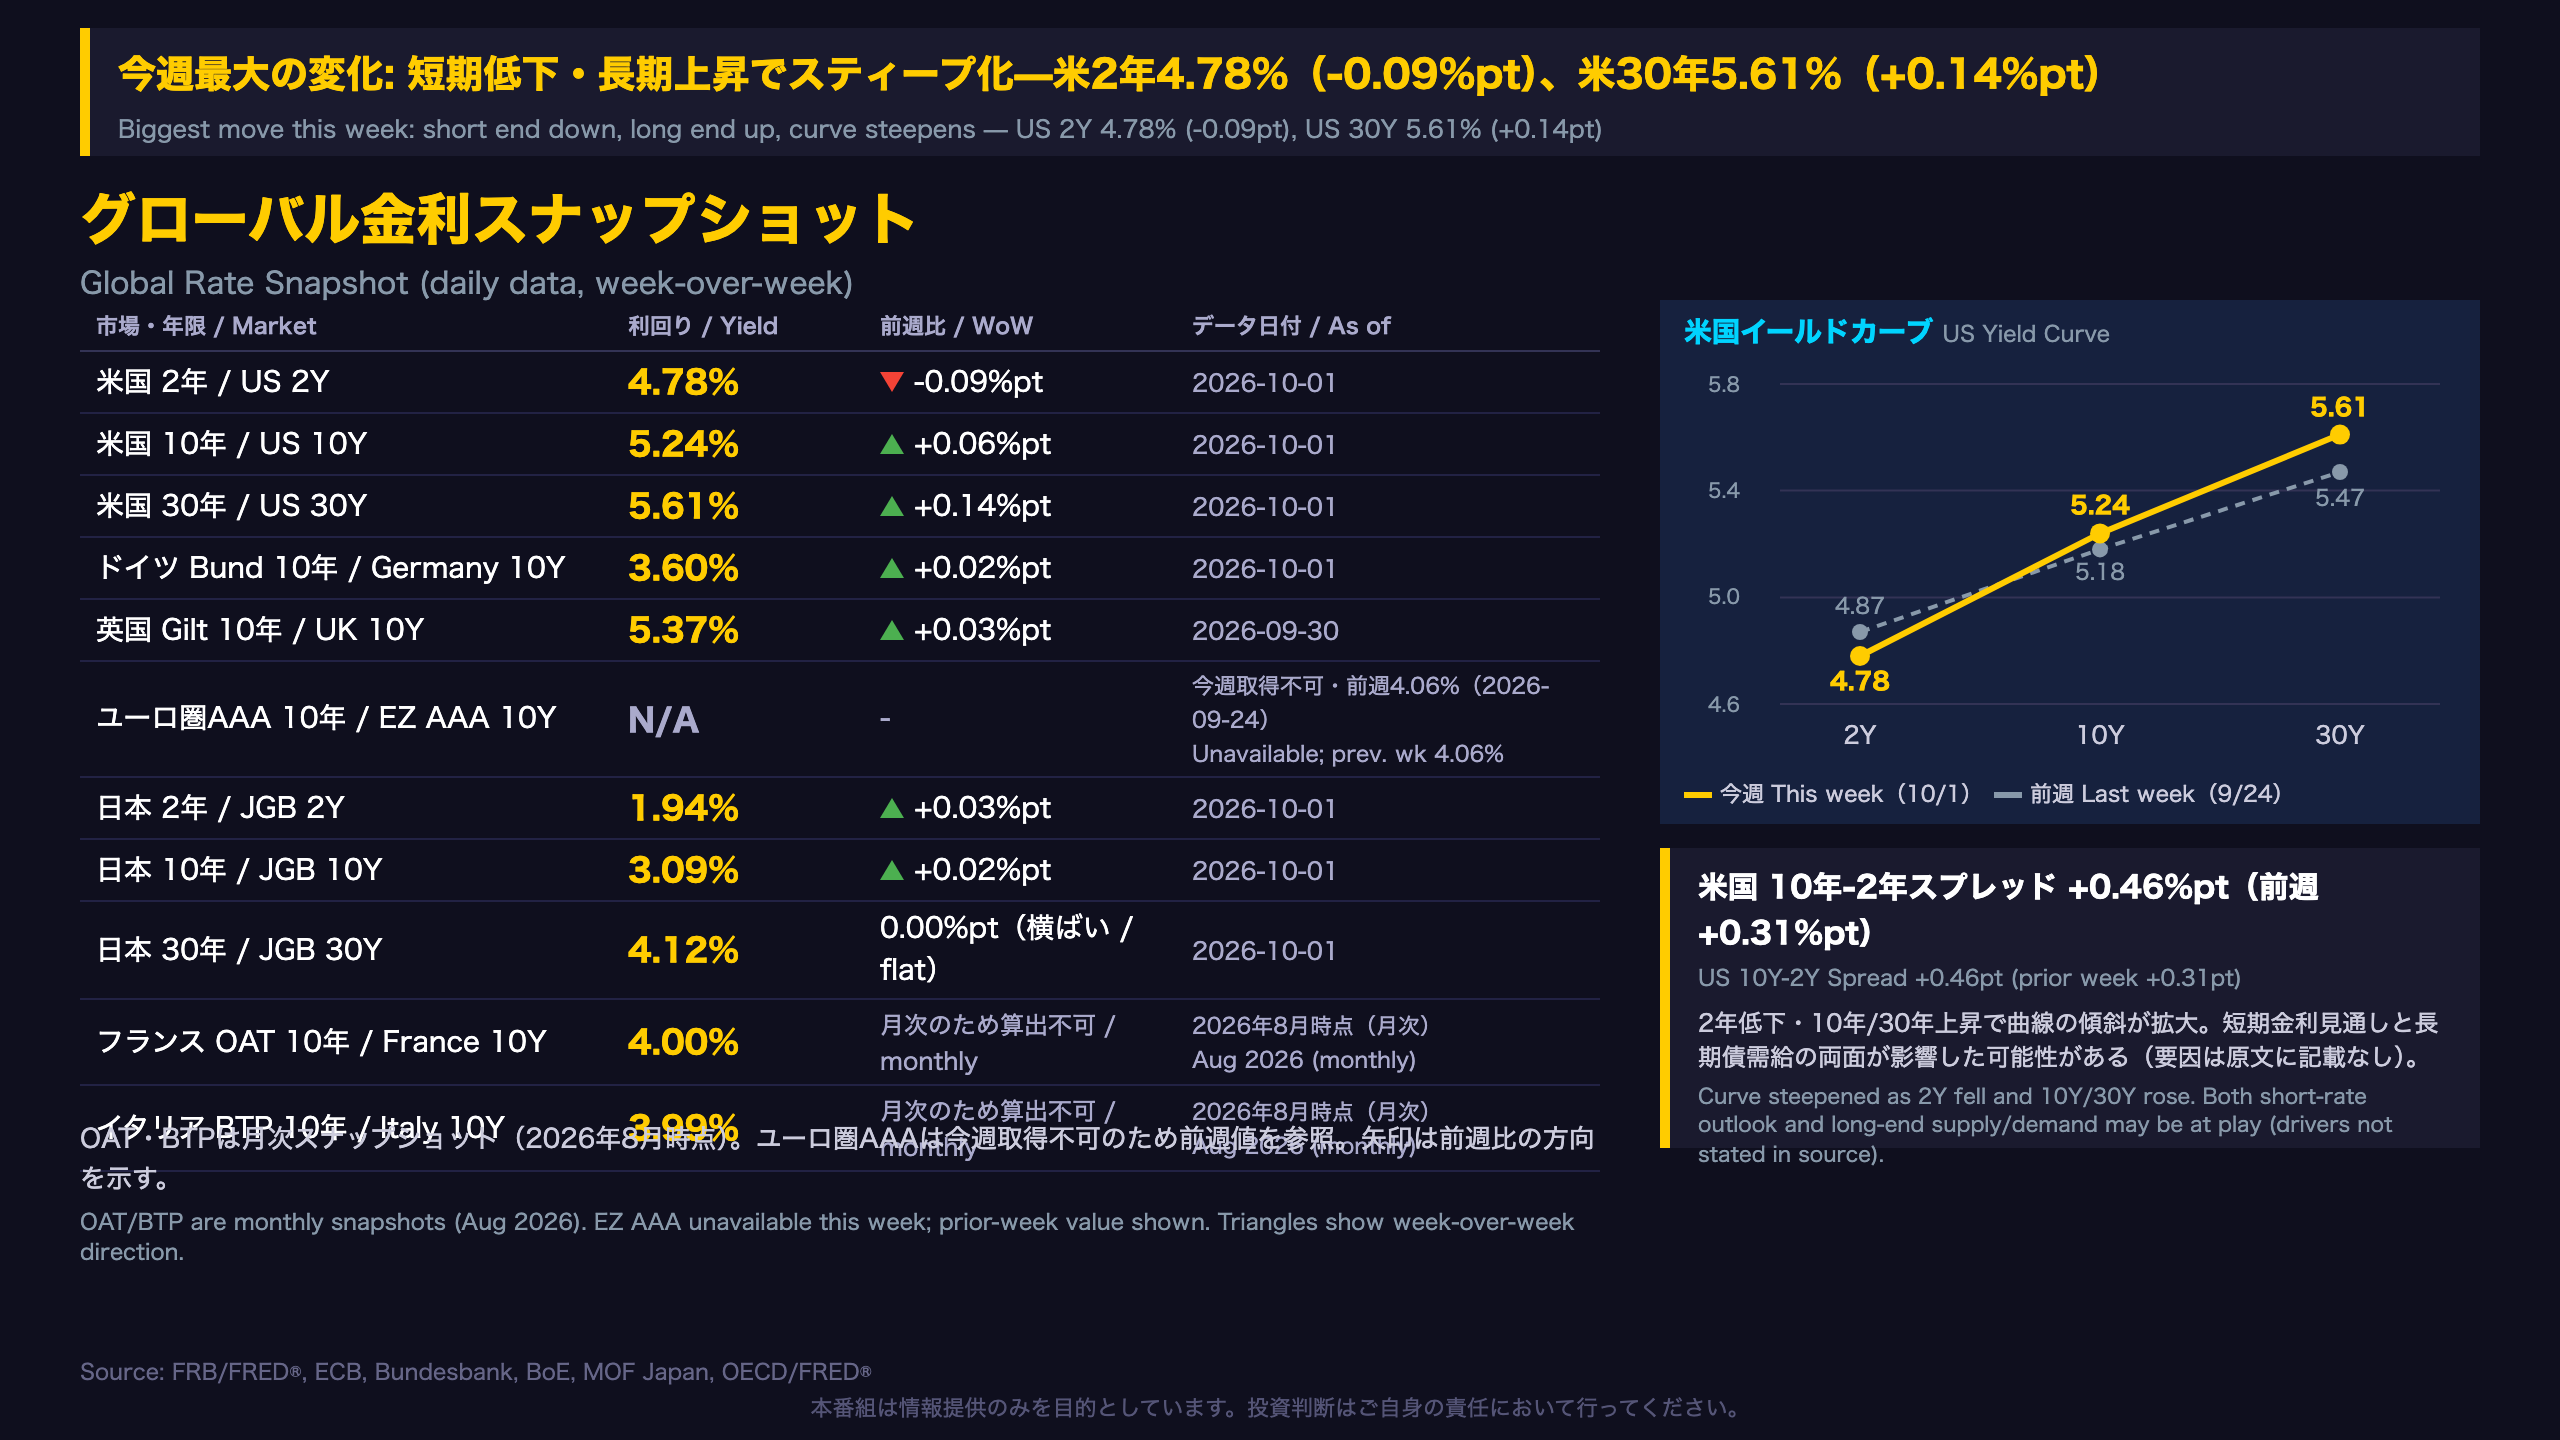
📈 US Treasury yields (as of Oct 1, 2026): 2Y 4.78% (-0.09pt WoW), 10Y 5.24% (+0.06pt), 30Y 5.61% (+0.14pt). The 10Y-2Y spread widened to +0.46pt.
💡 Indirect bidders at the US 4-week bill auction recovered to 56.1% from 39.1%. Japan’s 2Y JGB auction on Sep 30 improved to a bid-to-cover of 3.89.
⚠️ On the other hand, the US 5Y note auction drew just 2.21x, the lowest in three weeks. Euro-area AAA yield was unavailable this week.
🧭 We also link spreads to NFC’s proprietary HMM regimes.
グローバル金利スナップショット
Reading This Week’s Curve: A Steepening Led by the Long End
This weekly review tracks sovereign yields across the U.S., Europe and Japan. U.S. data comes from the Federal Reserve’s H.15 release (via FRED), while Japanese yields come from the Ministry of Finance (MOF).
What changed
- U.S. 2Y: 4.78% (-0.09pt) as of Oct 1, 2026
- U.S. 10Y: 5.24% (+0.06pt)
- U.S. 30Y: 5.61% (+0.14pt)
- 10Y-2Y term spread: +0.46pt, up from +0.31pt a week earlier
Last week’s report showed all three tenors rising (2Y +0.20pt, 10Y +0.24pt, 30Y +0.18pt). This week only the 2Y fell, so the direction split by maturity.
Context for global readers
Japan’s 10Y JGB yield stands at 3.09% (+0.02pt) and the 30Y at 4.12% (unchanged). Japanese yields still sit below U.S. levels, but the gap between them is the core input for yen carry-trade analysis.
Two readings
A falling 2Y yield may reflect softer policy-rate expectations, though the source does not state a cause. A 30Y yield above 5.6% may point to long-end supply/demand or term-premium concerns. Because this rests on a single week of data, we treat both as possibilities rather than conclusions.
Data caveats
The ECB euro-area AAA yield was unavailable this week, and French/Italian yields are monthly OECD snapshots (August 2026).
米国債入札 Deep Dive
Inside the Auctions: Bills Firm, Coupons Soft
The U.S. Treasury (via TreasuryDirect) publishes every auction result. Two gauges matter here: the bid-to-cover ratio (total bids divided by the amount offered) and the indirect bidder share, which includes foreign central banks and other official institutions.
Bills
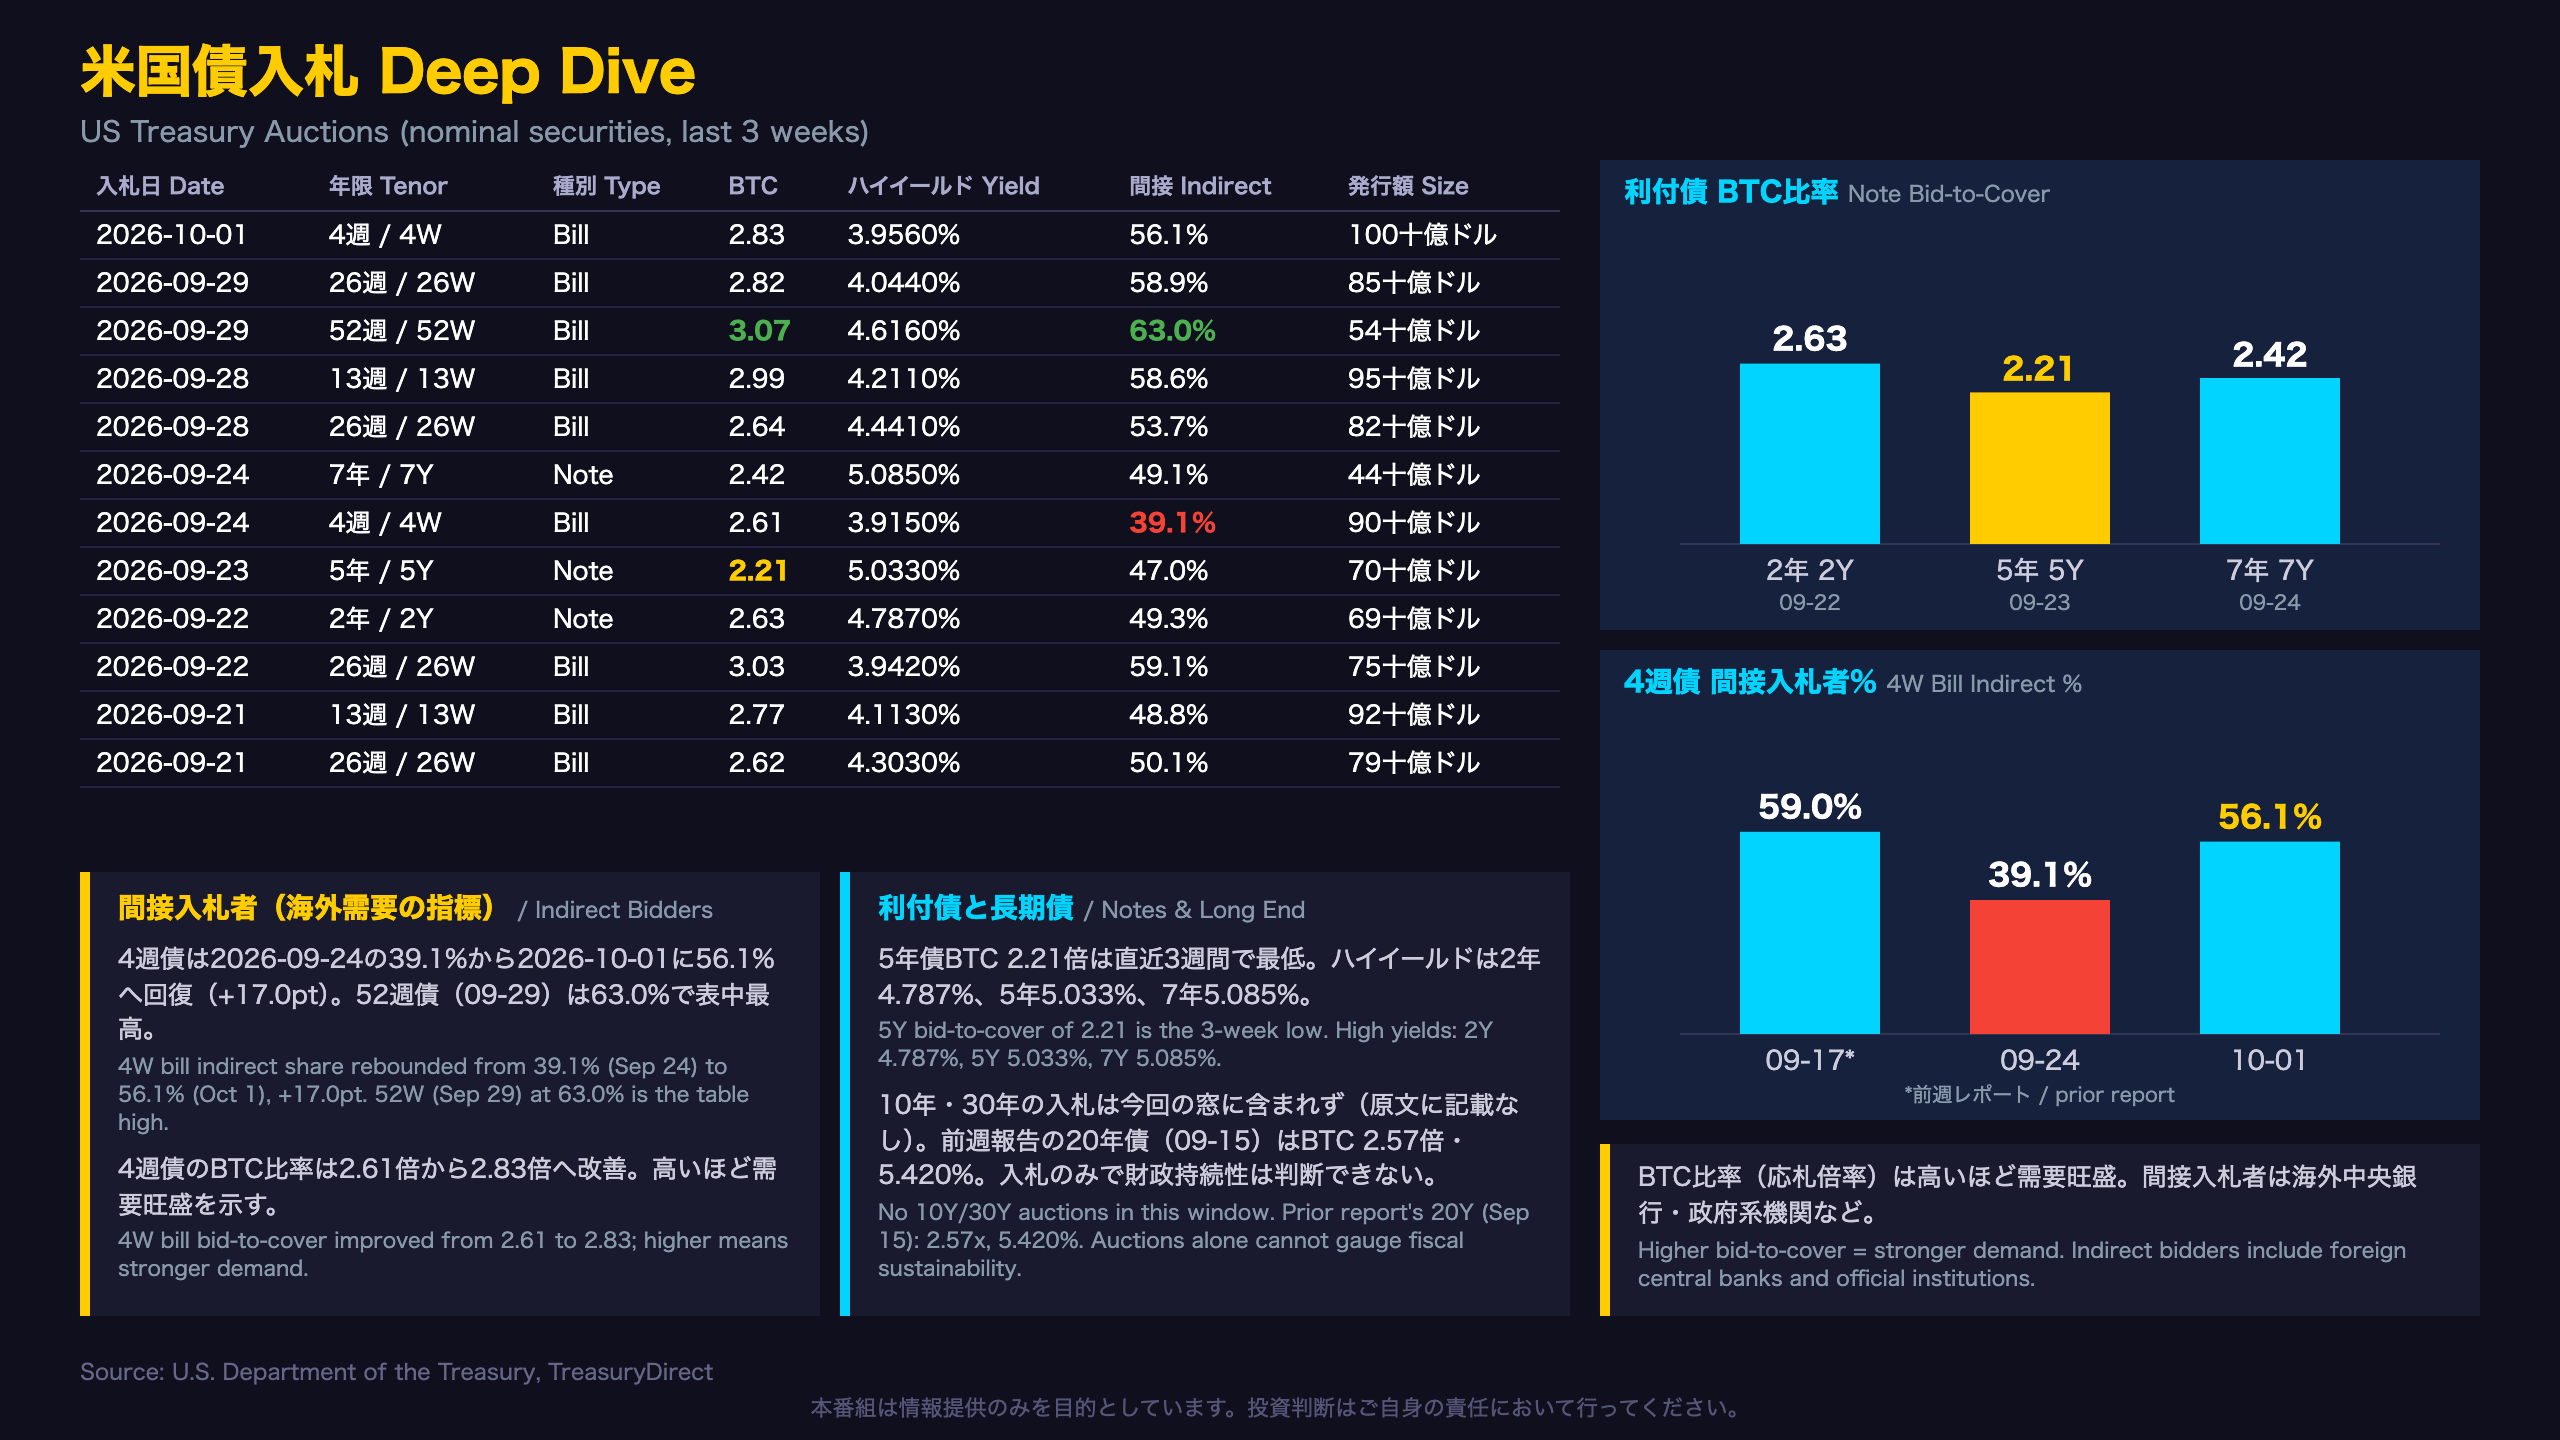
- 4-week bill: indirect share went 59.0% (Sep 17, prior report) to 39.1% (Sep 24) to 56.1% (Oct 1). Bid-to-cover moved 3.02 to 2.61 to 2.83.
- 52-week bill (Sep 29): bid-to-cover 3.07 and indirect share 63.0%, the highest in the table.
- Caveat: 26-week high yields printed 4.441% on Sep 28 and 4.044% on Sep 29, so cross-date comparisons are noisy.
Notes
- 2Y (Sep 22): 2.63x, 4.787%
- 5Y (Sep 23): 2.21x, 5.033%
- 7Y (Sep 24): 2.42x, 5.085%
The prior report’s 20-year bond (Sep 15) came in at 2.57x and 5.420%.
Why it matters
For global investors, weak coupon demand can pressure long yields, while firm bill demand shows foreign appetite for short paper. The source gives no historical average, so we cannot call 2.21x poor in absolute terms. No 10Y or 30Y auctions fall in this window, so fiscal-sustainability conclusions are out of scope. Compared with Japan, where bid-to-cover is computed from applications over accepted amounts, U.S. figures are comparable only in direction.
ヨーロッパ債券市場
European Bonds: Calm Weekly Moves, Thin Data
Who publishes what
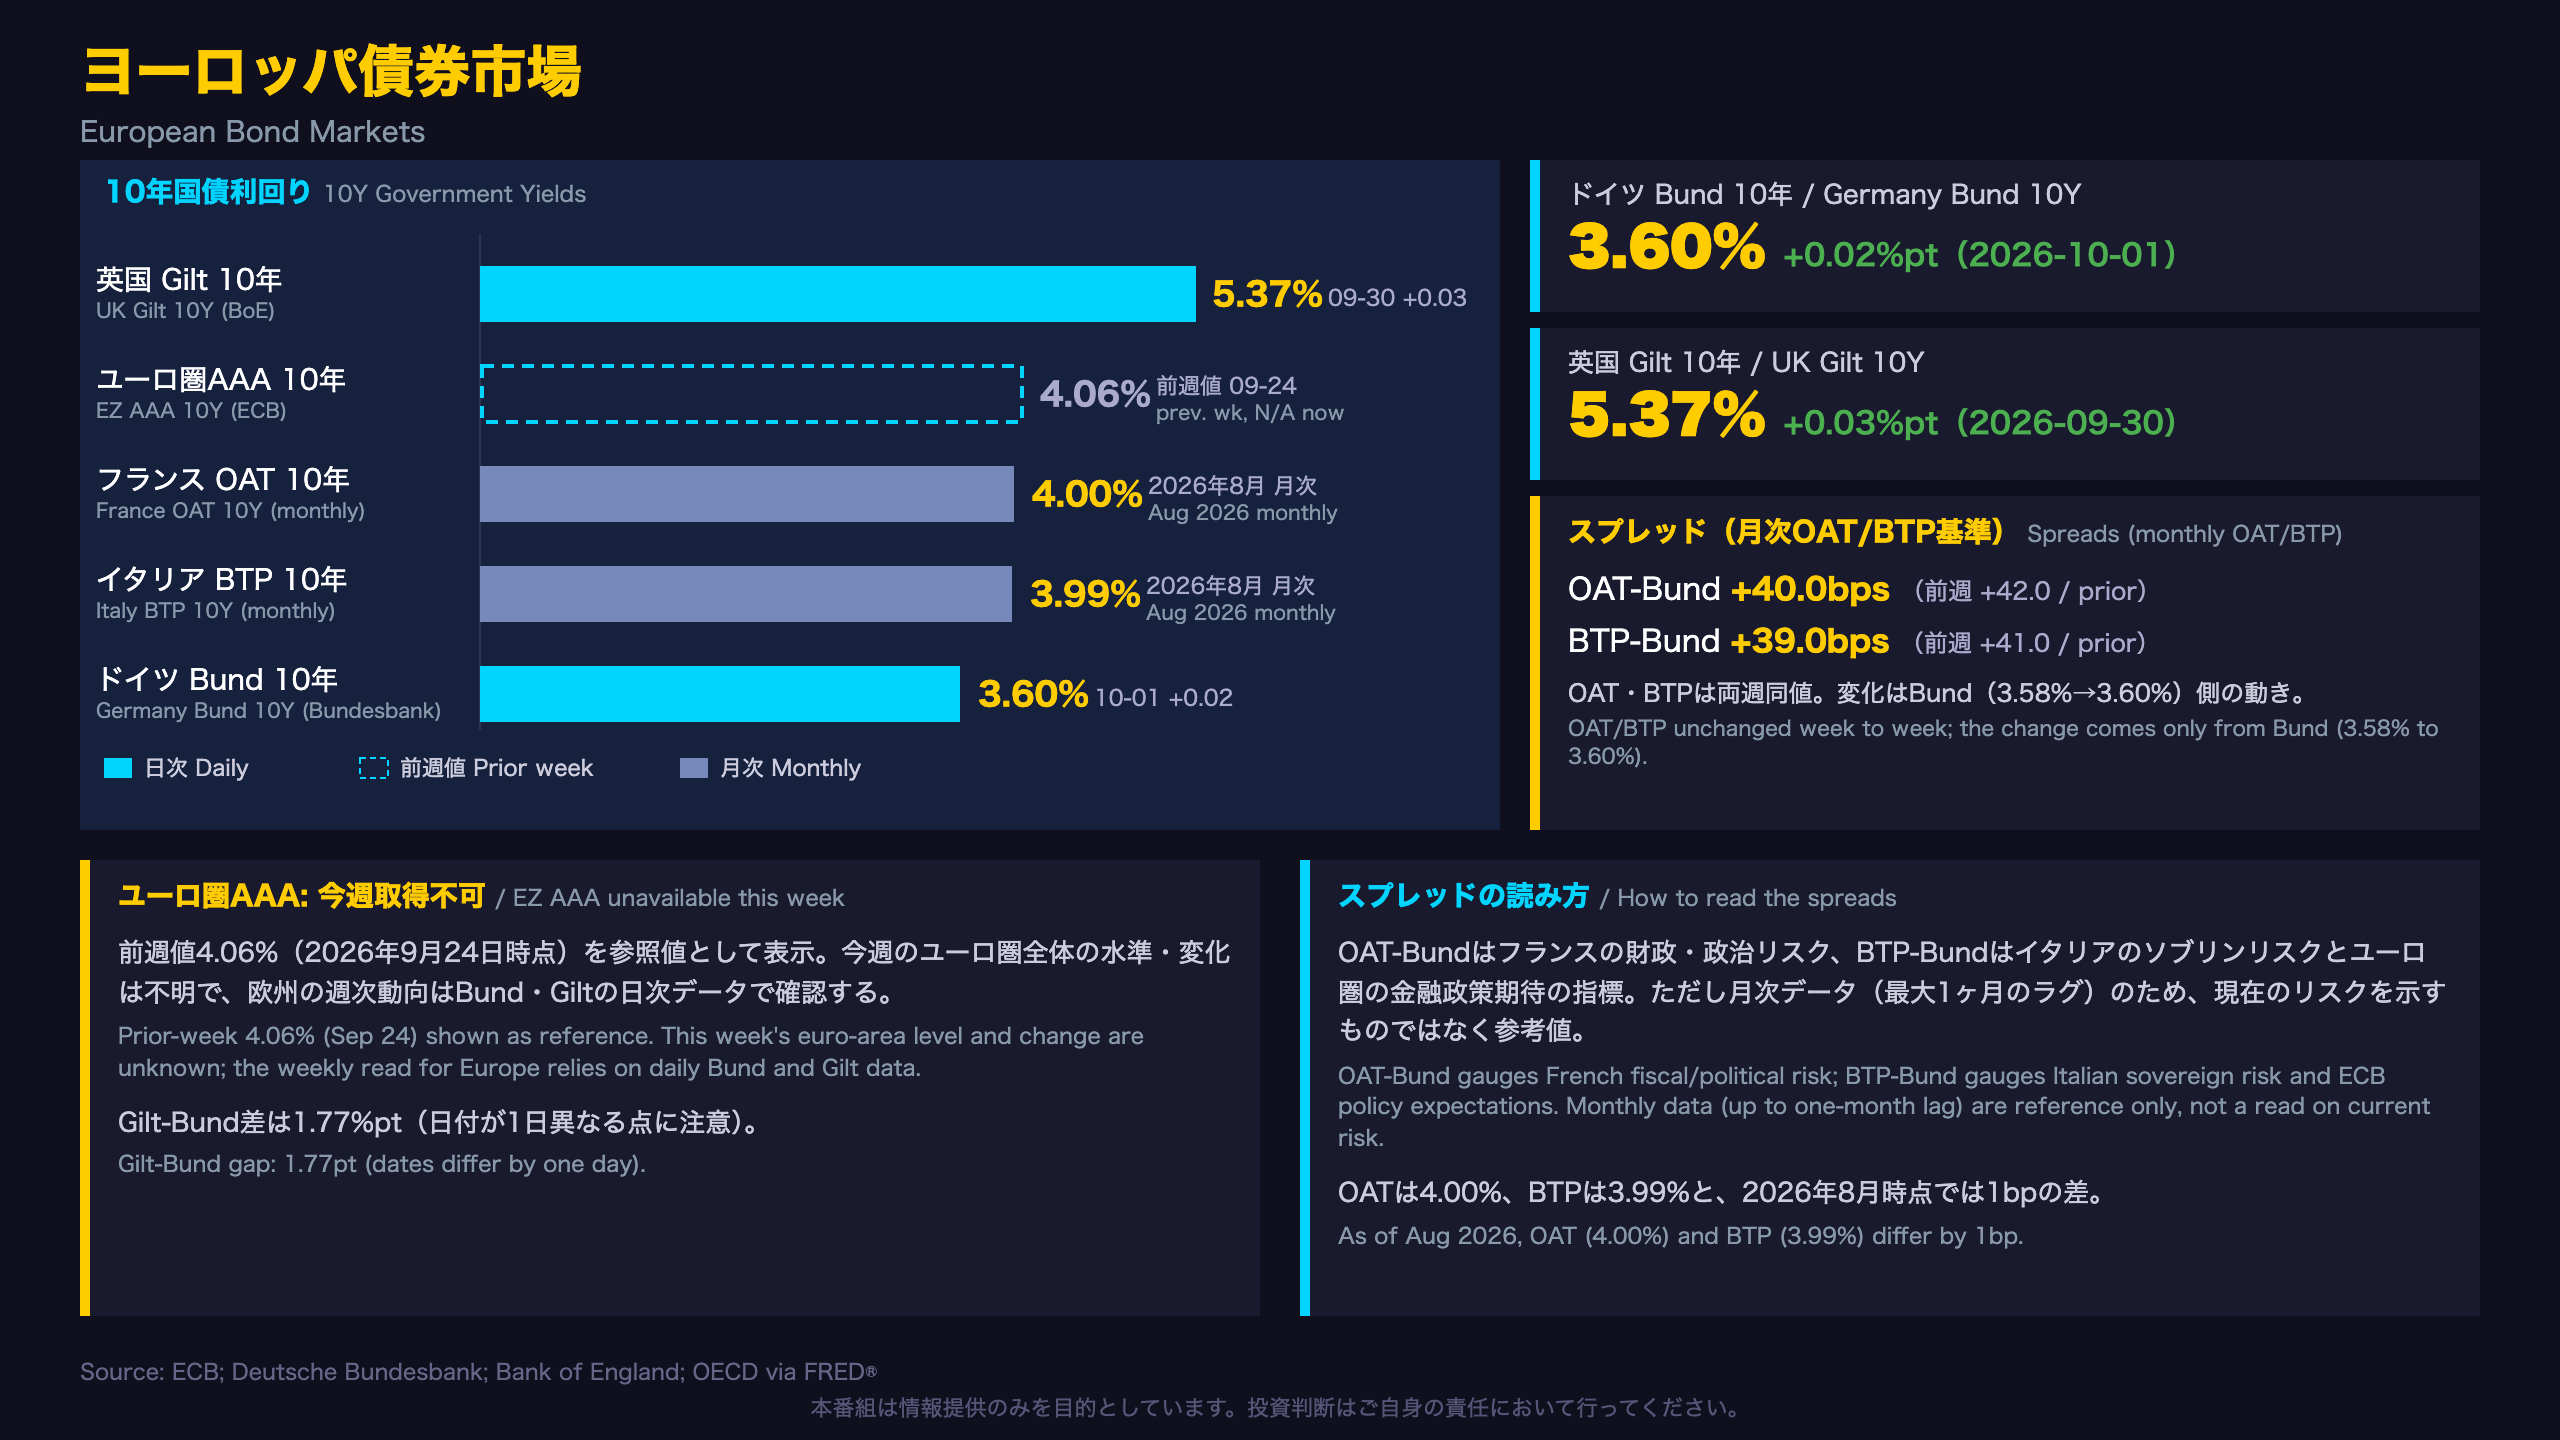
- ECB: publishes the euro-area AAA yield curve, built from the highest-rated euro government bonds. It was unavailable this week; last week’s reading was 4.06% (Sep 24).
- Deutsche Bundesbank: daily German 10Y Bund yield, 3.60% (Oct 1, +0.02pt).
- Bank of England: daily UK 10Y Gilt yield, 5.37% (Sep 30, +0.03pt).
- OECD via FRED: monthly French OAT (4.00%) and Italian BTP (3.99%) for August 2026, which can lag by up to a month.
Why Bund is the benchmark
The Bund plays the role in Europe that the Treasury plays in the U.S.: other countries are priced as spreads over it. OAT-Bund (+40.0bps) is a gauge of French fiscal and political risk, and BTP-Bund (+39.0bps) of Italian sovereign risk and ECB policy expectations.
A calculation trap
Both OAT and BTP are identical to last week’s monthly values. The spreads narrowed from +42.0bps and +41.0bps only because the daily Bund moved from 3.58% to 3.60%. This is arithmetic, not new information about France or Italy.
Market read
This week’s moves in Bund (+0.02pt) and Gilt (+0.03pt) were smaller than last week’s +0.12pt each, a calmer tape. Gilt sits 1.77pt above Bund (dates differ by one day). For FX traders, thin data means the euro and sterling read-across is limited to those two daily series.
日本国債・日銀政策金利
Japan: Rising Auction Yields, Mixed Demand
Background for non-Japan readers
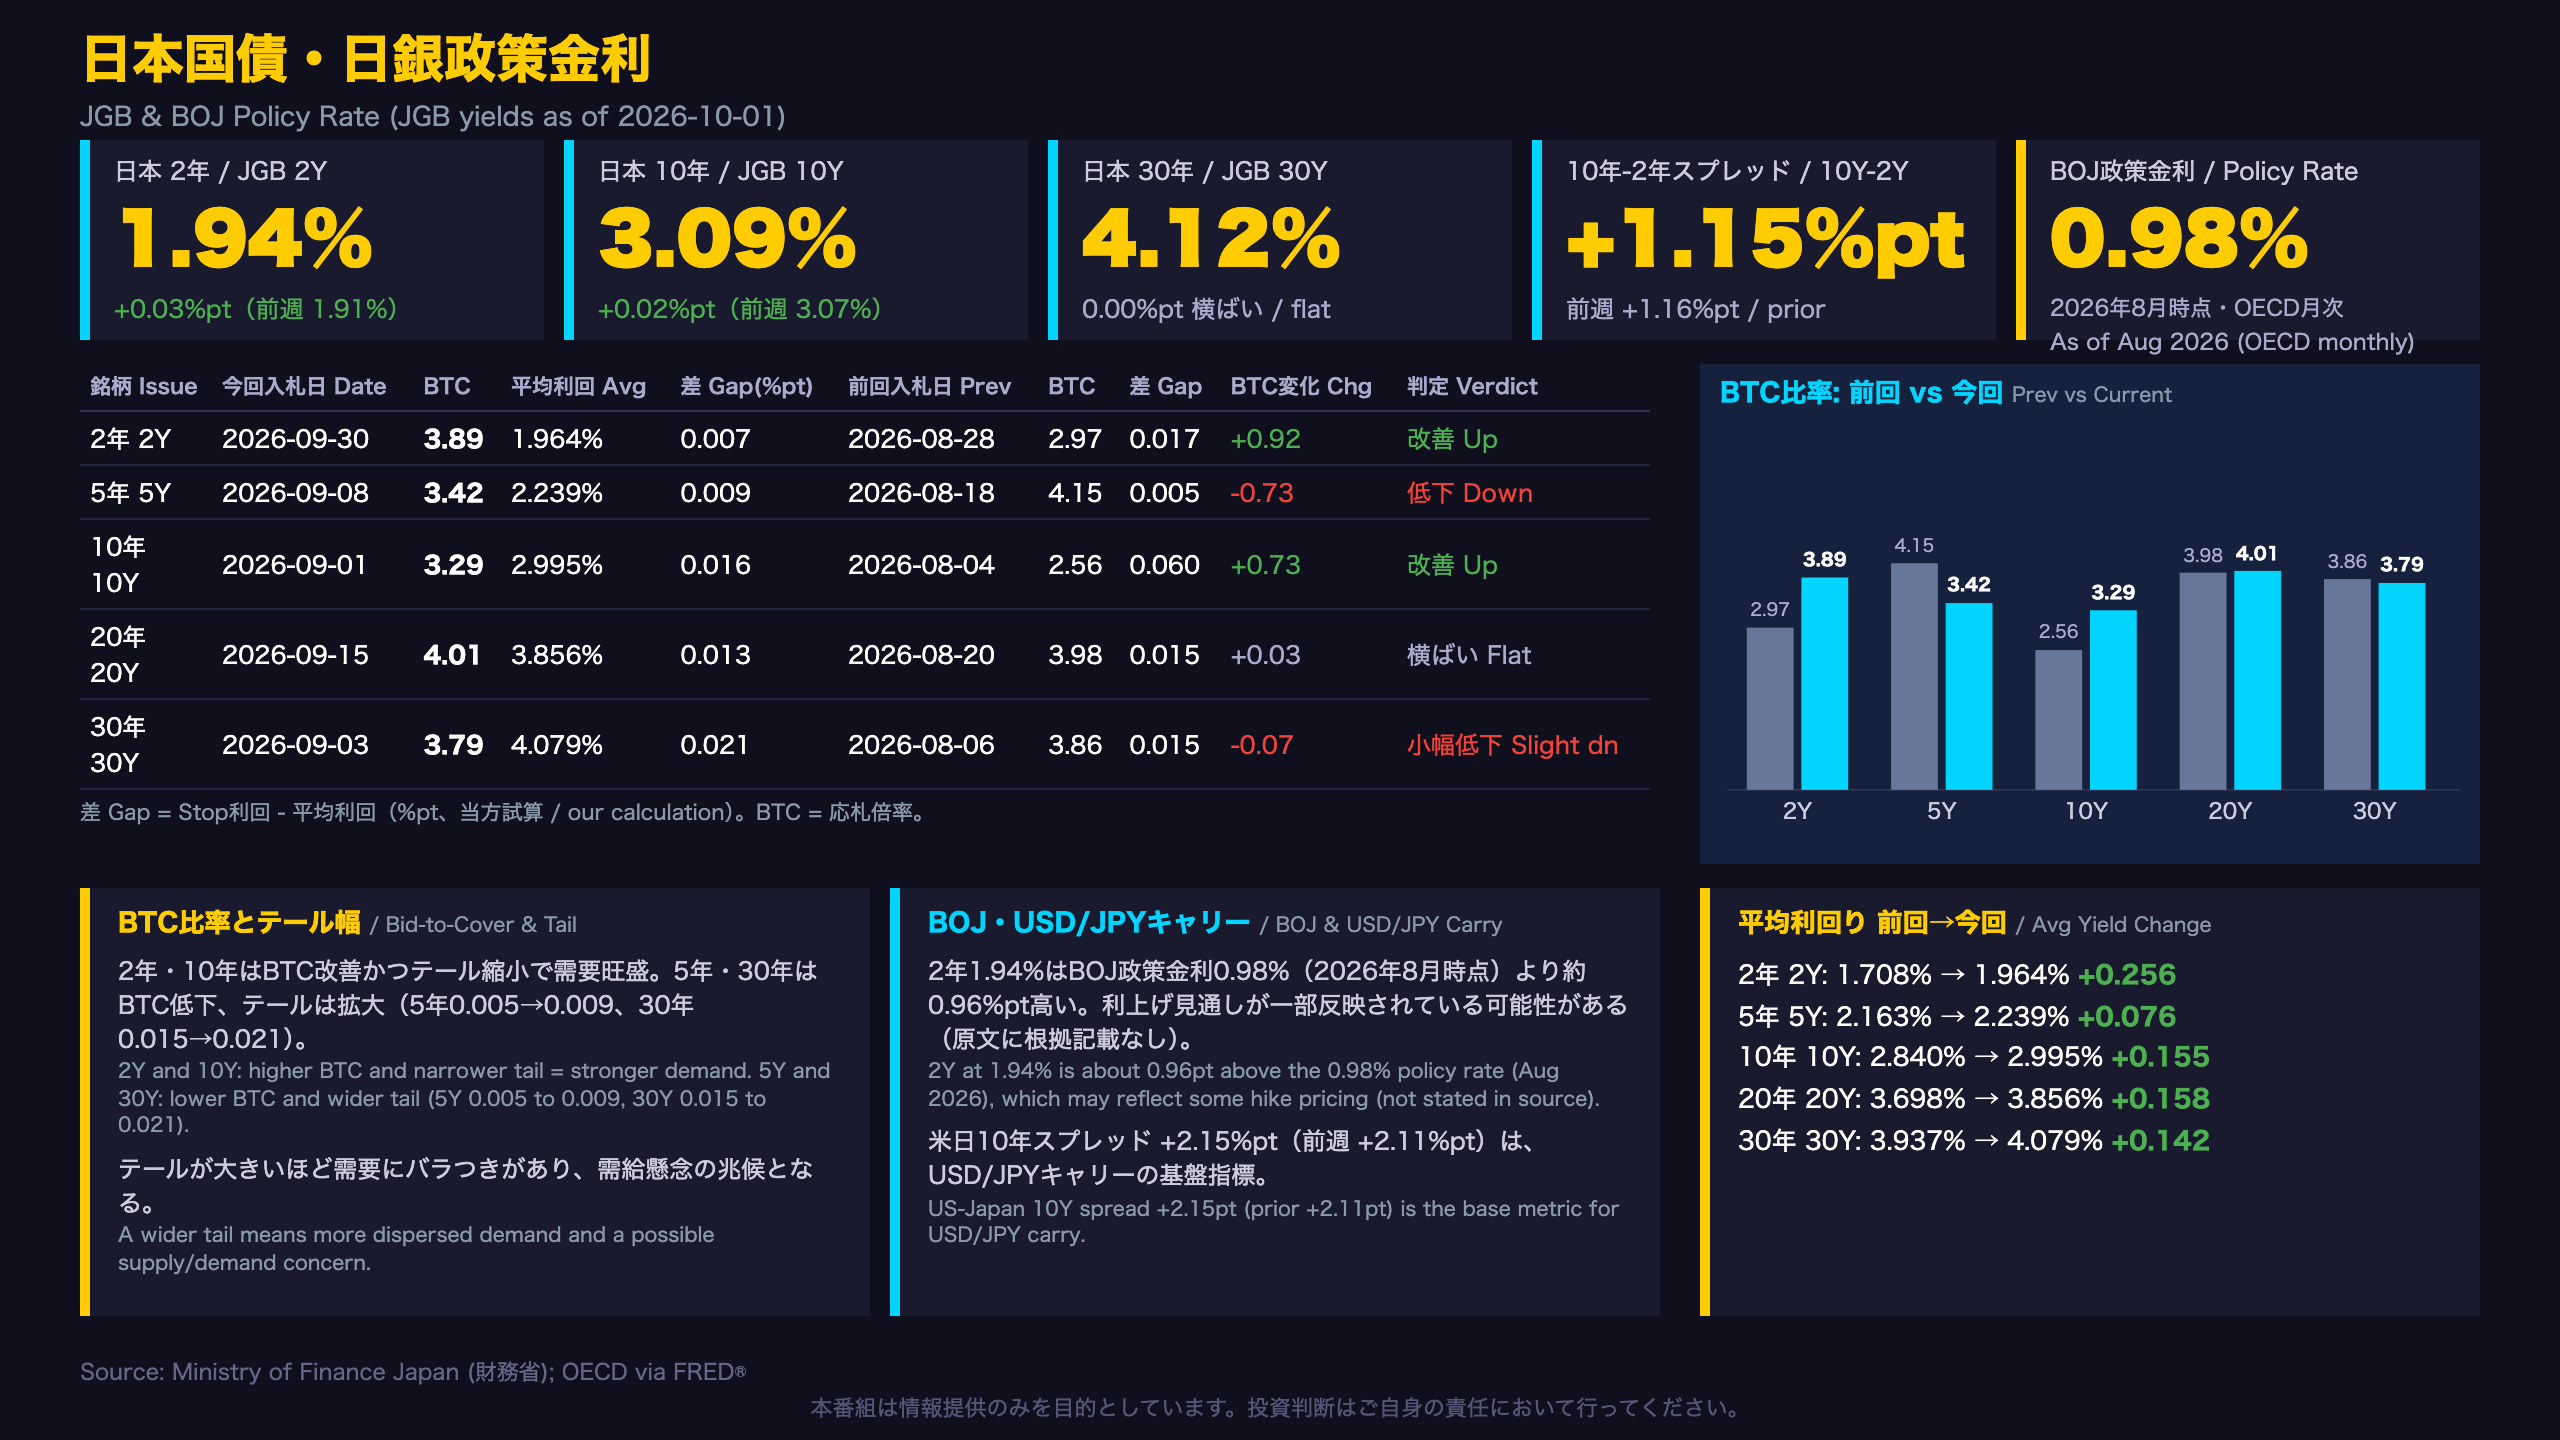
The Ministry of Finance (MOF) auctions JGBs on a fixed calendar by maturity (2Y, 5Y, 10Y, 20Y, 30Y, 40Y). Bid-to-cover is applications divided by the accepted amount. The tail is the gap between the stop-out yield and the average yield; a wider tail means more dispersed demand. The BOJ policy rate shown is an OECD monthly figure: 0.98% as of August 2026.
Average auction yields have climbed
- 2Y: 1.708% (Aug 28) to 1.964% (Sep 30)
- 5Y: 2.163% to 2.239%
- 10Y: 2.840% to 2.995%
- 20Y: 3.698% to 3.856%
- 30Y: 3.937% to 4.079%
The 10Y average yield has risen at every auction since May (2.540%, 2.649%, 2.729%, 2.840%, 2.995%).
Demand by tenor
Bid-to-cover improved at the 2Y (2.97 to 3.89) and 10Y (2.56 to 3.29), was flat at the 20Y (3.98 to 4.01), and eased at the 5Y (4.15 to 3.42) and 30Y (3.86 to 3.79). Tail widened at the 5Y and 30Y but narrowed at the 2Y, 10Y and 20Y (our calculation from yields, as the source’s tail column is blank).
Markets
The 2Y JGB yield (1.94%) sits about 0.96pt above the policy rate, which may mean rate hikes are partly priced in; the source does not confirm this. The U.S.-Japan 10Y spread of 2.15pt (up from 2.11pt) is the usual input for yen carry-trade analysis. Compared with U.S. auctions, JGB demand looks steadier, though one month’s comparison is limited evidence.
FX・CFD視点: スプレッドとHMMレジーム
Linking Rate Spreads to NFC’s HMM Regimes
What the HMM is
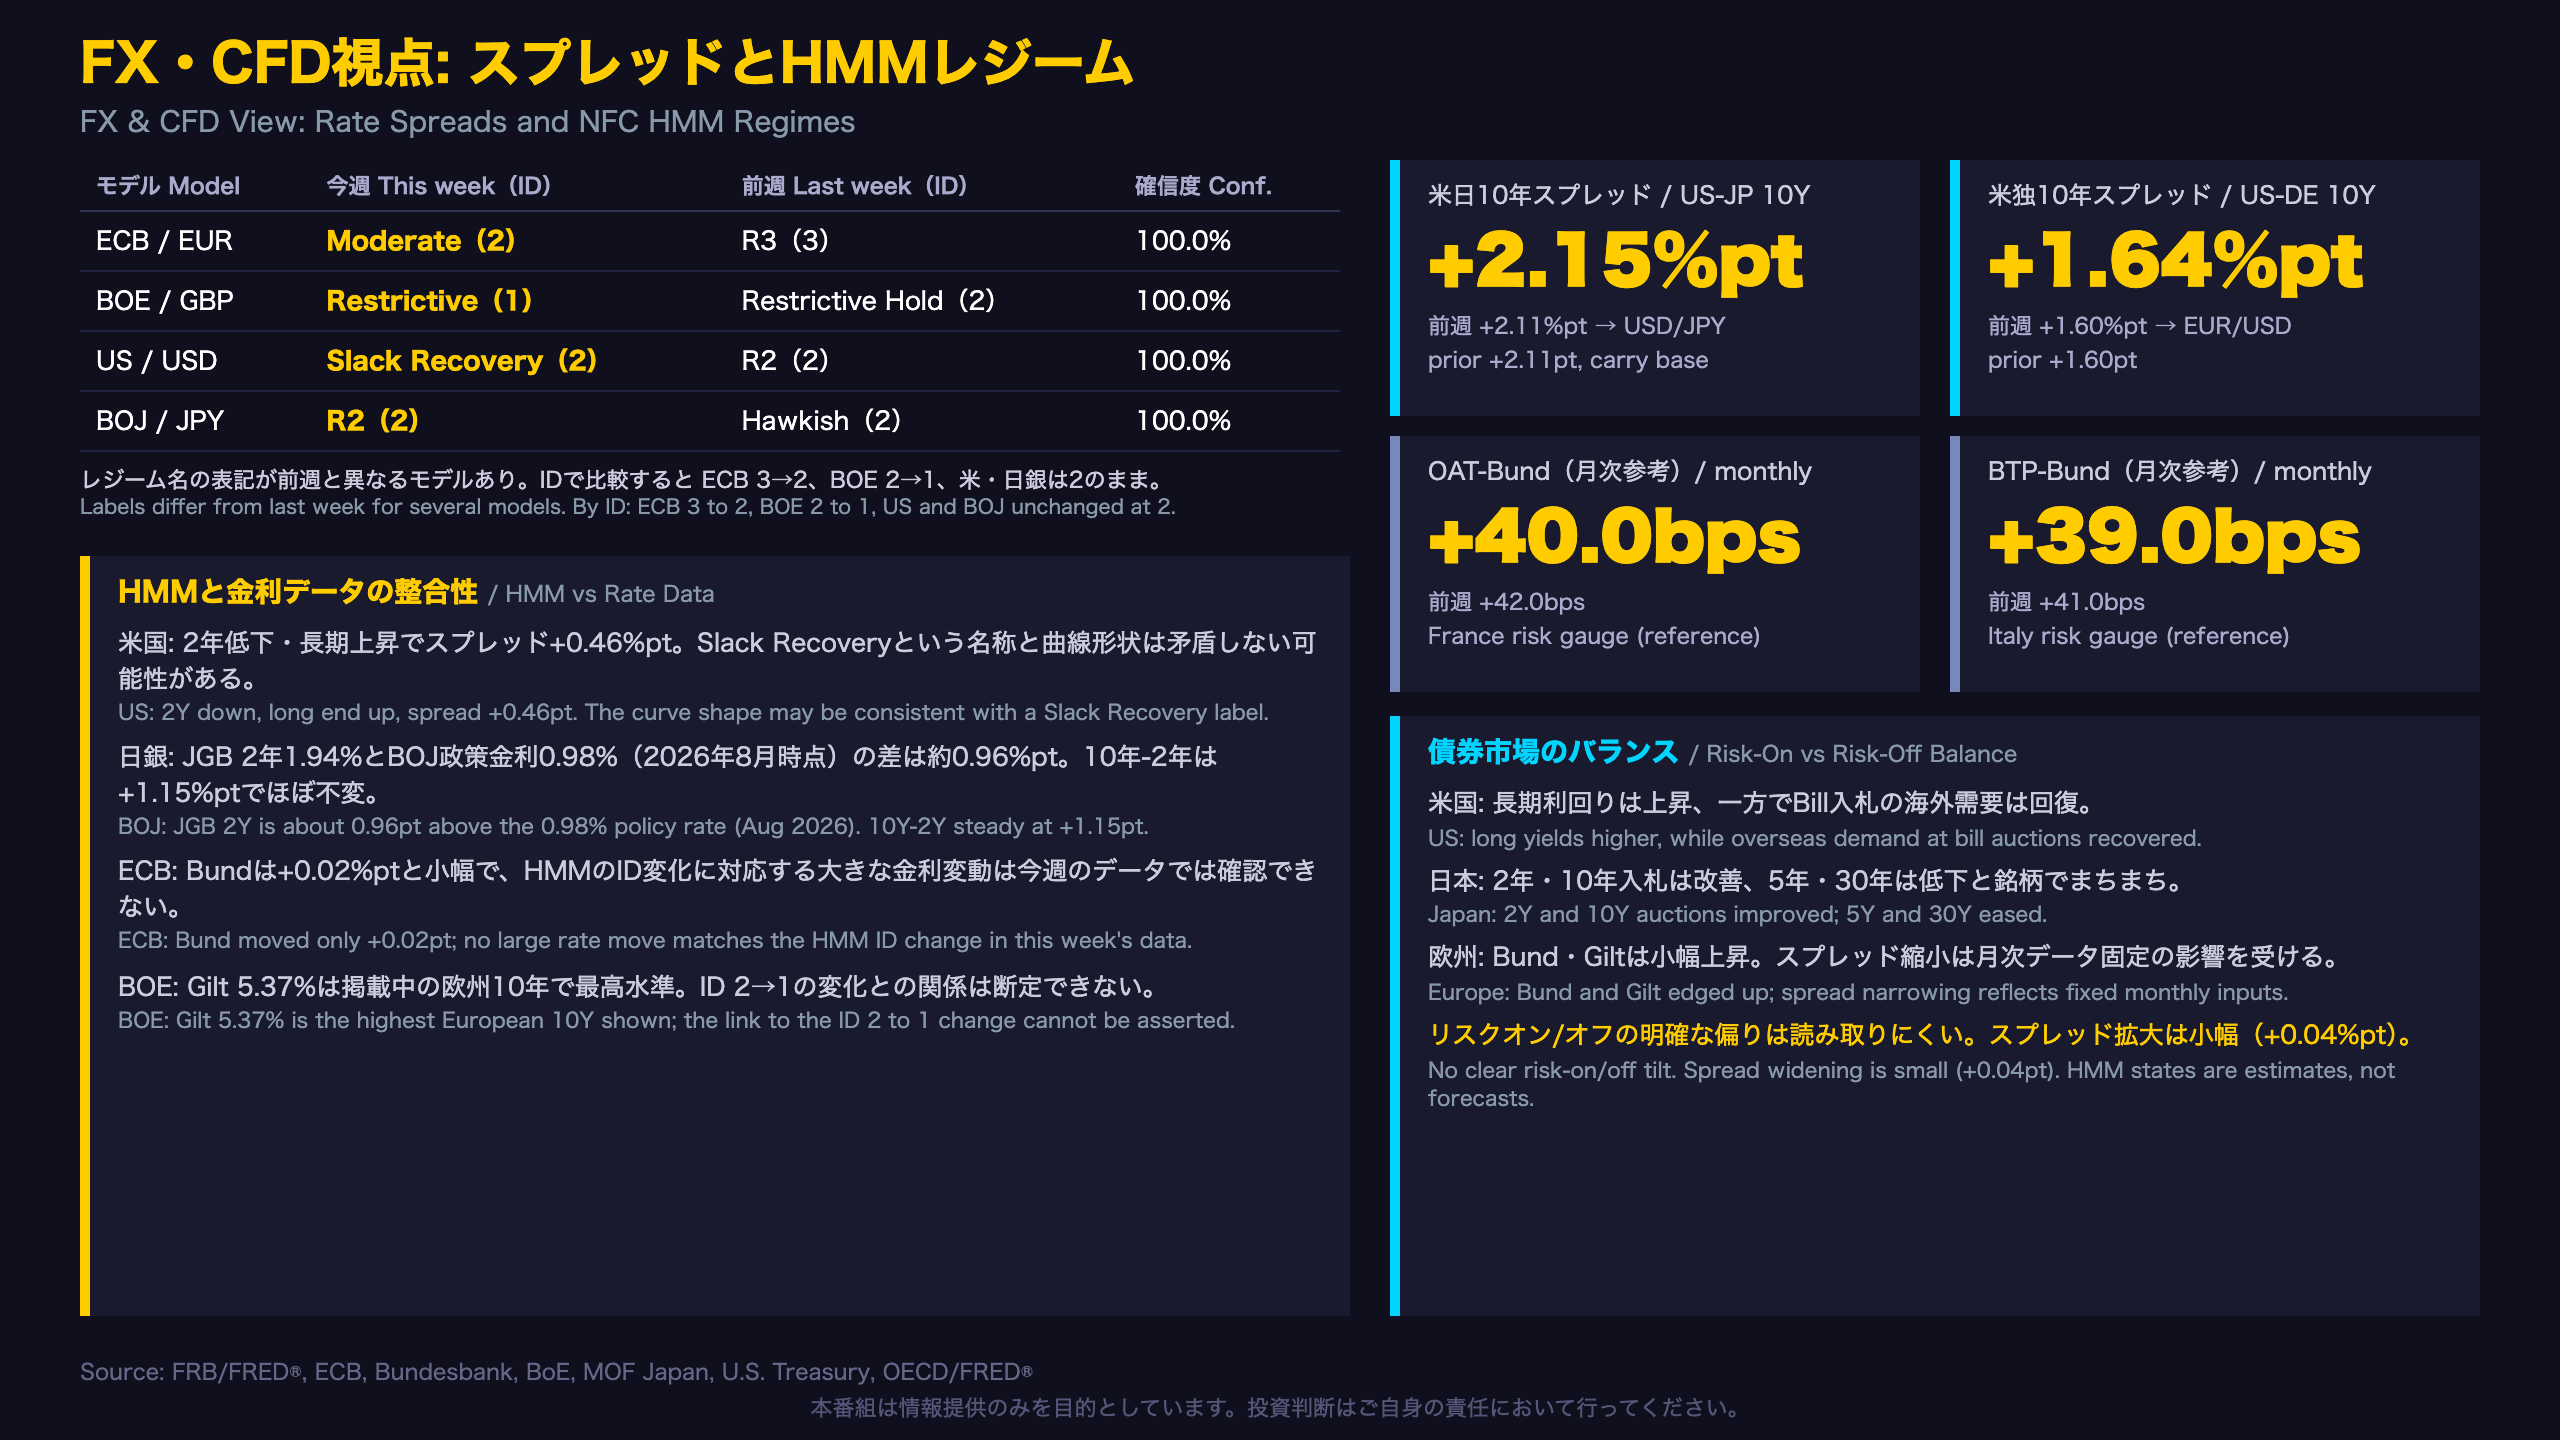
NFC’s hidden Markov model (HMM) classifies each central bank’s policy environment into regimes. This week: ECB = Moderate (ID 2), BOE = Restrictive (ID 1), U.S. = Slack Recovery (ID 2), BOJ = R2 (ID 2), all at 100.0% confidence. Last week’s labels were R3, Restrictive Hold, R2 and Hawkish respectively. The names differ in several models, so compare by ID: ECB 3 to 2, BOE 2 to 1, U.S. and BOJ unchanged at 2. A relabeling of the scheme cannot be ruled out, so week-on-week comparison is indicative only.
Spreads
- U.S.-Japan 10Y: +2.15pt (prior +2.11pt), the usual carry reference for USD/JPY.
- U.S.-Germany 10Y: +1.64pt (prior +1.60pt), referenced for EUR/USD.
- OAT-Bund +40.0bps, BTP-Bund +39.0bps: monthly inputs, reference only.
Alignment check
The U.S. curve steepened (2Y down, long end up), which looks consistent with a ‘Slack Recovery’ label, though this is a single-week observation. For Japan, the 2Y JGB sits about 0.96pt above the 0.98% policy rate (Aug 2026), and the 10Y-2Y spread is stable at 1.15pt. For Europe, the Bund moved only 0.02pt, so no large rate move matches the ECB regime ID change.
Market framing
Spread widening of 0.04pt in both pairs is small. Rate differentials may remain a talking point for USD/JPY and EUR/USD, but this data does not point in one direction. Risk-on versus risk-off is unclear: long-end U.S. yields are higher, yet Japan’s 2Y and 10Y auctions firmed. An HMM state is a statistical estimate, not a forecast.
Disclaimer: This article is for informational purposes only. All investment decisions are made solely at your own risk.