This article was automatically generated by the NFC Market Live AI analysis system. (Updated: 2026-08-21 08:48 JST)
📄 Primary Source
総務省統計局
https://www.stat.go.jp/data/cpi/sokuhou/tsuki/pdf/zenkoku.pdf
📊 Deep dive into Japan’s June 2026 National CPI (final report) released by the Ministry of Internal Affairs and Communications (MIC).
Tokyo’s leading-indicator CPI (released weeks earlier) signaled a reacceleration to +1.7% YoY — and the national confirmed data matched it exactly.
💡 But the acceleration isn’t demand-driven inflation — it’s a base-effect fade in gasoline and electricity price declines. Core-core CPI (ex-fresh food & energy) continues its gradual deceleration, from 2.4% in March to 1.7% in June.
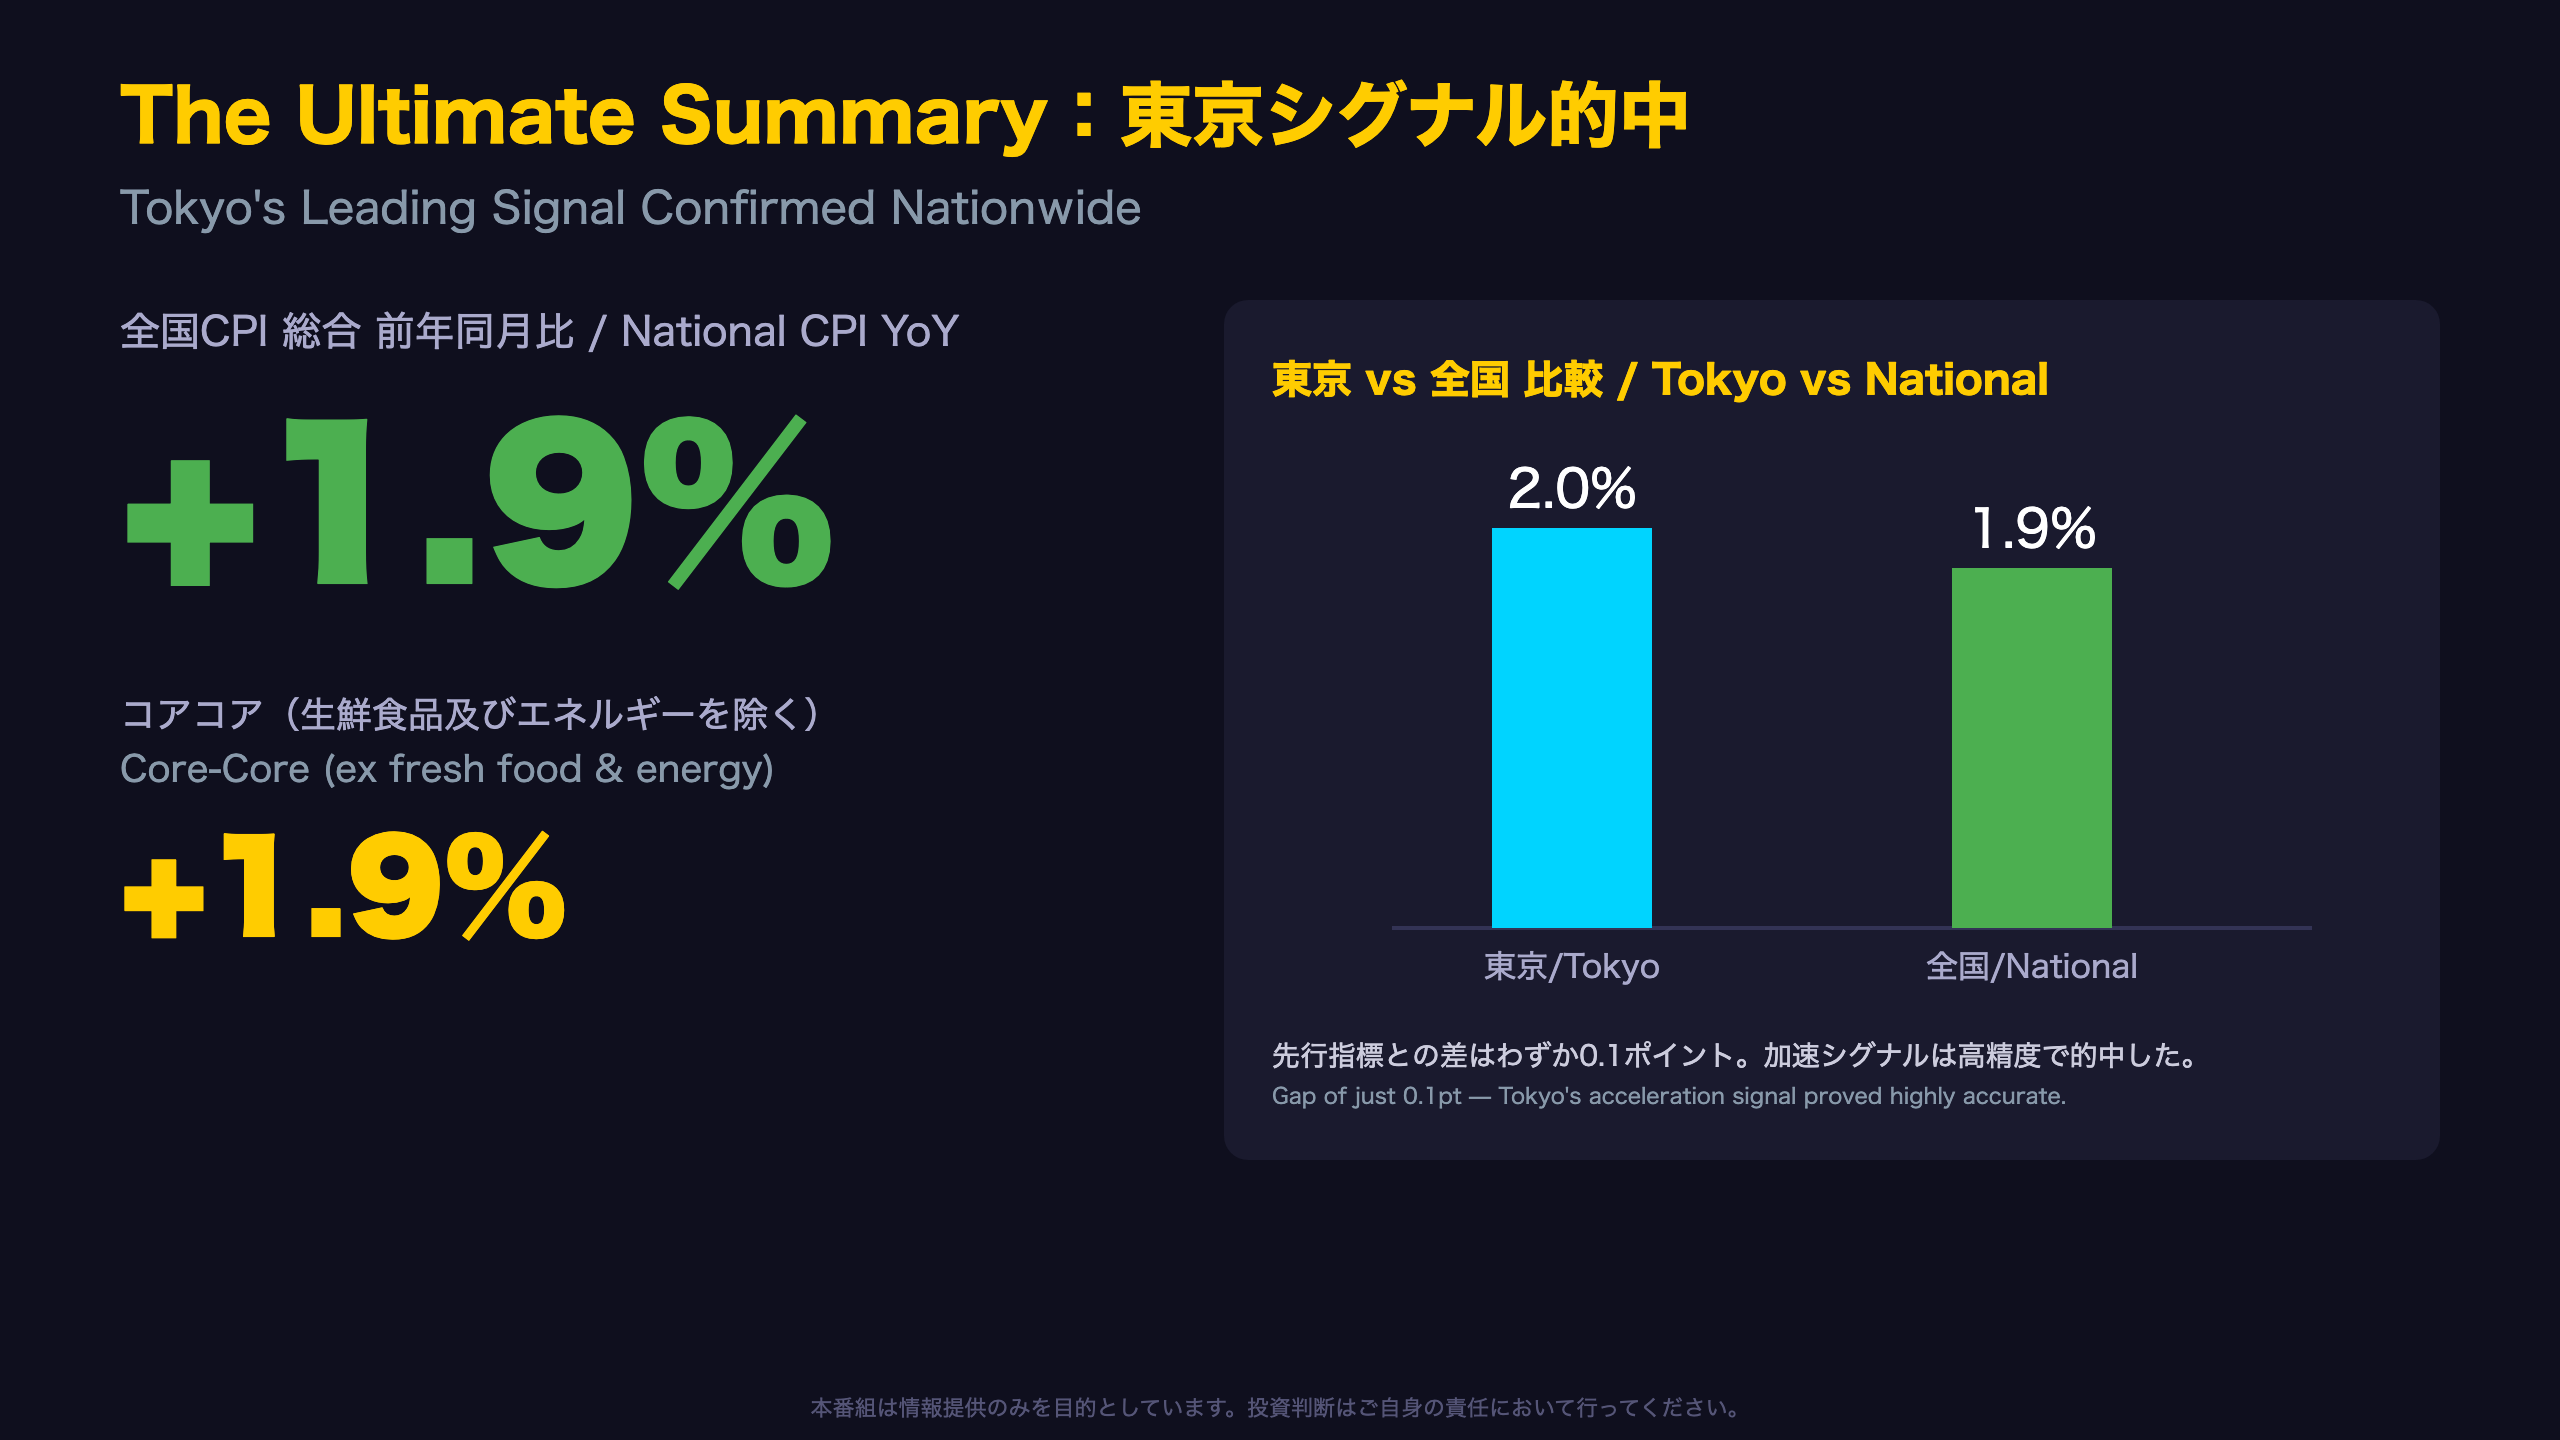
📈 Tokyo’s July flash reading already jumped to 2.0%, hinting at further upside in the next national release (Aug 21).
⚠️ We break down the strengths and weaknesses hidden beneath the headline number, and what it means for BOJ policy.
東京の先行シグナル、全国確報が完全追認
Why Tokyo and National Data Converged
Japan’s Ministry of Internal Affairs and Communications (MIC) publishes Tokyo’s ward-area CPI roughly a month ahead of the national figure — a widely watched leading indicator for BOJ policy discussions. This month, headline (+1.7%) and core (ex-fresh food, +1.6%) CPI in the June national final report matched Tokyo’s flash reading exactly.
From the MIC release: “The all-items index stood at 113.6 (2020=100), up 1.7% from a year earlier.”
But a Gap Emerged in Core-Core
Interestingly, the core-core measure (ex-fresh food and energy) diverged: Tokyo’s June flash showed +1.9% versus the national +1.7%, a 0.2-point gap. This single-month divergence should be read cautiously — it may hint at somewhat stronger urban services inflation, but one month of data is not enough to confirm a structural regional split.
Context for International Readers
Unlike the U.S. CPI (compared against the Fed’s 2% target using PCE), Japan’s CPI print is the primary gauge the Bank of Japan (BOJ) watches for its own 2% inflation target. The deceleration from 2.1% (Dec 2025) to a 1.3-1.5% range in early 2026, followed by this June reacceleration to 1.7%, is a meaningful inflection for JPY and JGB markets.
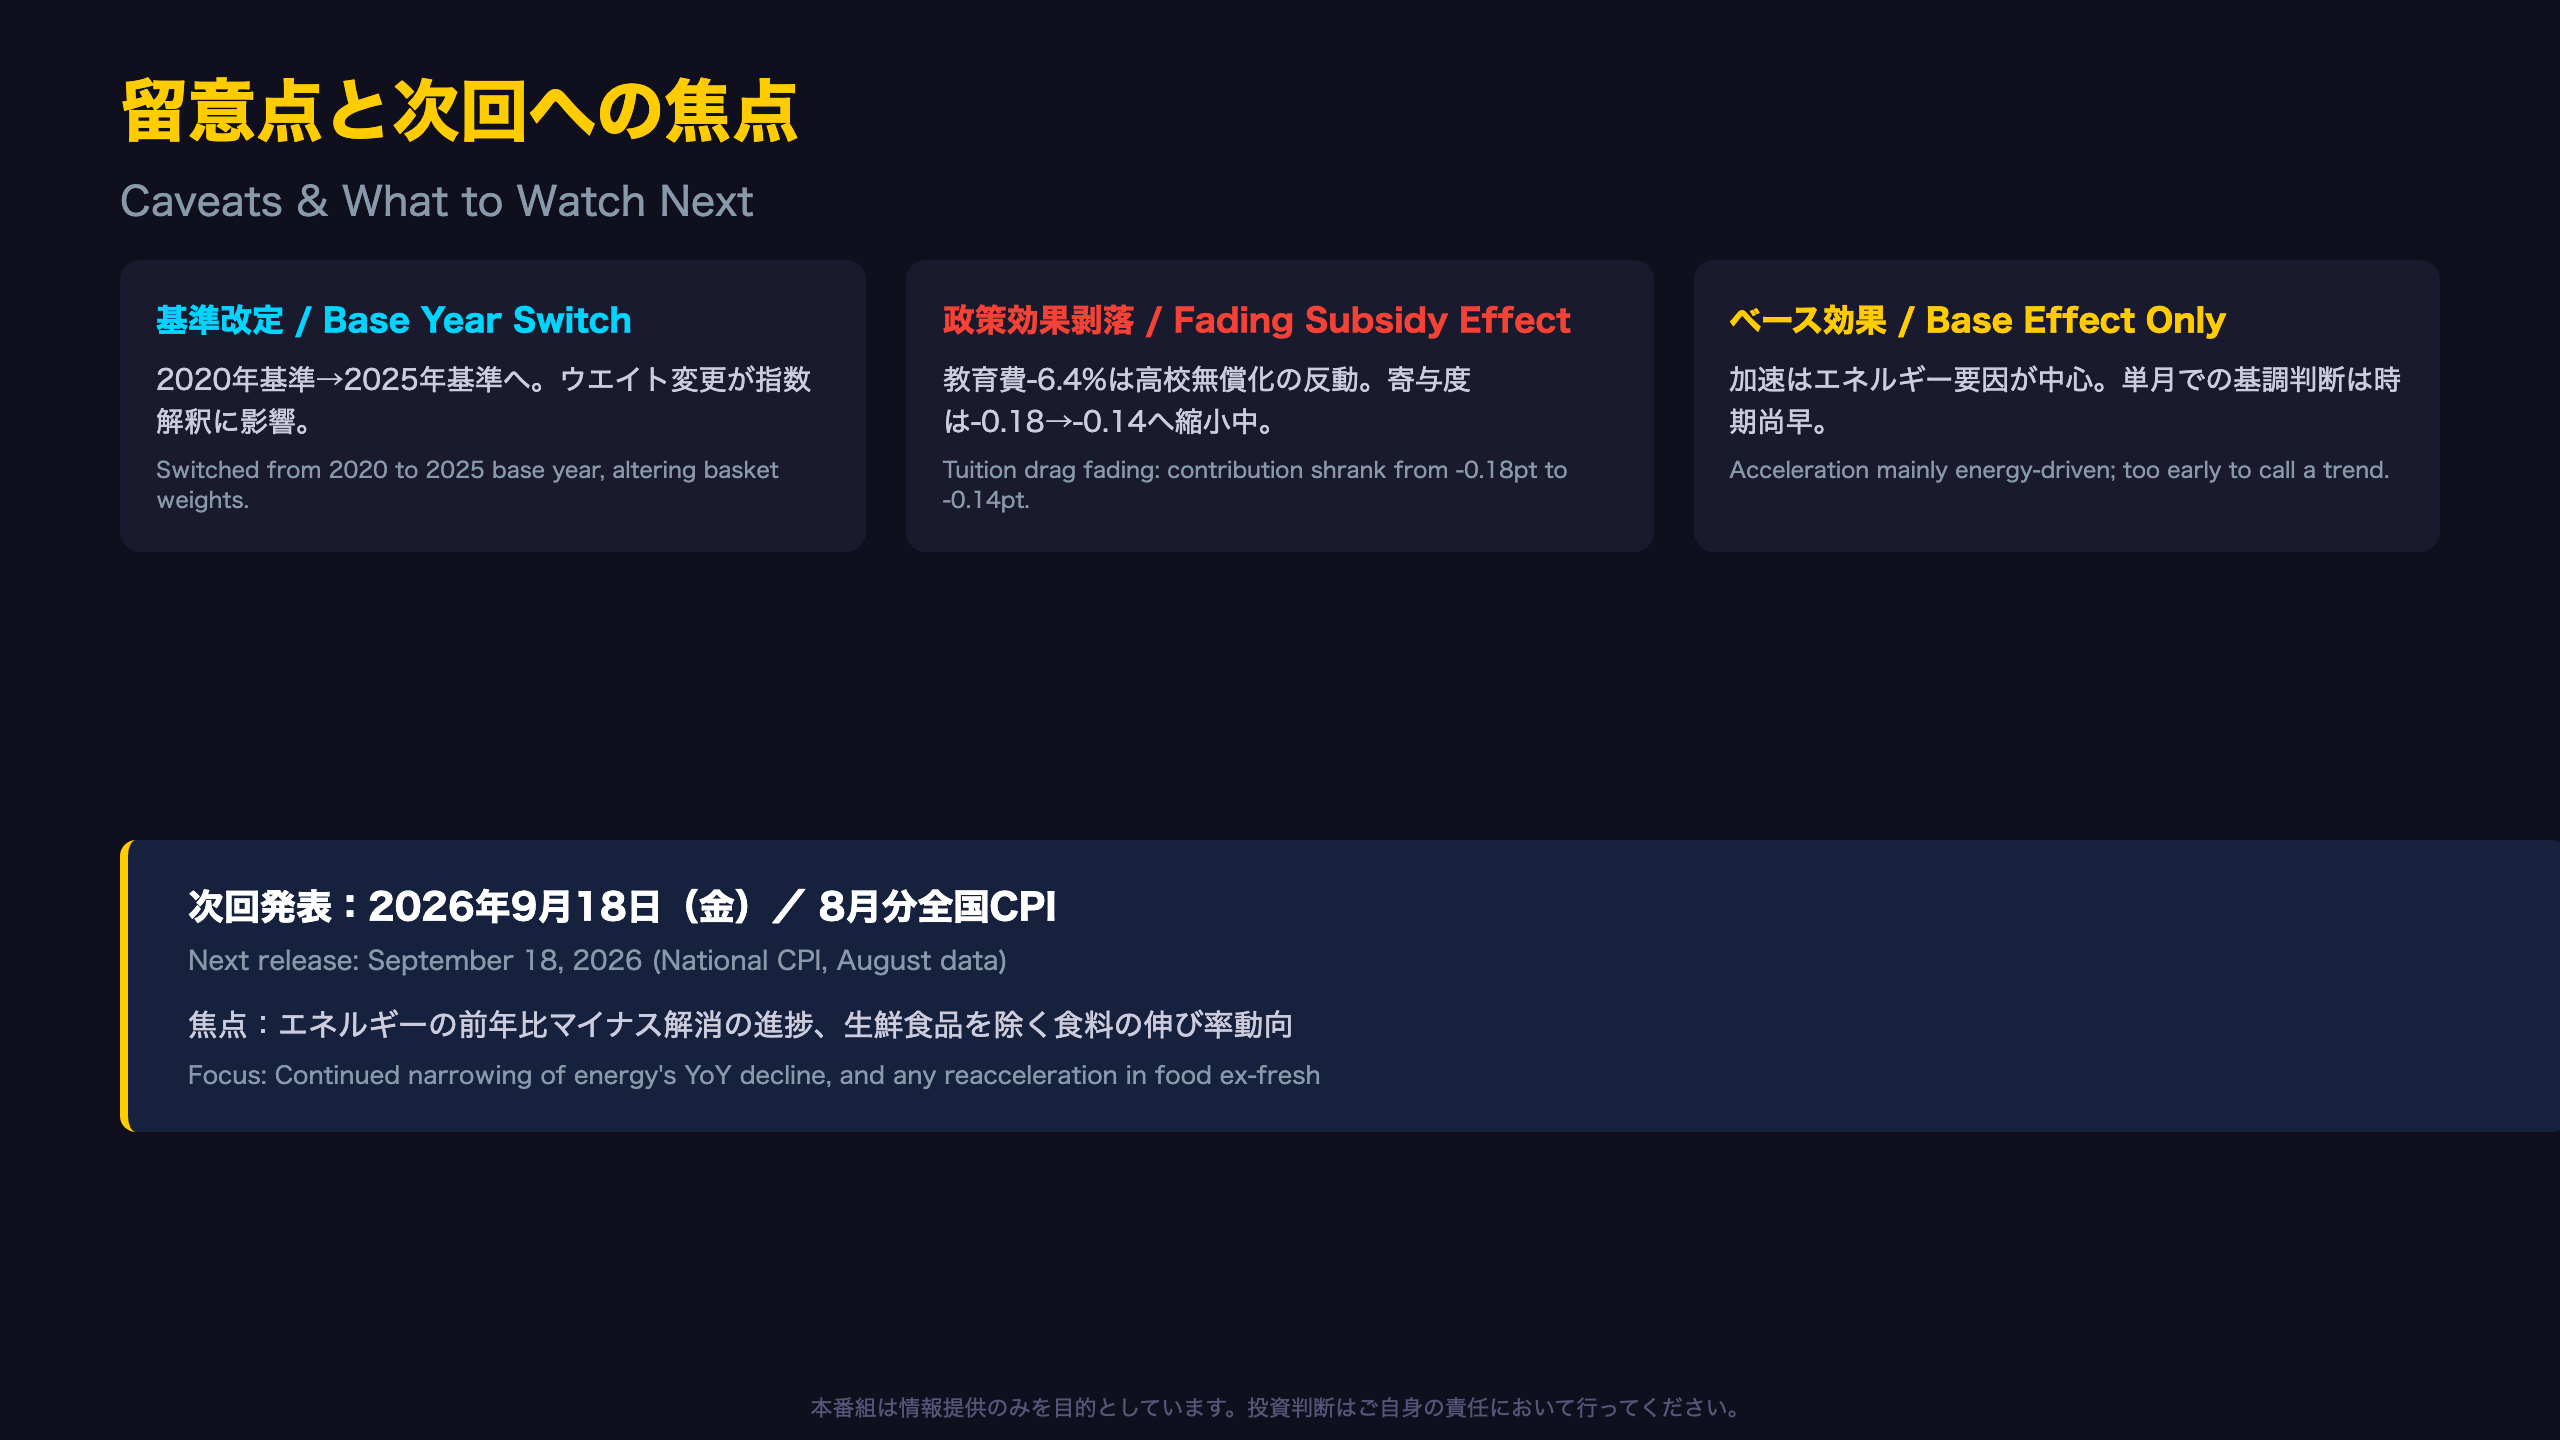
The next national CPI (July data) is due August 21, 2026 — with Tokyo’s July flash already at 2.0%, markets will watch closely whether the national print follows suit.
全国CPI確報、3指標そろって加速
Breaking Down the Three Headline Gauges
June 2026 index levels: headline CPI at 113.6 (2020=100), core (ex-fresh food) at 113.1, and core-core (ex-fresh food & energy) at 112.2.
| Measure | May | June | Change |
|---|---|---|---|
| Headline | +1.5% | +1.7% | +0.2pt |
| Core (ex-fresh food) | +1.4% | +1.6% | +0.2pt |
| Core-core (ex-fresh food & energy) | +1.8% | +1.7% | -0.1pt |
A notable “twist” here: headline and core both accelerated, while core-core actually decelerated slightly. This likely reflects that the energy-driven base effect (explained in the next section) boosted headline and core figures directly, but by definition doesn’t touch core-core, which strips out energy entirely.
Momentum in Seasonally Adjusted Terms
Month-on-month, seasonally adjusted: headline +0.3% (vs +0.4% in May), core +0.2% (vs +0.4%), and core-core +0.2% (vs -0.2% in May) — a swing from negative to positive. For international readers: this measure is analogous to the U.S. “core PCE MoM” that the Fed watches for momentum, distinct from the noisier YoY headline print.
Six-Month Context
National headline CPI fell sharply from 2.1% in December 2025 to 1.5% in January 2026, then hovered in a 1.3-1.5% range through May. June’s 1.7% print marks a clear break above that range — a data point the BOJ will likely weigh alongside wage growth data ahead of its next policy meeting.
加速の主因は”値上げ”ではなく”反動”
Energy Base Effects Explain Nearly the Entire Acceleration
Headline CPI’s YoY growth widened by 0.2 points from May (1.5%) to June (1.7%), and the MIC report pinpoints the cause with unusual clarity.
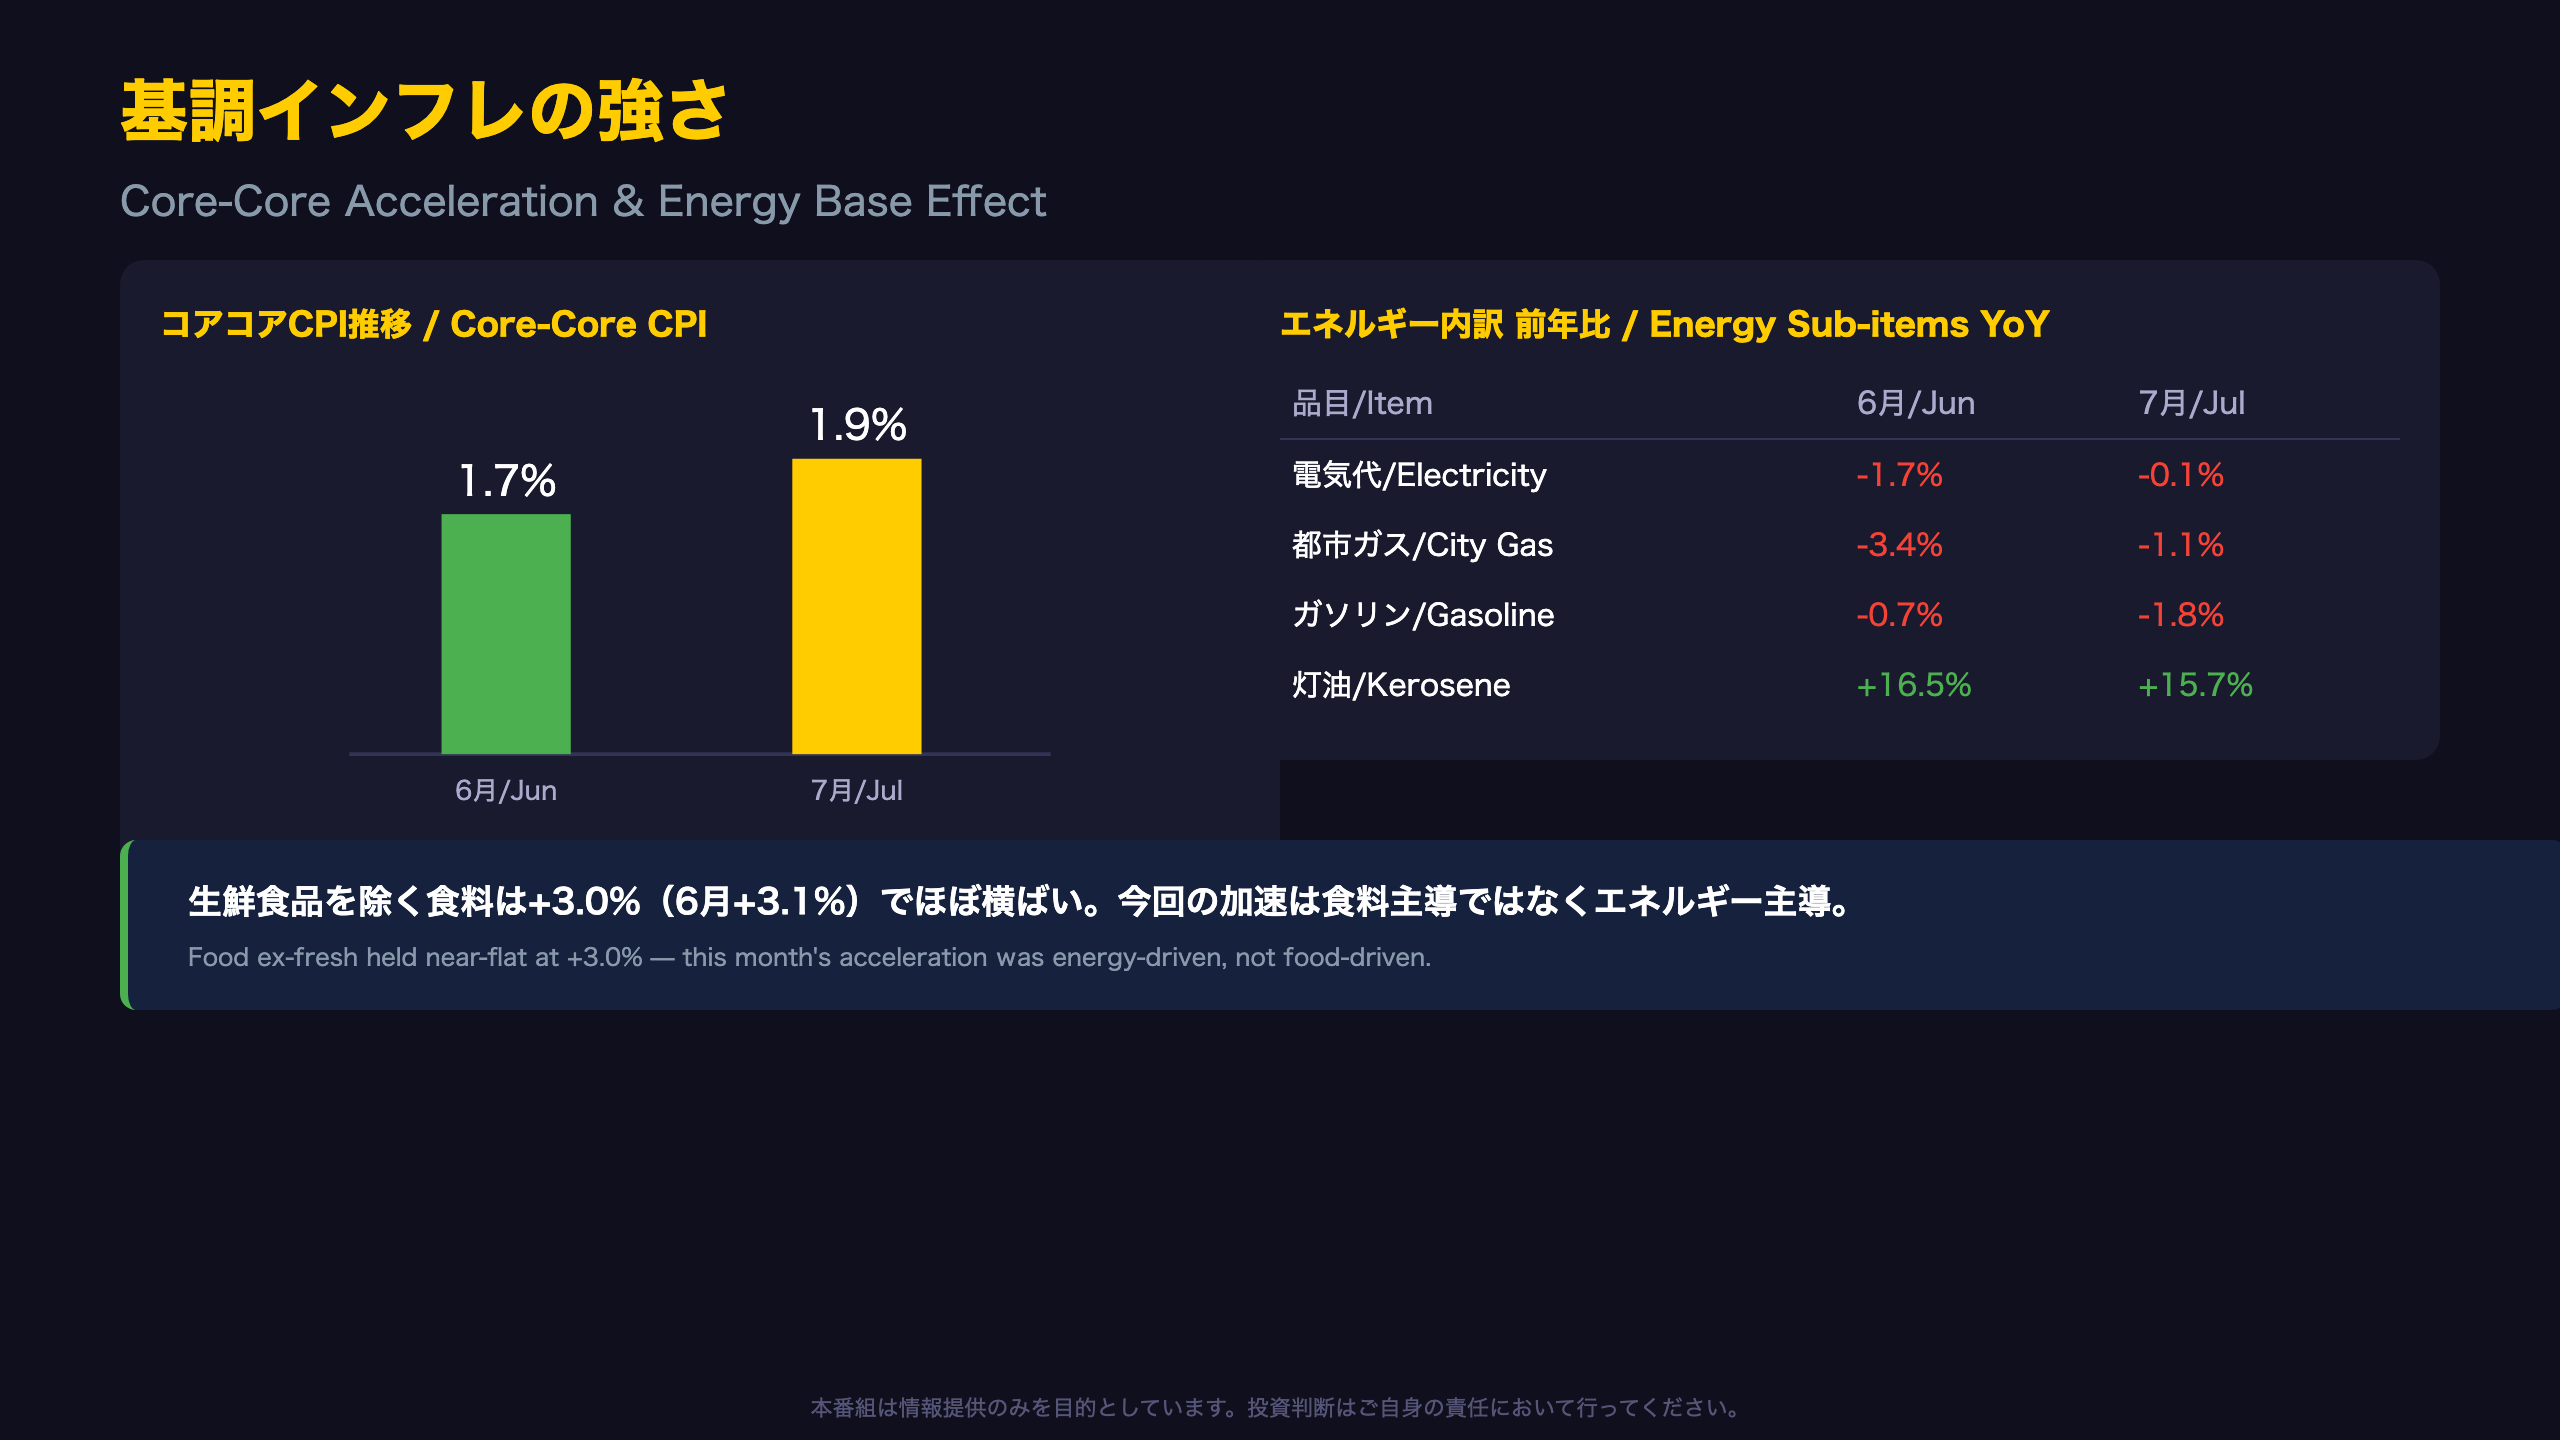
From the release: “Energy items including gasoline, electricity, and kerosene widened the headline’s rate of increase by 0.20 percentage points.”
Energy’s overall contribution improved from minus 0.20 in May to minus 0.01 in June — a swing of exactly 0.20 points, which almost single-handedly accounts for the entire headline acceleration. In other words, once energy’s fading drag is isolated, June’s “reacceleration” story largely evaporates.
An Invisible Policy Drag
A footnote in the report reveals something international investors often miss in translated summaries: an official estimate of policy effects.
“Estimated contribution of gasoline provisional tax rate abolition and related policy effects: Energy -0.74pt (-0.87pt current month, +0.13pt base-effect drop-off)”
This implies that without the tax policy, June’s headline CPI could plausibly have printed in the low-2% range instead of 1.7% — a materially different signal for BOJ policymakers watching for durable 2% inflation. That said, this is MIC’s own model-based estimate, and actual pass-through absent the tax change is uncertain (a reasonable-confidence, not certain, inference).
One Demand-Side Counterpoint
Not everything is energy-driven: durable household goods accelerated from +1.9% in May to +3.0% in June, a data point that doesn’t fit the pure base-effect narrative and deserves monitoring.
コアコアCPIは緩やかな鈍化トレンド継続
A 1.2-Point Deceleration Over Six Months
Tracking core-core CPI (ex-fresh food and energy) month by month reveals a consistent downtrend:
| Month | Core-Core CPI |
|---|---|
| Dec 2025 | +2.9% |
| Jan 2026 | +2.6% |
| Feb | +2.5% |
| Mar | +2.4% |
| Apr | +1.9% |
| May | +1.8% |
| Jun | +1.7% |
The sharp 0.5-point drop between March and April stands out and cannot be fully explained by a single factor. It likely reflects the fading of prior-year price hikes across several categories, though the source report does not provide a detailed breakdown, so further speculation should be treated cautiously.
Diverging Fortunes Within Services
Mobile phone charges decelerated sharply from +11.0% in May to +4.6% in June, likely reflecting the fading base effect from carrier price cuts a year earlier. Meanwhile, medical treatment fees flipped from -0.7% to +1.7% — a notable reversal.
From the release: “Medical treatment fees widened the headline’s increase by 0.05 percentage points.”
Reading Both Ways
For context, Japan’s core-core CPI plays a role somewhat analogous to the U.S. core PCE that the Federal Reserve targets at 2%. Bearish read: the persistent deceleration could signal the BOJ’s path to a durable 2% target is losing momentum. Bullish read: 1.7% remains well above Japan’s deflationary-era norms, and if wage growth holds up, this gradual cooling may simply reflect a healthy normalization rather than a demand collapse.
次なる先行指標は2.0%、日銀の視線
Inside Tokyo’s July Flash Reading
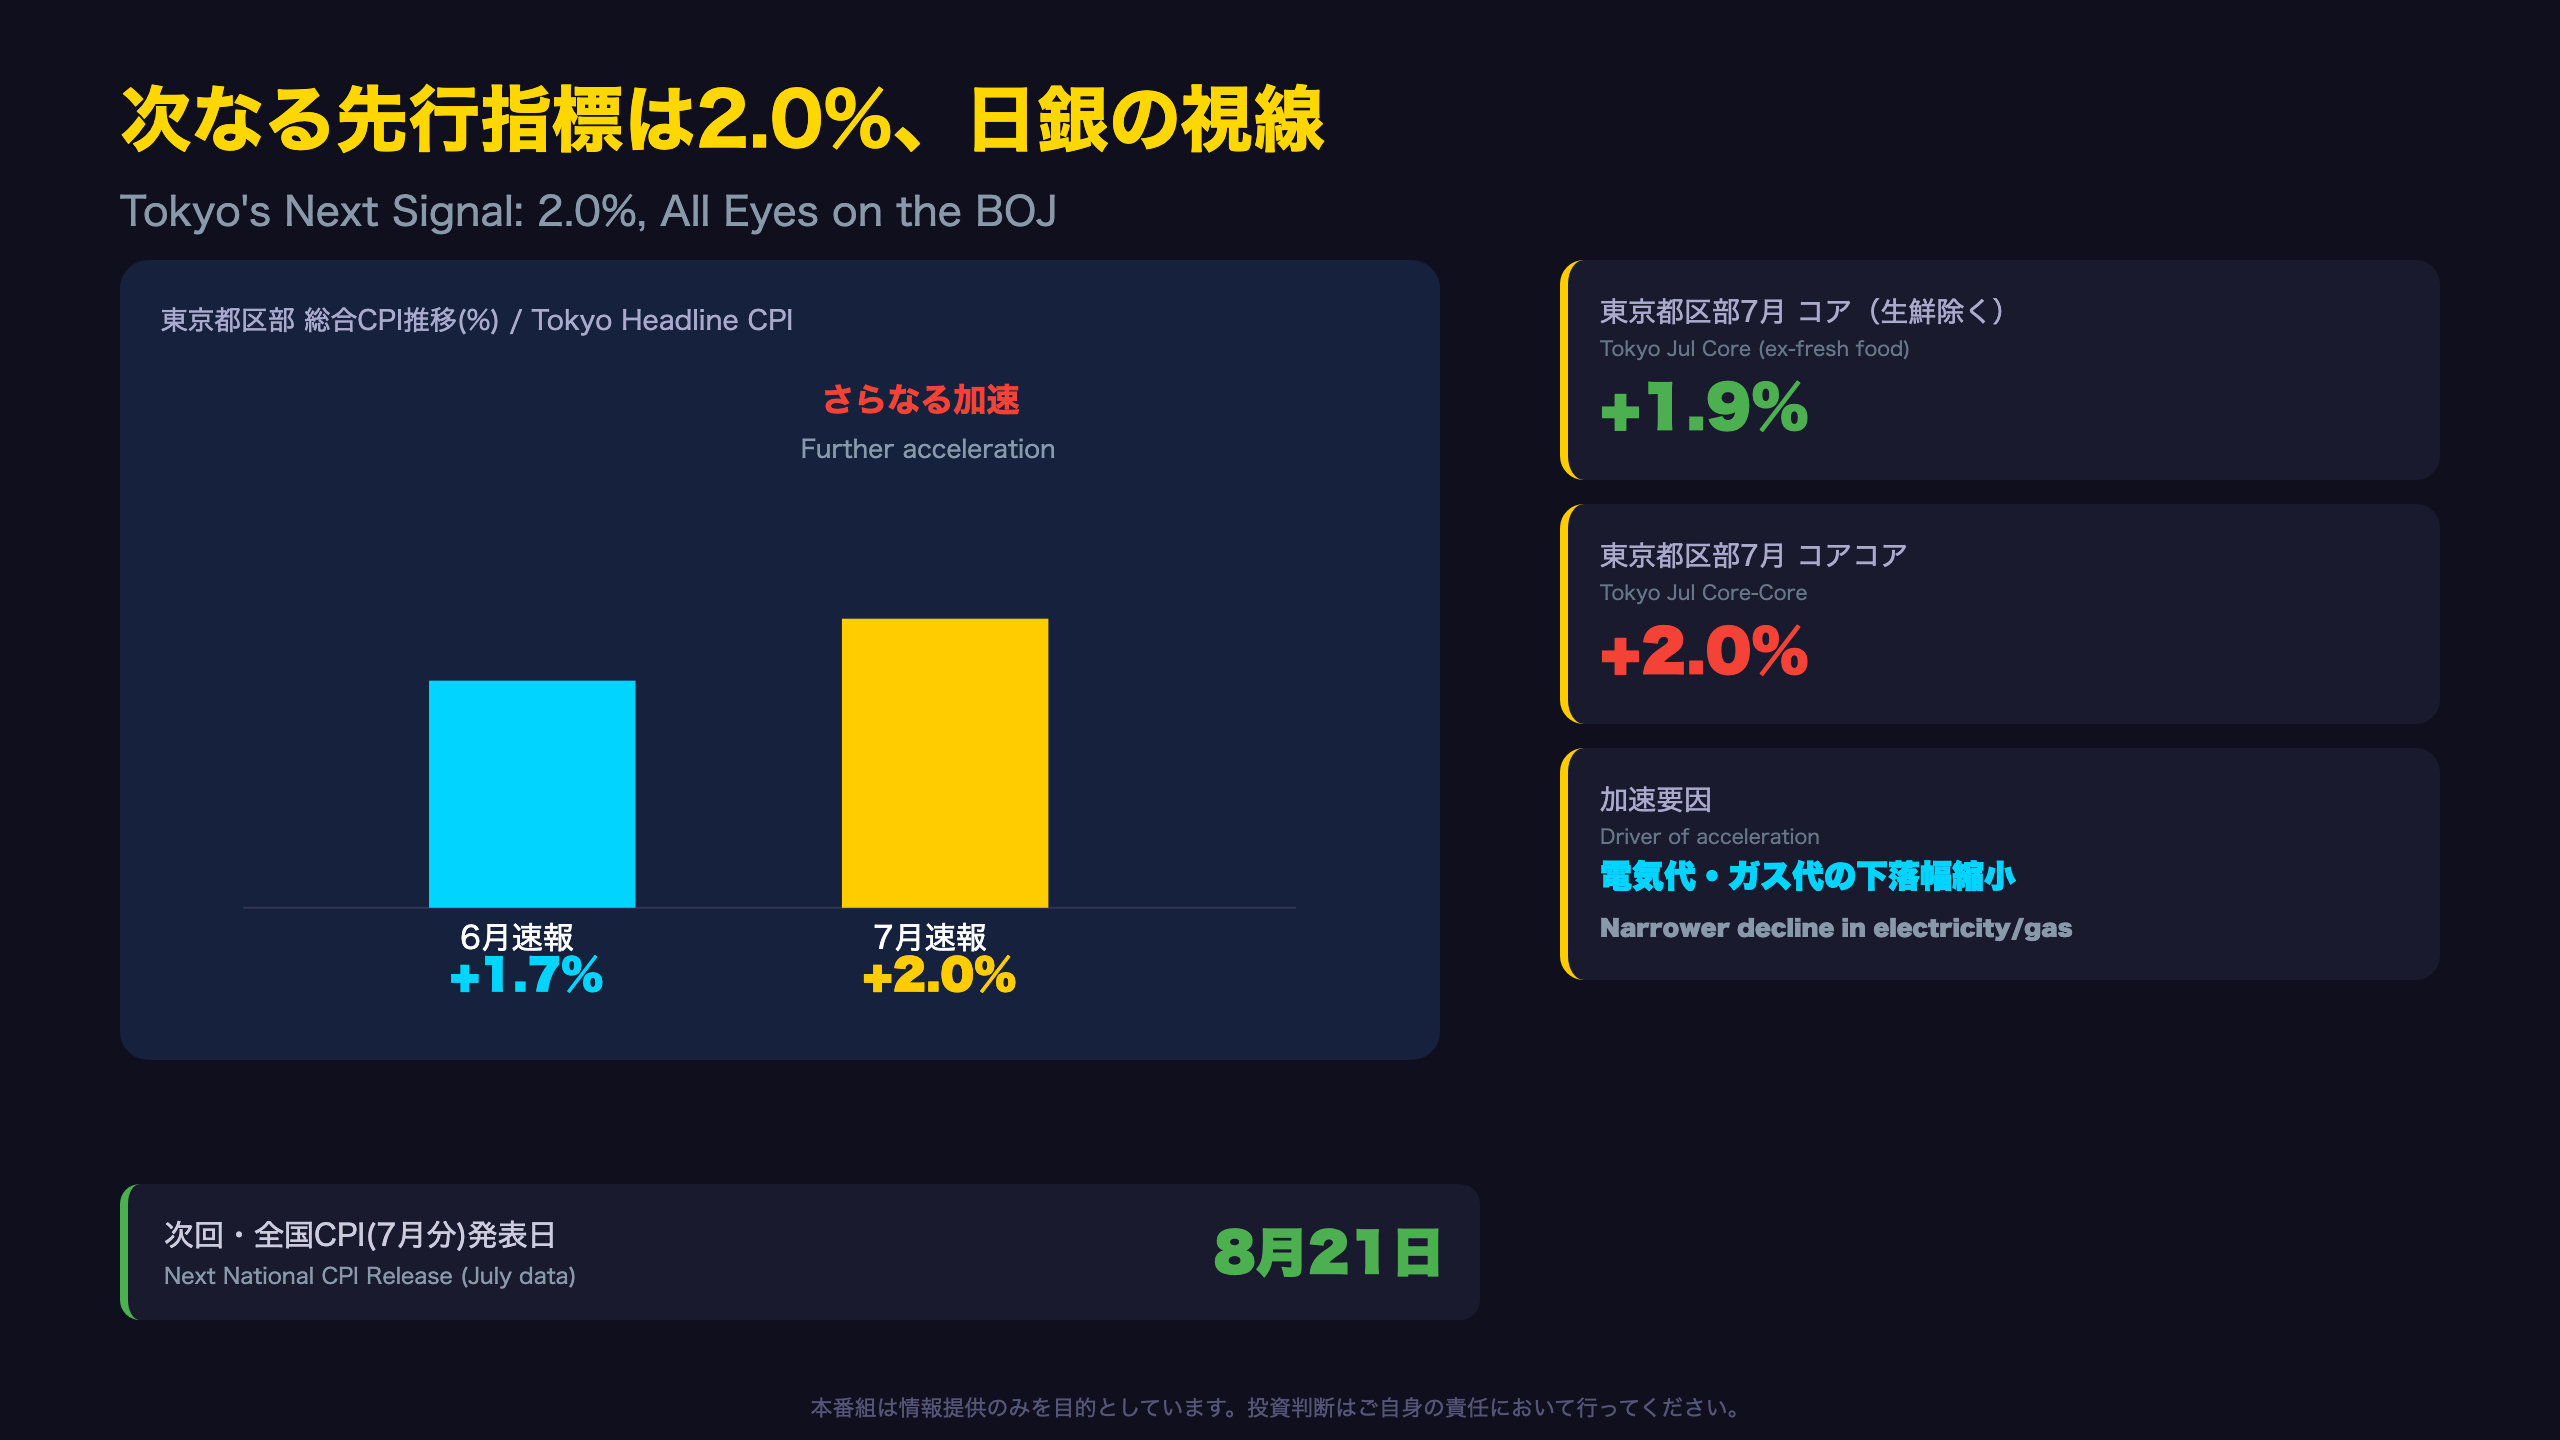
Released July 31, 2026, Tokyo’s mid-month flash CPI showed the headline index at 113.2, up 2.0% year-on-year (accelerating from 1.7% in June). Core (ex-fresh food) rose 1.9% (vs 1.6% in June), and core-core (ex-fresh food & energy) rose 2.0% (vs 1.9% in June).
From the Tokyo release: “A narrower decline in electricity and city gas prices widened the headline’s rate of increase by 0.09 percentage points due to energy.”
This mirrors the exact base-effect pattern seen in the national June data, reinforcing the case that national July figures (due August 21) will likely show a similar boost — a reasonably confident inference given the pattern now spans two consecutive readings and two geographic scopes.
New Upside Drivers Specific to Tokyo
Tokyo also saw incremental contributions from durable recreational goods and household consumable items — categories that weren’t material drivers in the national June data, worth watching for whether they spread nationally.
Implications for the Bank of Japan
The BOJ’s policy framework centers on “sustainable and stable” achievement of its 2% inflation target — a benchmark international readers can compare to the Fed’s flexible average inflation targeting or the ECB’s symmetric 2% goal. Taken in isolation, today’s core-core deceleration trend doesn’t obviously justify an imminent rate hike. However, Tokyo’s leading data suggests energy-driven headline support will likely persist for several more months, keeping the headline print near the 2% threshold — a dynamic JPY and JGB market participants will be watching closely.
The next national CPI release (July data) is scheduled for August 21, 2026. Key questions: will Tokyo’s acceleration be replicated nationally, and does the core-core deceleration trend continue?
Disclaimer: This article is for informational purposes only. All investment decisions are made solely at your own risk.